


1. Summary
- The Government of Ontario (the Province), through the Ministry of Municipal Affairs and Housing (MMAH), provides subsidized housing programs in collaboration with the federal government and municipalities.
- The Province’s subsidized housing programs assist low- and moderate-income households by providing funding for homeownership assistance, the construction of below-market rent units, rent supplements and rent-geared-to-income assistance.
- At the request of a Member of Provincial Parliament, this report reviews historical and projected spending on provincial subsidized housing programs, estimates the number of households supported, and projects the impact of provincial subsidized housing programs on subsidized housing need.
Total Spending on Provincial Subsidized Housing Programs
- On a nominal dollar basis (i.e., not adjusted for inflation), spending on provincial subsidized housing programs by all levels of government increased at an average annual rate of 2.2 per cent, from $1.3 billion in 2004-05 to $2.0 billion in 2024-25. Looking forward, the FAO estimates nominal spending on provincial subsidized housing programs will grow by an average of 3.1 per cent annually, reaching $2.2 billion in 2027-28.
- On an inflation-adjusted basis (i.e., real 2025-26 dollars), spending on provincial subsidized housing programs decreased at an average annual rate of 0.1 per cent, from $2.1 billion in 2004-05 to $2.0 billion in 2024-25. Looking forward, the FAO estimates inflation-adjusted spending on provincial subsidized housing programs will grow by an average of 1.0 per cent annually, reaching $2.1 billion in 2027-28.
Spending by Level of Government[1]
- Each level of government has a role in funding and delivering the Province’s subsidized housing programs. The federal government provides funding to the Province through federal transfers based on bilateral agreements that prescribe the types of programs, delivery methods and targets. The Province, through MMAH, governs subsidized housing programs through provincial legislation and provides additional funding from provincial own-source revenues. Municipalities[2] deliver provincial programs using funding from the Province (including federal transfers) and municipal own-source revenues.
- On a nominal dollar basis (i.e., not adjusted for inflation), municipal spending is projected to increase at an average annual rate of 2.4 per cent from 2004-05 to 2027-28, federal government spending is projected to increase at a 2.1 per cent average annual rate, and provincial spending is projected to grow by 2.0 per cent per year.
- In 2004-05, provincial subsidized housing program spending consisted of $747 million of municipal spending, $422 million of federal government spending and $139 million of provincial spending. In 2027-28, the FAO projects provincial subsidized housing program spending will consist of $1.3 billion of municipal spending, $687 million of federal government spending and $217 million of provincial spending.
- On an inflation-adjusted basis (i.e., real 2025-26 dollars), real municipal spending is projected to grow at an average annual rate of 0.2 per cent from 2004-05 to 2027-28, real federal government spending is projected to decrease by an average annual rate of less than 0.1 per cent, and real provincial spending is expected to decrease by an average annual rate of 0.2 per cent.
- In 2004-05, after adjusting for inflation, municipalities spent $1.18 billion on provincial subsidized housing programs, the federal government spent $668 million and the Province spent $219 million. In 2027-28, the FAO estimates that inflation-adjusted spending by municipalities will increase to $1.23 billion, while real spending by the federal government and the Province will decrease to $660 million and $209 million, respectively.
- As a share of total spending, from 2004-05 to 2024-25, municipalities contributed an average of 56.8 per cent of total provincial subsidized housing program spending, the federal government contributed 29.9 per cent and the Province contributed 13.3 per cent.
- In general, between 2004-05 and 2021-22, the share of provincial subsidized housing program spending funded by municipalities increased (57.1 per cent to 69.1 per cent), while the share funded by the federal (32.3 per cent to 25.0 per cent) and provincial governments (10.6 per cent to 5.9 per cent) decreased. These decreases were due to a combination of increased municipal spending to absorb the rising cost of housing subsidies and the gradual expiration of federal-provincial funding commitments.
- From 2021-22 to 2027-28, the trend is projected to reverse due to new spending under the National Housing Strategy (NHS), with the share of spending funded by the federal and provincial governments increasing to 31.4 per cent and 9.9 per cent, respectively, while the share of spending funded by municipalities is expected to decline to 58.7 per cent.
Spending by Program
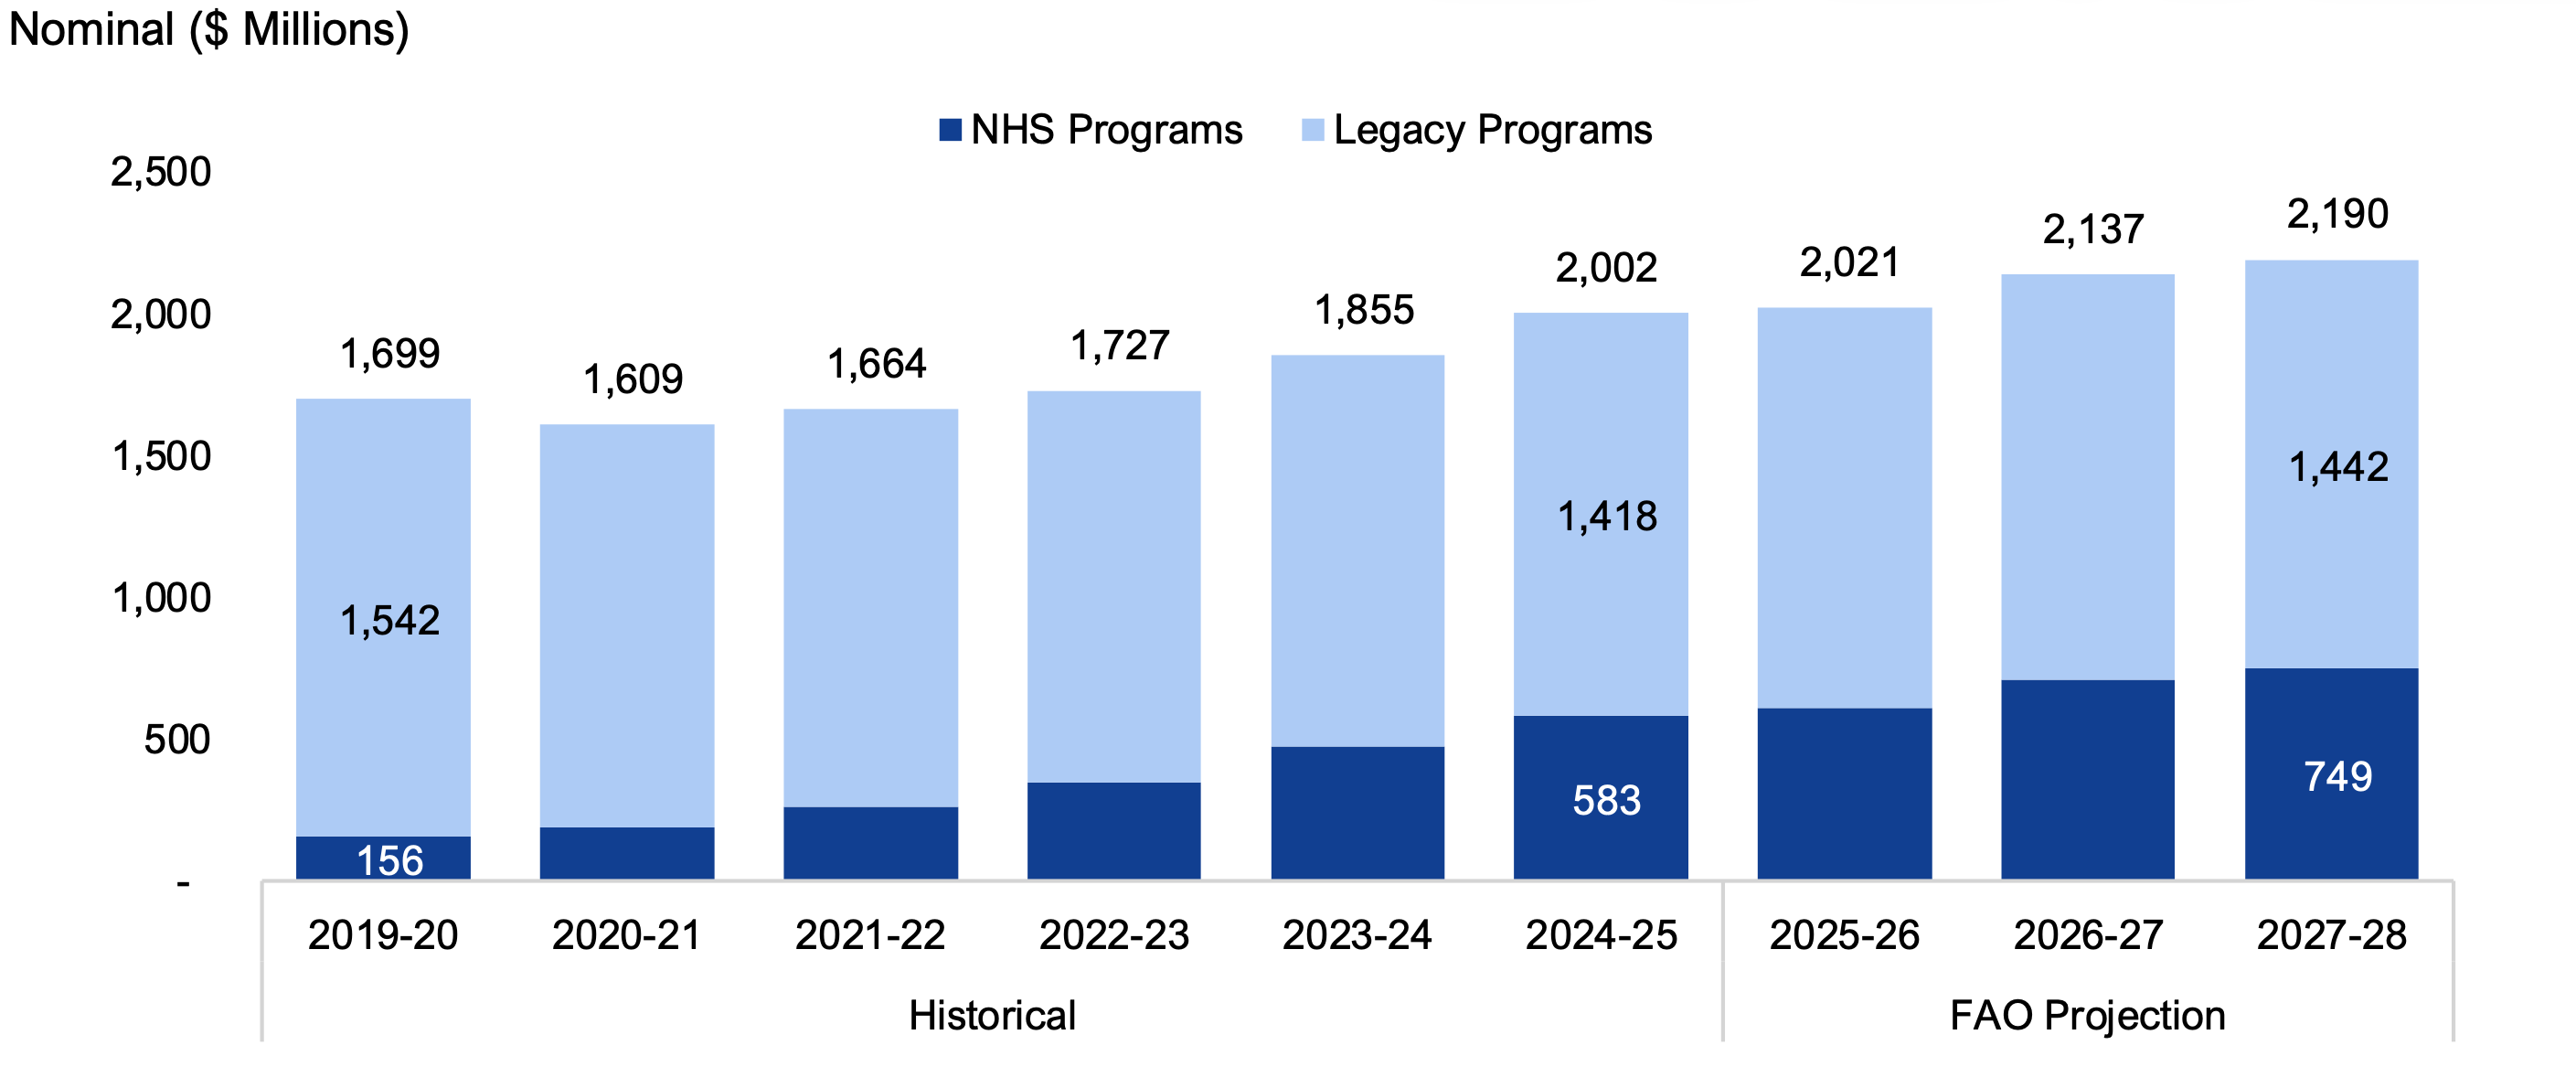
- The FAO categorizes provincial subsidized housing program spending as legacy program spending and NHS program spending.
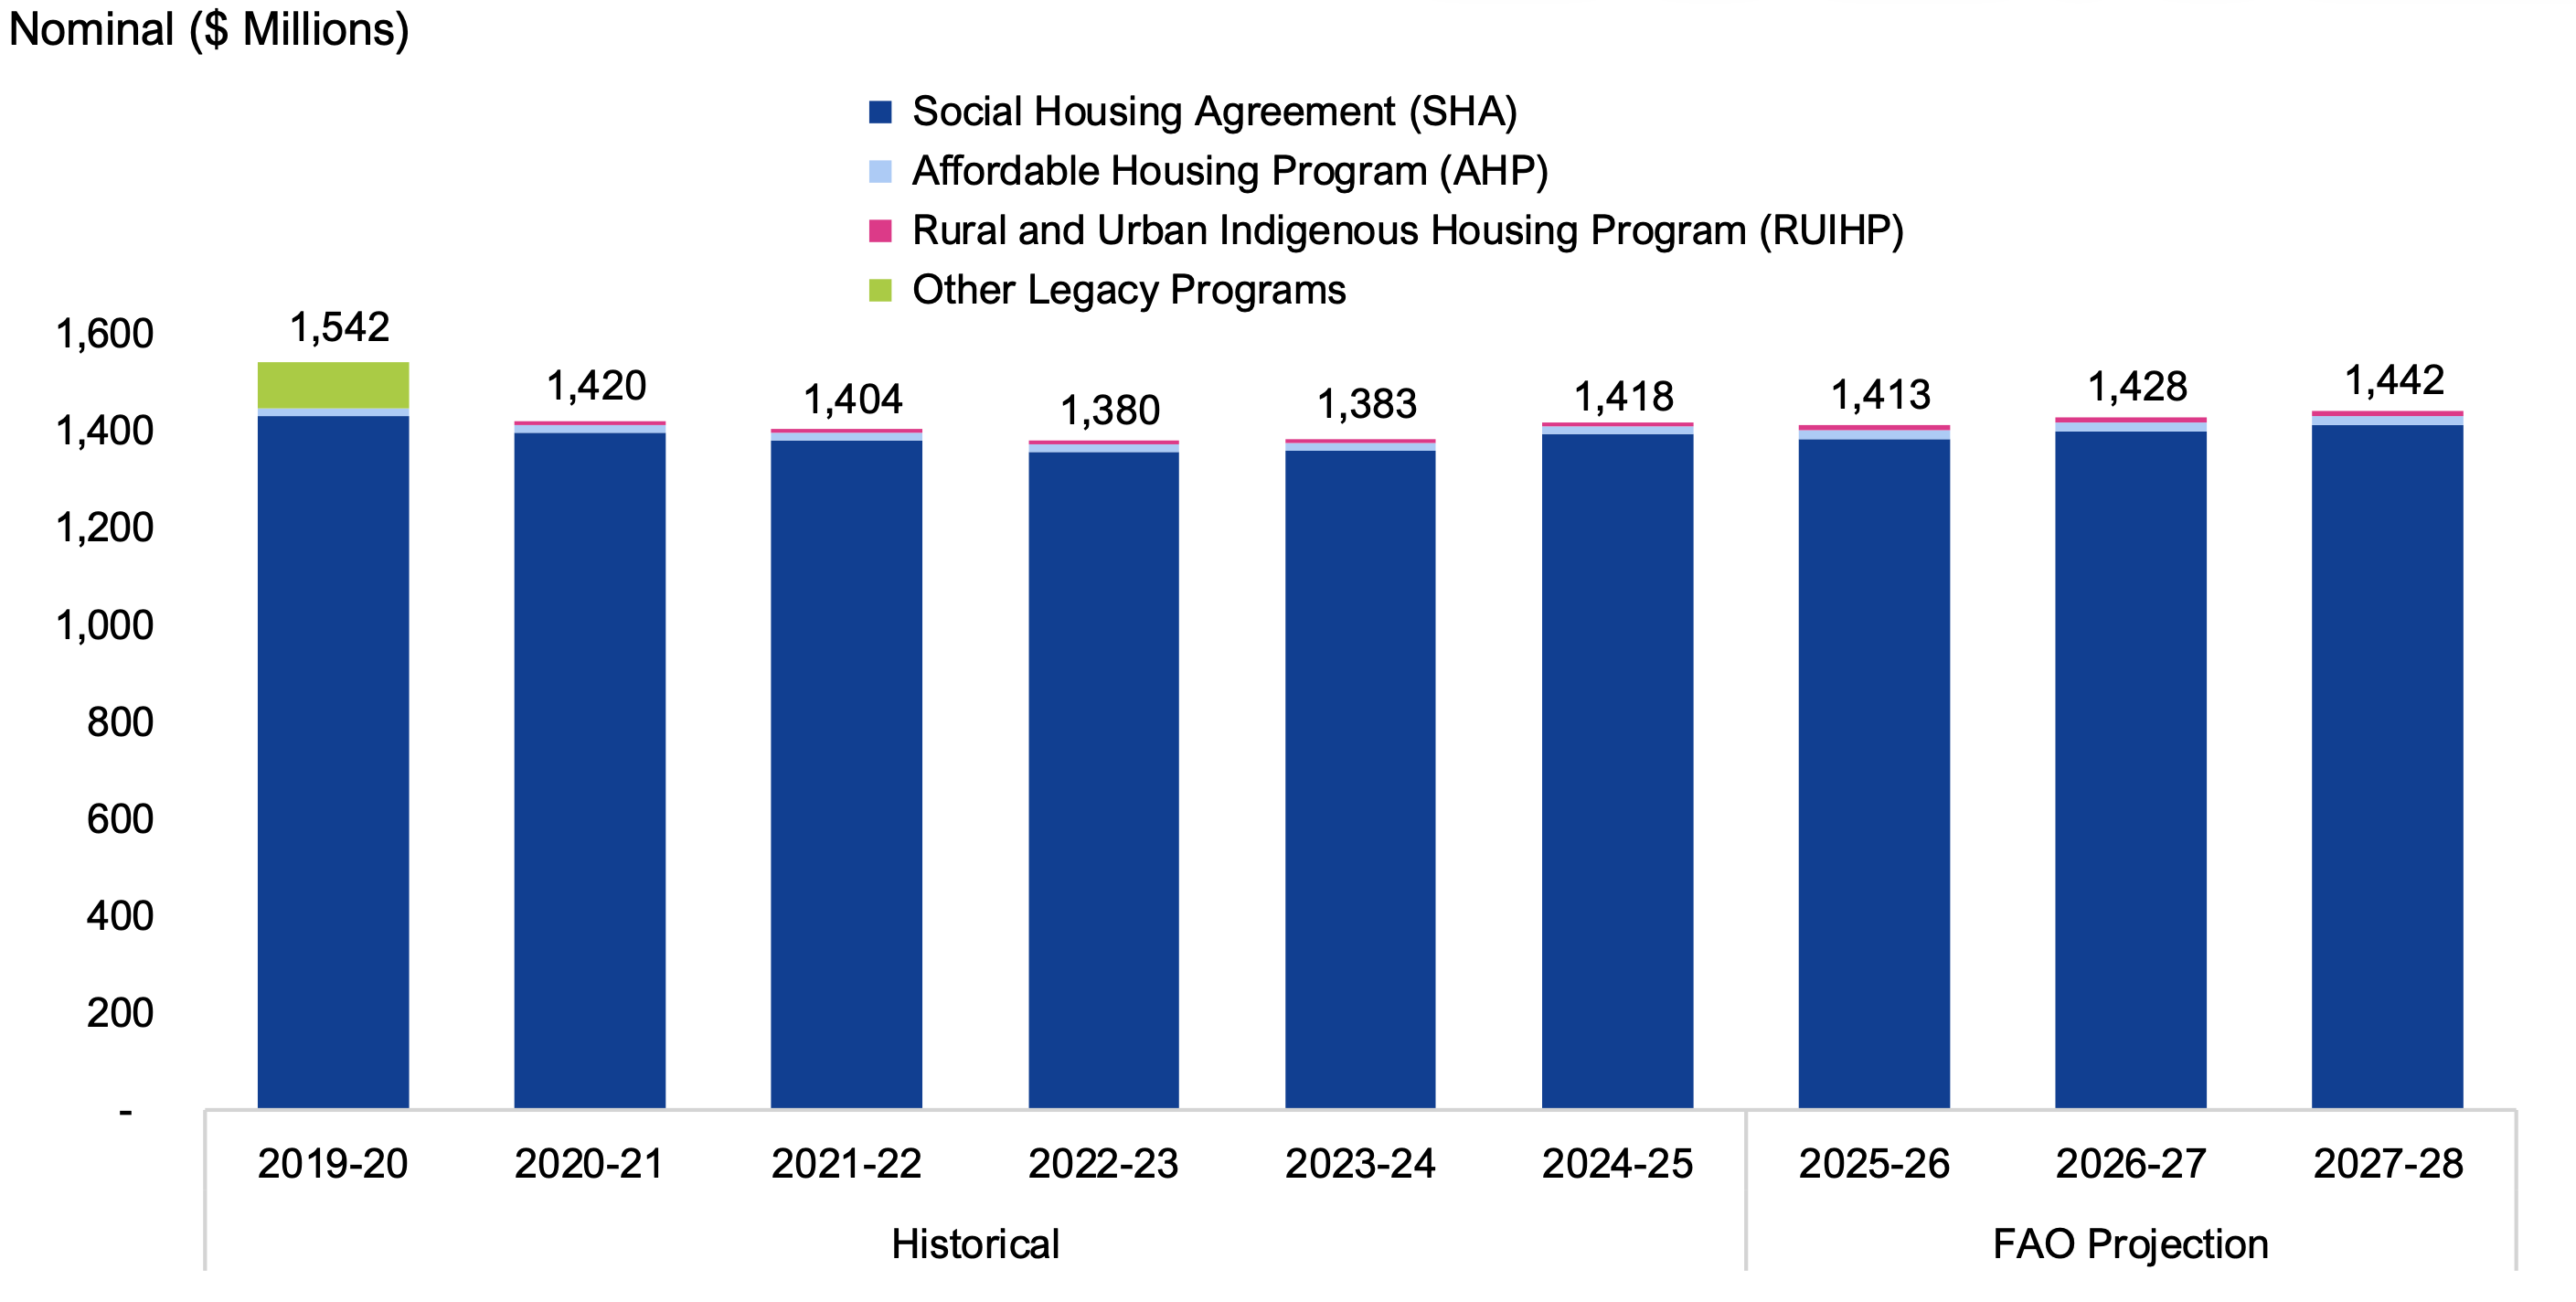
- Legacy housing programs primarily consist of the Social Housing Agreement (SHA) and Affordable Housing Program (AHP). Legacy housing programs spending decreased from $1.5 billion in 2019-20 to $1.4 billion in 2024-25. The decline over this period was largely driven by the expiration of federal transfers under the SHA and the conclusion of the Investment in Affordable Housing Extension program. Between 2024-25 and 2027-28, the FAO projects legacy housing programs spending will remain at $1.4 billion, with the majority of funding contributed by municipalities.
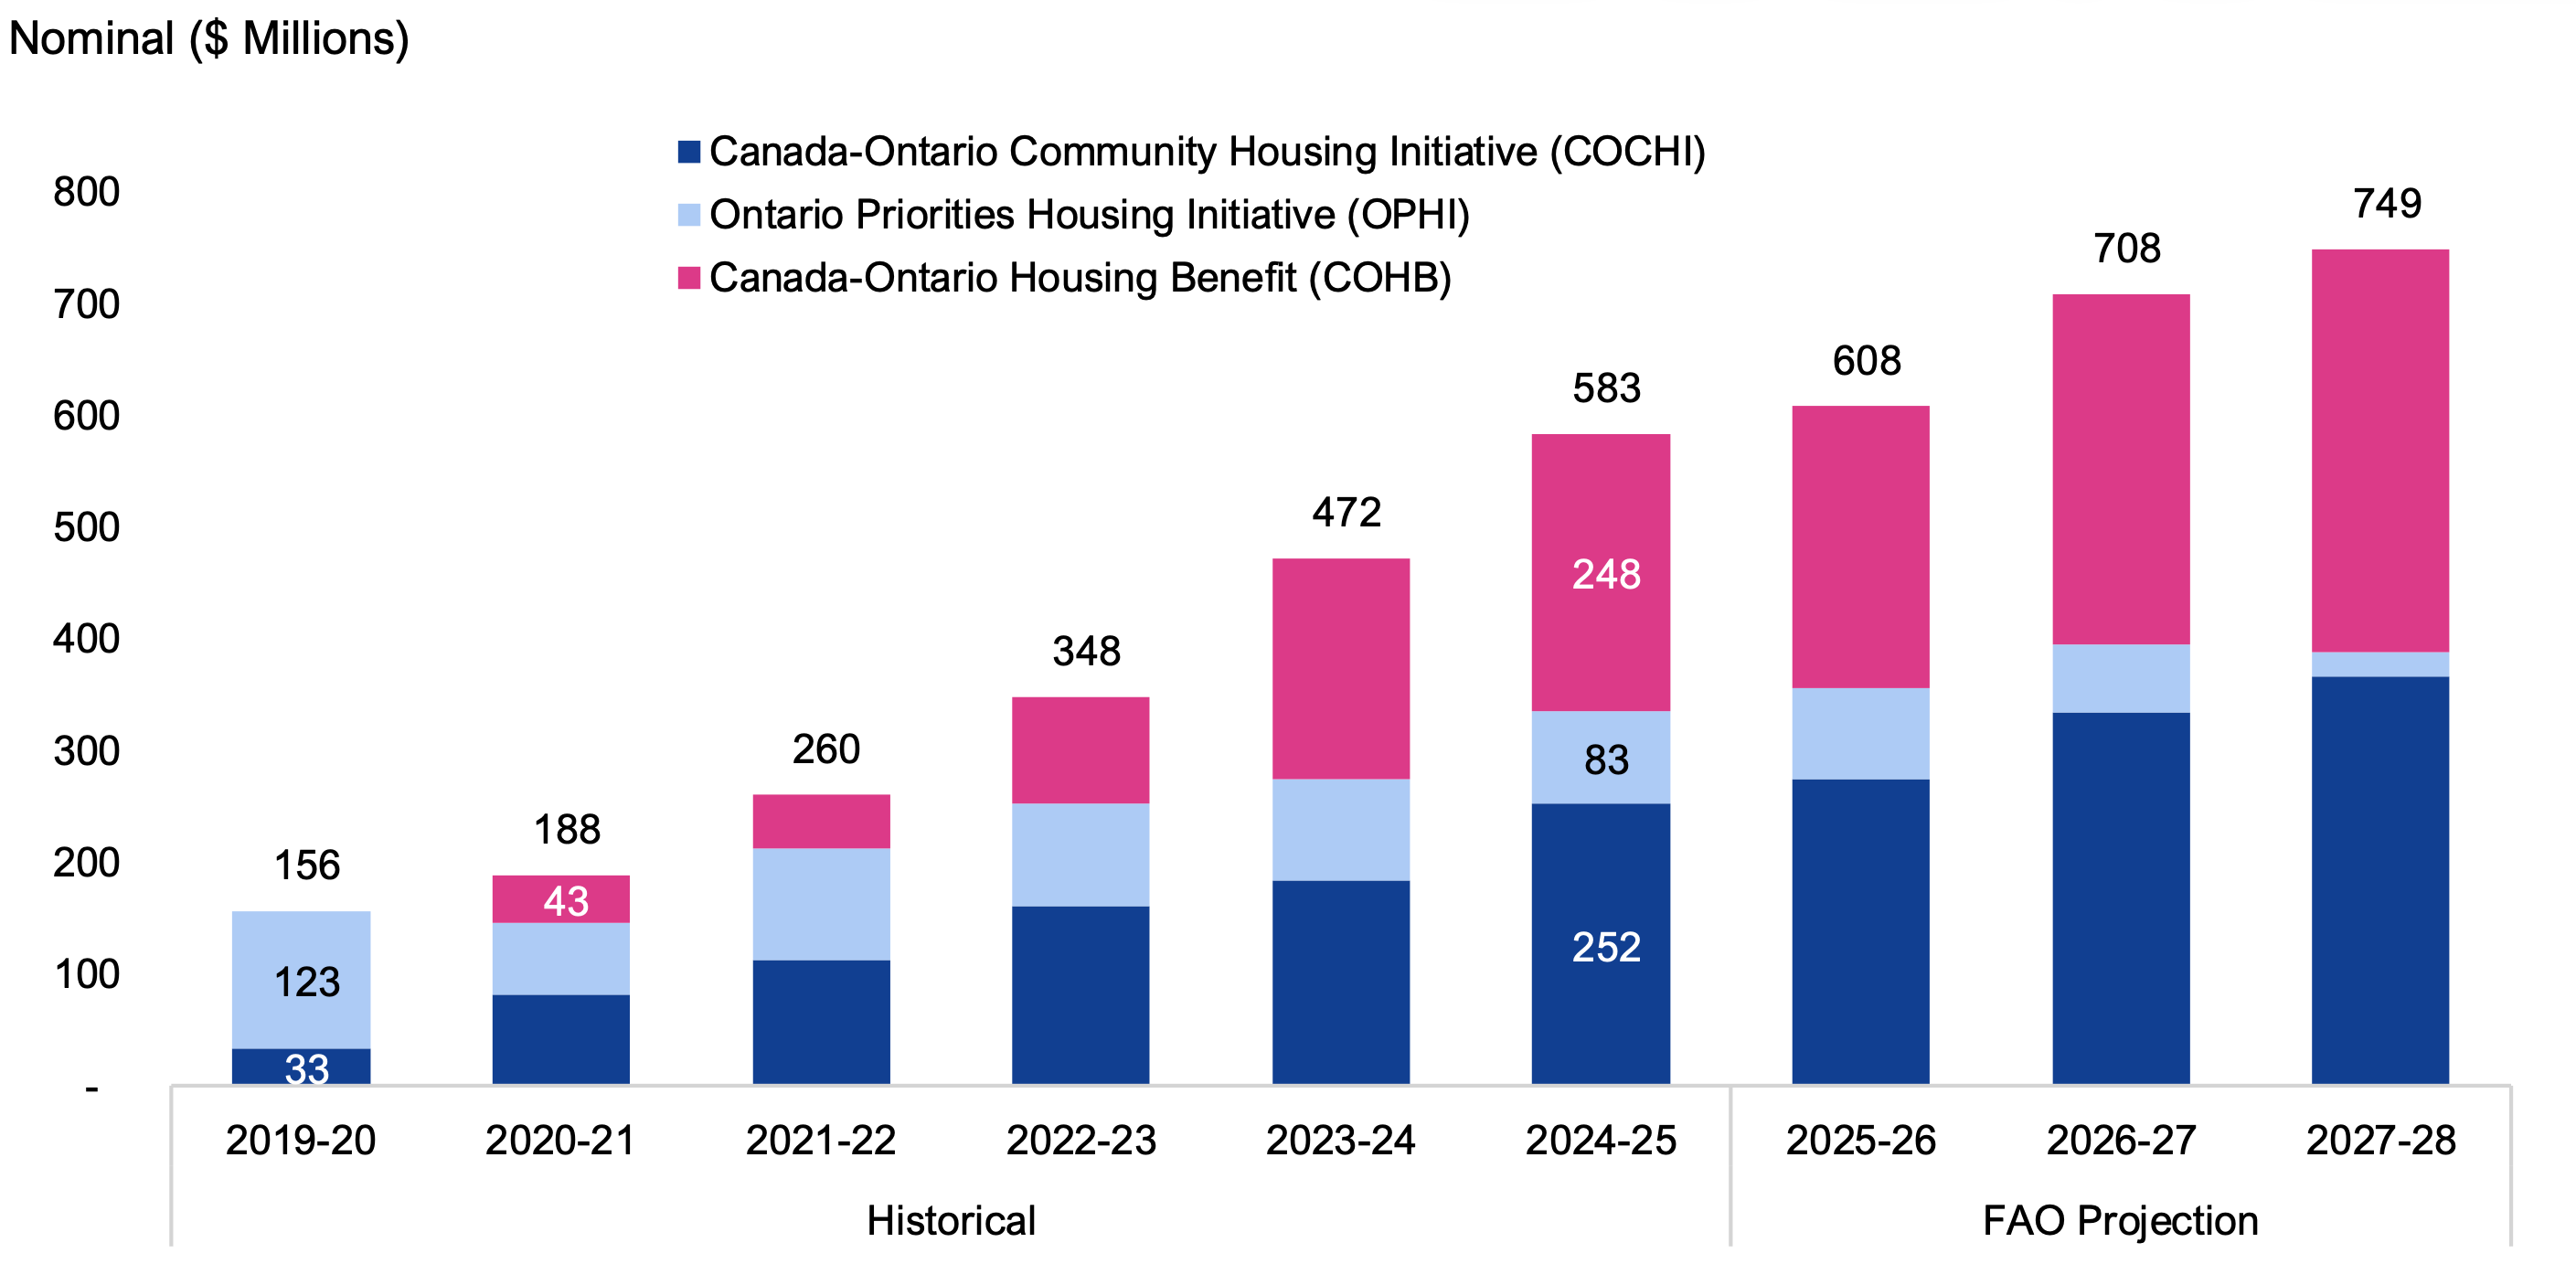
- The NHS is a 10-year federal-provincial agreement introduced in 2019 with the aim to preserve and expand subsidized housing support through three cost-shared programs: the Canada-Ontario Community Housing Initiative (COCHI), the Ontario Priorities Housing Initiative (OPHI) and the Canada-Ontario Housing Benefit (COHB). Spending on NHS programs was $156 million in 2019-20 and is projected to reach $749 million in 2027-28. By level of government, the FAO projects that the federal government will spend $559 million in 2027-28, while the Province will spend $189 million.
Households Supported by Provincial Subsidized Housing Programs[3]
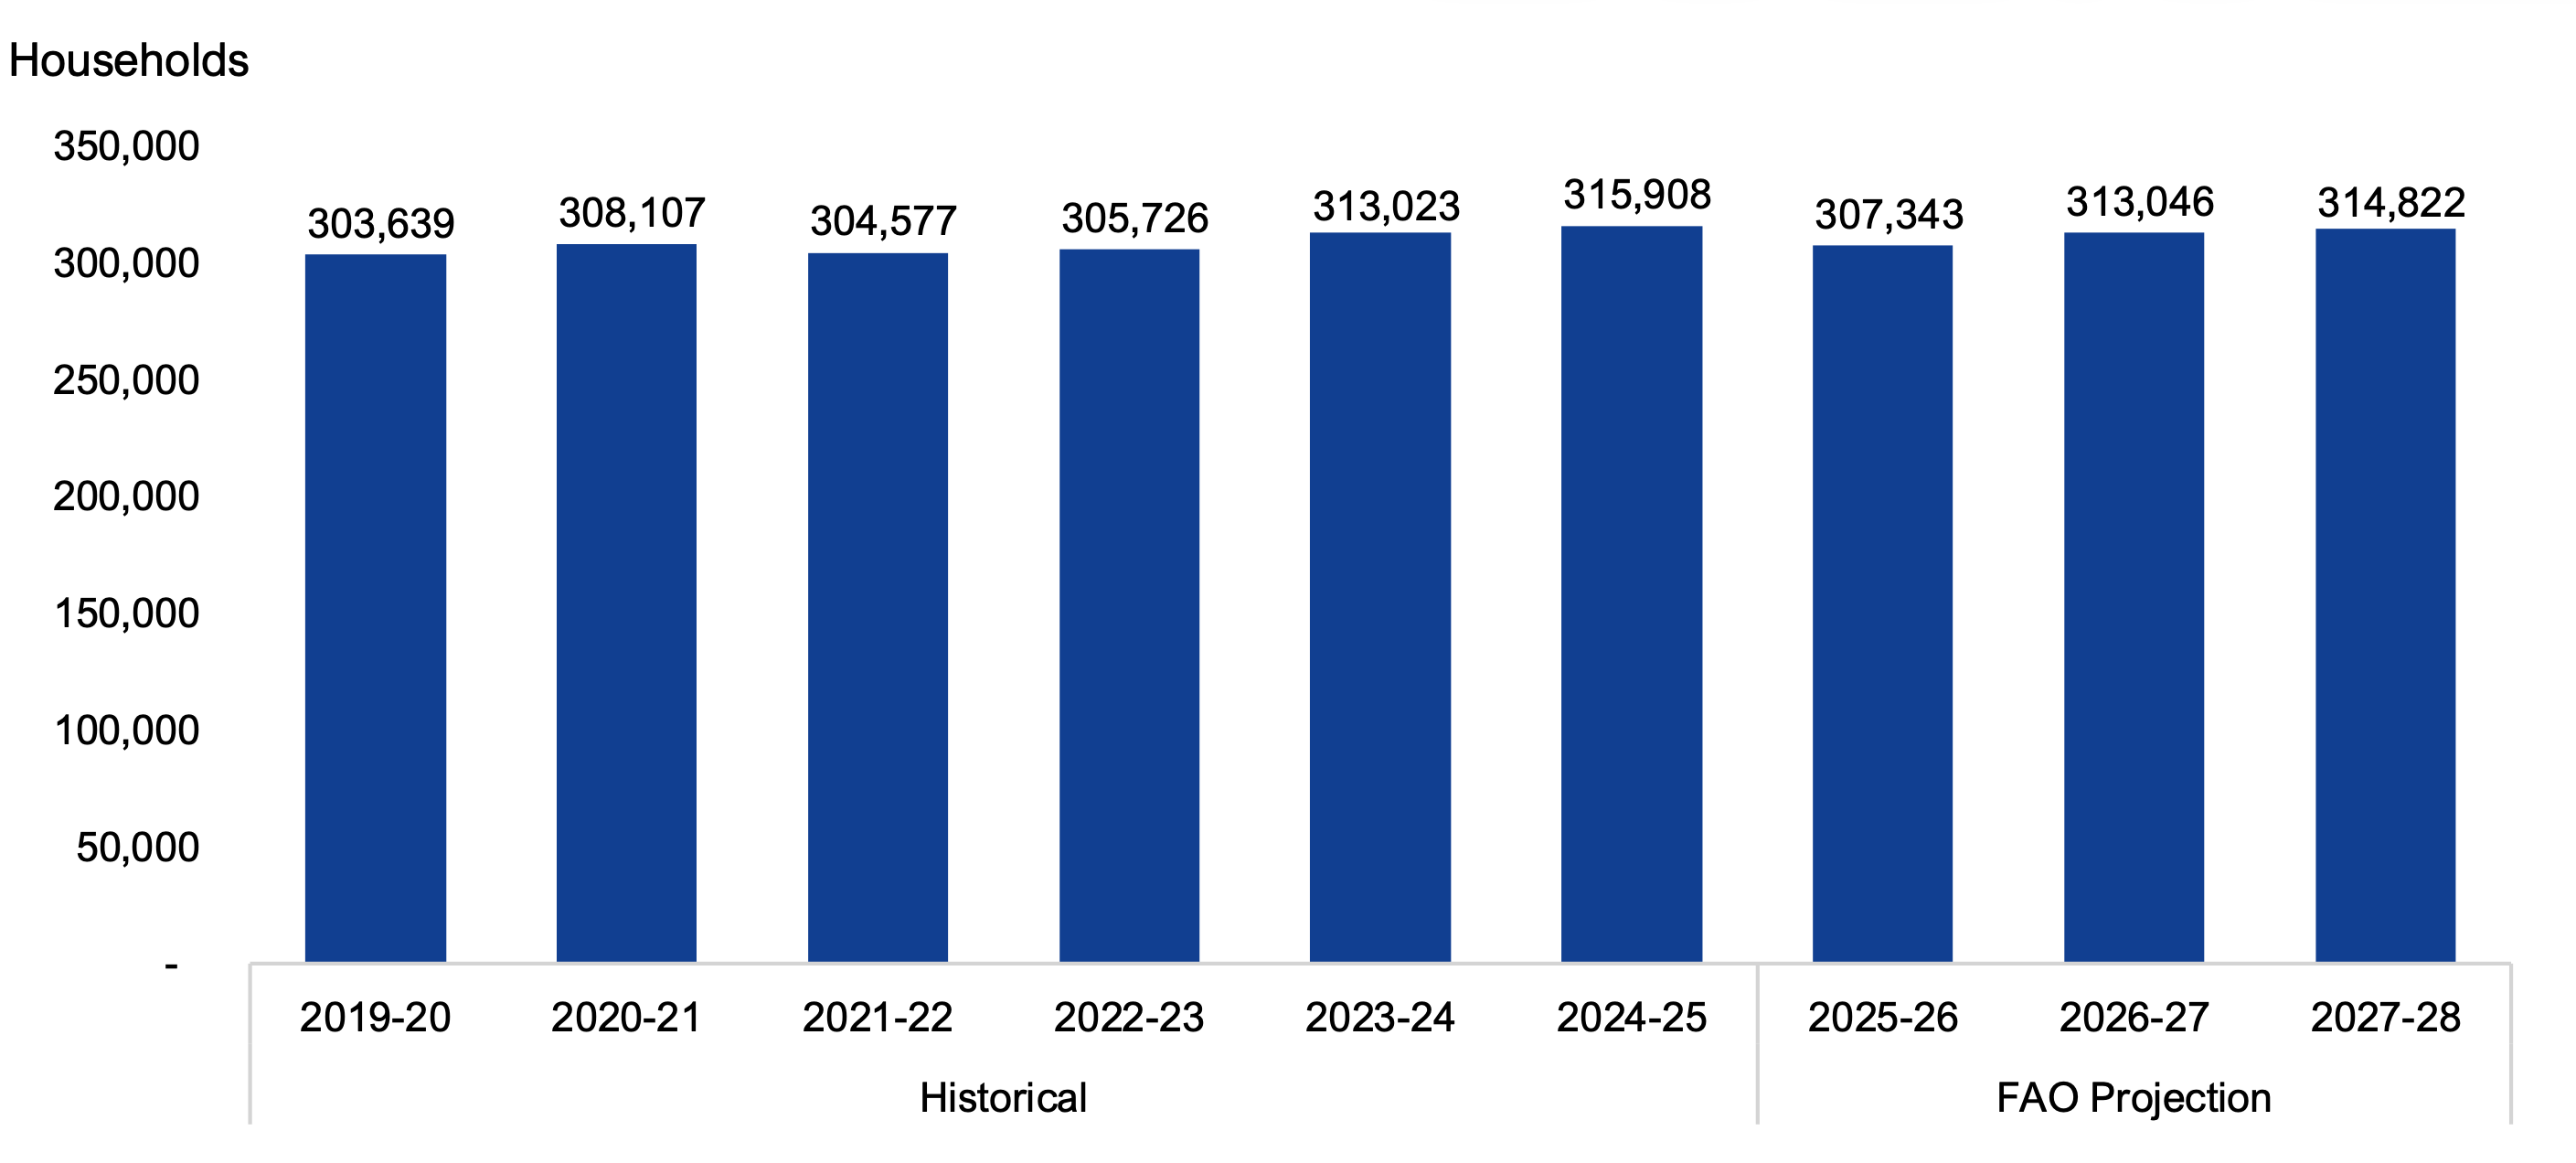
- The number of households supported by provincial subsidized housing programs is projected to increase from 303,639 households in 2019-20 to 314,822 households in 2027-28 due to an increase in support under NHS programs, partially offset by lower support under legacy programs and homelessness programs.[4]
- In 2019-20, 282,293 households (93.0 per cent of total households supported) received support under legacy housing programs, 11,701 (3.9 per cent) were supported by NHS programs, and 9,645 (3.2 per cent) were supported by homelessness programs.
- By 2027-28, the FAO estimates that the number of households supported by legacy housing programs will decrease to 238,291 households (75.7 per cent of total households supported), households supported by NHS programs will increase to 69,558 households (22.1 per cent) and households supported by homelessness programs will decrease to 6,973 households (2.2 per cent).
- Provincial subsidized housing programs provide four overall types of support: rent-geared-to-income (RGI) assistance, below-market rent units, rent supplements and homeownership assistance.
- The FAO projects that the number of households receiving RGI assistance, living in below-market rent units and receiving homeownership assistance will decrease from 2019-20 to 2027-28, as these types of support provided under legacy programs expire faster than projected increases under NHS programs:
- the number of households receiving RGI assistance is projected to decrease from 192,110 in 2019-20 to 187,179 in 2027-28;
- the number of households living in below-market rent units is projected to decrease from 80,845 in 2019-20 to 71,557 in 2027-28; and
- the number of households receiving homeownership assistance is projected to decrease from 7,355 in 2019-20 to 7,097 in 2027-28.
- The number of households receiving rent supplements is projected to increase from 23,329 in 2019-20 to 48,989 in 2027-28 due to an increase in rent supplements created through NHS programs.
- The FAO projects that the number of households receiving RGI assistance, living in below-market rent units and receiving homeownership assistance will decrease from 2019-20 to 2027-28, as these types of support provided under legacy programs expire faster than projected increases under NHS programs:
Impact of Provincial Subsidized Housing Programs on Housing Need
- The FAO defines a household as in need of subsidized housing if the household does not live in acceptable housing and cannot afford alternative acceptable housing,[5] without subsidized housing support. Housing is considered unacceptable if it is in need of major repairs, it has an insufficient number of bedrooms for the household’s size, or its cost exceeds 30 per cent of the household’s before-tax income.[6]
- The number of Ontario households in need of subsidized housing is projected to increase from 911,606 households in 2018-19 to 1,045,263 households in 2024-25, an increase of 133,657 households or 14.7 per cent. In 2024-25, 16.8 per cent of all Ontario households were in need of subsidized housing.
- The FAO estimates that, of the 1,045,263 Ontario households that were in need of subsidized housing in 2024-25, 315,908 (30.2 per cent of households in need) received provincial subsidized housing program support and 729,355 (69.8 per cent of households in need) did not receive support from provincial subsidized housing programs.
- Of the 315,908 households that received support, 229,970 households received sufficient support to make housing affordable by reducing their shelter costs to less than 30 per cent of household before-tax income. The remaining 85,938 households continued to face unaffordable housing costs (i.e., shelter costs that exceeded 30 per cent of household before-tax income).
- Of the 729,355 households in need of subsidized housing but not served by any provincial subsidized housing program, the FAO estimates that 397,881 households were ineligible for subsidized housing program support while 331,474 households did not receive support because of limited program capacity.
- In total, the FAO estimates that 815,293 households (13.1 per cent of all Ontario households) were in need of subsidized housing but either did not receive support (729,355 households) or received insufficient support to make their housing affordable (85,938 households).
- Going forward, from 2024-25 to 2027-28, the number of households in need of subsidized housing is projected to increase by 87,131 households (8.3 per cent) to 1,132,394 households (17.6 per cent of all households in Ontario).
- The FAO projects that the number of households that receive sufficient support to make their housing affordable will increase from 229,970 households in 2024-25 to 238,380 households in 2027-28, an increase of 8,410 households (3.7 per cent), driven mainly by the expansion of COHB.
- The FAO estimates that the number of Ontario households in need of subsidized housing that either did not receive support or received insufficient support to make their housing affordable will grow from 815,293 households in 2024-25 to 894,014 households in 2027-28, an increase of 78,721 households (9.7 per cent).
2. Introduction
The Government of Ontario (the Province), through the Ministry of Municipal Affairs and Housing (MMAH), provides subsidized housing programs in collaboration with the federal government and municipalities.[7] The Province’s subsidized housing programs assist low- and moderate-income households by providing funding for homeownership assistance, the construction of below-market rent units, rent supplements[8] and rent-geared-to-income assistance.
In March 2021, the FAO published a report, Housing and Homelessness Programs in Ontario, which reviewed the Province’s subsidized housing programs and projected the impact of the programs on subsidized housing need.
At the request of a Member of Provincial Parliament, this report provides an update to the FAO’s 2021 report. The report reviews historical and projected spending on subsidized housing programs, estimates the number of households supported, and projects the impact of the subsidized housing programs on subsidized housing need.
This report is divided into the following chapters:
- Chapter 3 reviews historical and FAO projected spending from 2004-05 to 2027-28 in nominal and real dollars, and by level of government. The chapter also reviews spending by program from 2019-20 to 2027-28.
- Chapter 4 discusses the actual and projected number of households supported by the Province’s subsidized housing programs from 2019-20 to 2027-28, by program and type of support.
- Chapter 5 examines the impact of the Province’s subsidized housing programs on subsidized housing need and reviews the Province’s progress towards the targets set in the National Housing Strategy (NHS).
Scope
This report focuses on subsidized housing programs governed by the Ministry of Municipal Affairs and Housing, including provincial programs that have been transferred to and are administered by municipalities.[9] Housing support programs provided by other Ontario ministries or programs that support broader housing development without a subsidized housing component (e.g., the Building Faster Fund) are outside the scope of this report. In addition, housing programs that are administered independently by other levels of government that are outside of the provincial subsidized housing programs framework are also outside the scope of this report.
Methodology and Sources
The FAO’s analysis of provincial subsidized housing programs spending and households supported is based on data provided by the Ministry of Municipal Affairs and Housing. The FAO projects spending and households supported from 2024-25 to 2027-28 based on targets in the NHS Action Plan and bilateral agreement,[10] the Canada-Ontario Social Housing Agreement (SHA), and the FAO’s housing need model.
The FAO’s housing need model forecasts the number of households in need of subsidized housing using a microdata approach that incorporates projections of household income, shelter costs and population growth. This housing need model is complemented by a household shelter cost model that projects household rent and mortgage costs. The FAO’s models use data from the 2021 Census, 2023 Canadian Income Survey, the FAO’s economic forecast from the Winter 2026 Economic and Budget Outlook,[11] and other sources. Additional information on the FAO’s methodology is available upon request.
The FAO evaluates the Province’s progress towards NHS targets based on data provided by the Ministry of Municipal Affairs and Housing.
3. Spending on Subsidized Housing Programs
This chapter reviews historical and FAO projected spending on provincial subsidized housing programs from 2004-05 to 2027-28. The chapter then focuses on the 2019-20 to 2027-28 period to discuss recent developments and review spending by program. The spending figures presented in this chapter include combined spending by the Province, federal government and municipalities on provincial subsidized housing programs that are governed by MMAH.
Nominal and Real Spending on Subsidized Housing Programs
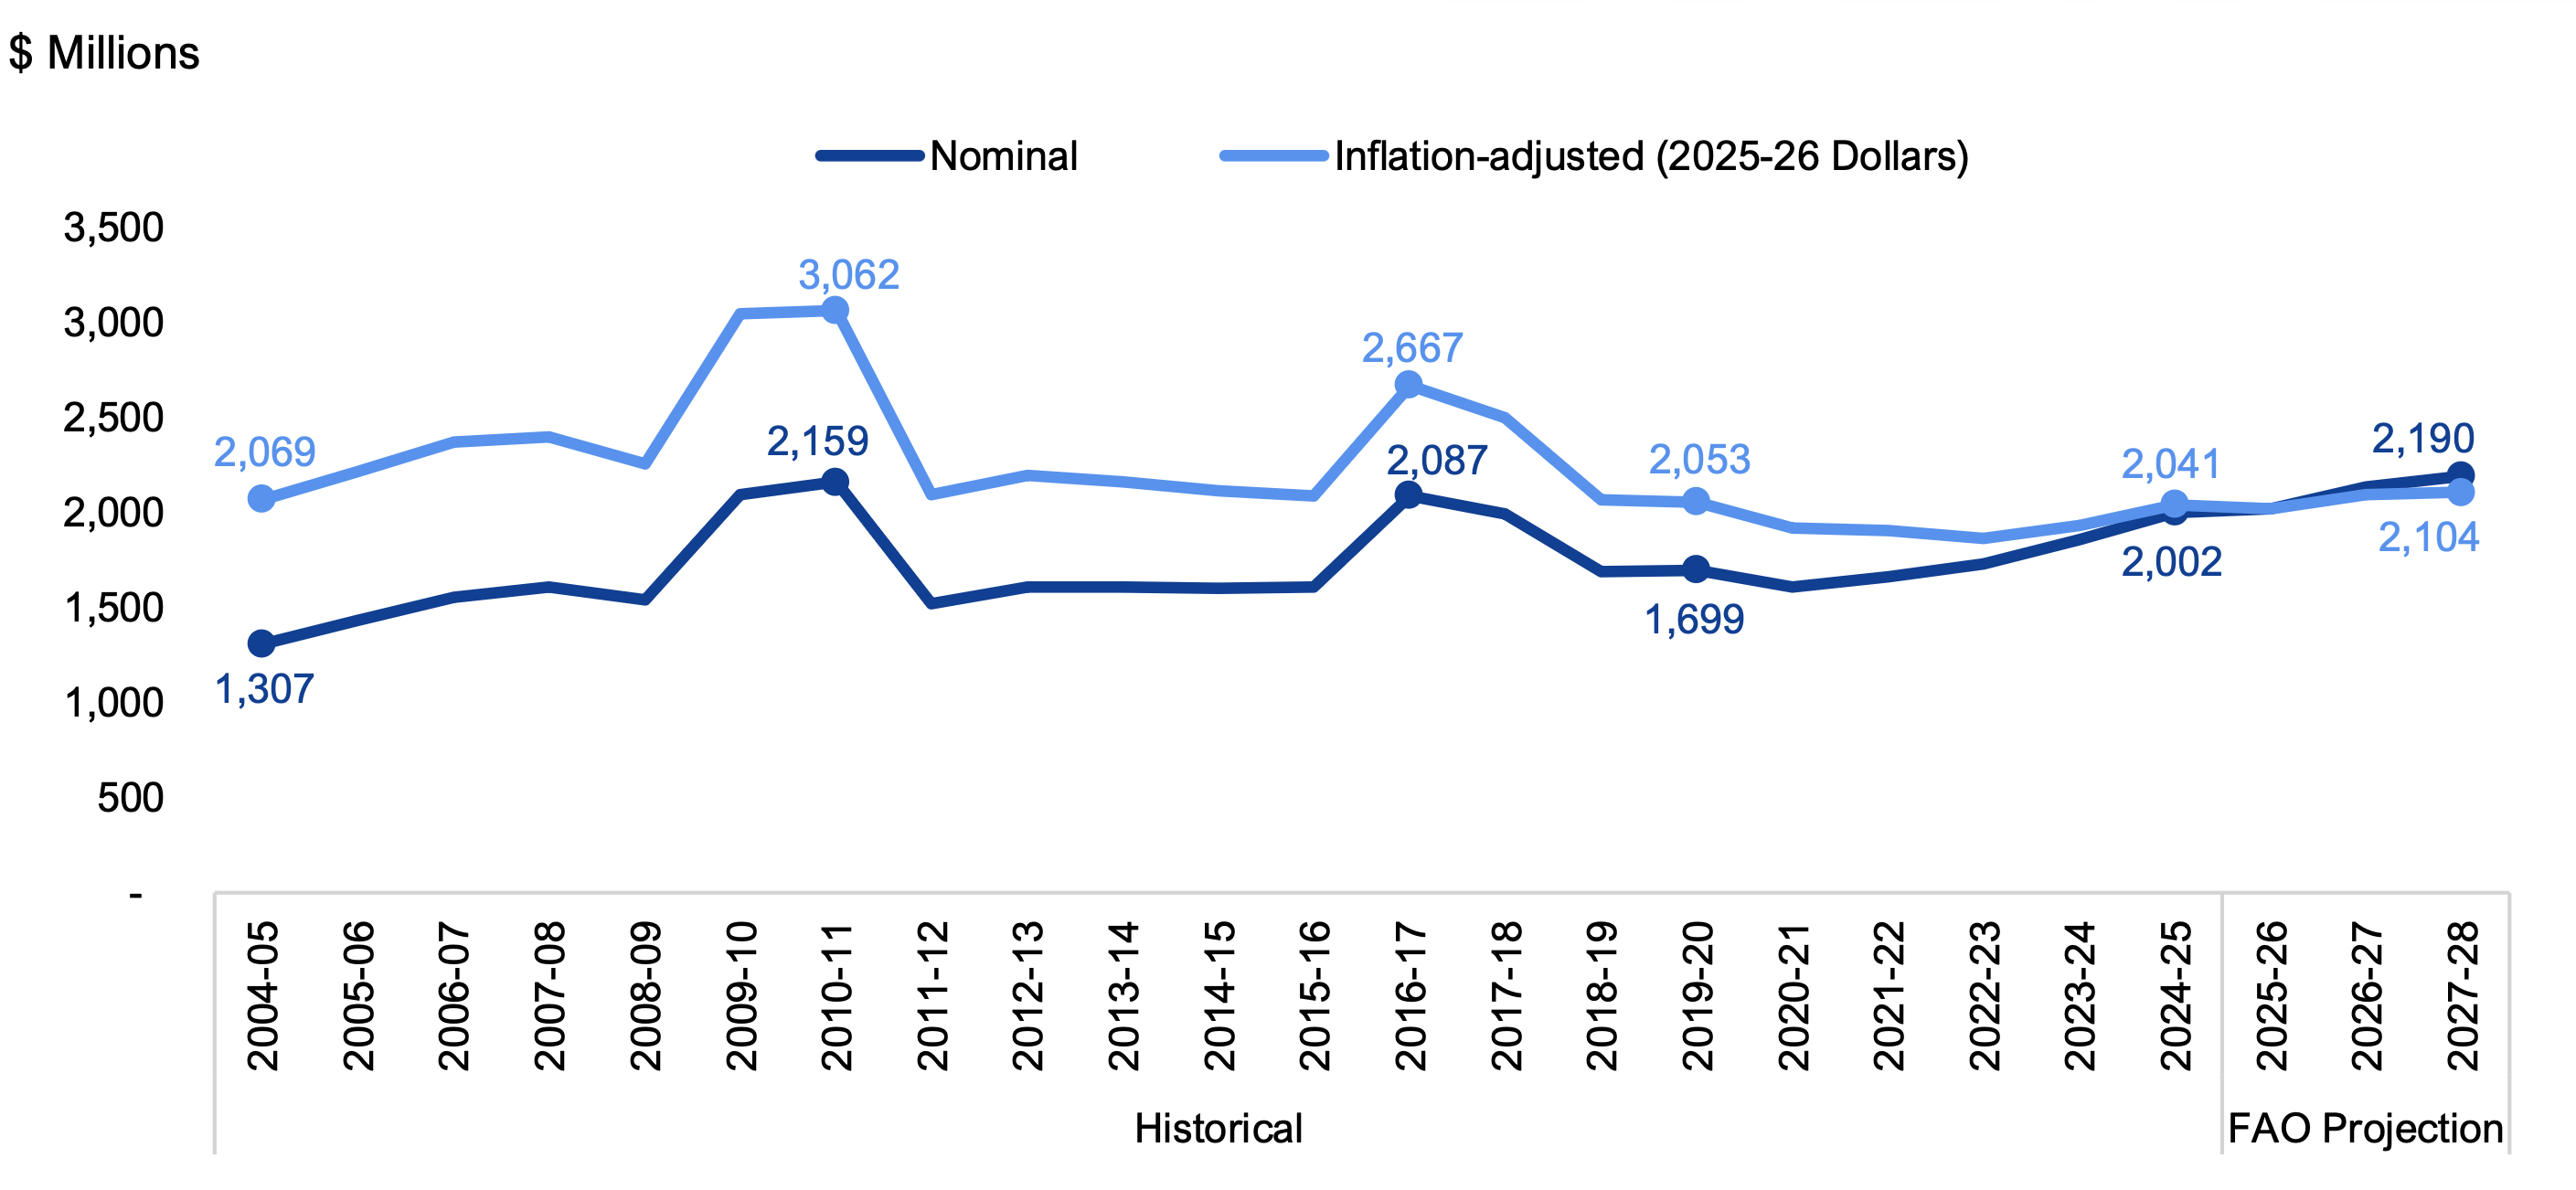
On a nominal dollar basis (i.e., not adjusted for inflation), spending on provincial subsidized housing programs by all levels of government increased at an average annual rate of 2.2 per cent, from $1.3 billion in 2004-05 to $2.0 billion in 2024-25. Looking forward, the FAO estimates nominal spending on provincial subsidized housing programs will increase at an average annual rate of 3.1 per cent, reaching $2.2 billion in 2027-28.
Figure 3.1 Nominal and inflation-adjusted historical and FAO projected spending on provincial subsidized housing programs by all levels of government, 2004-05 to 2027-28
Note: Spending figures include combined spending by the Province, federal government and municipalities on provincial subsidized housing programs that are governed by MMAH.
Source: FAO analysis of information provided by MMAH.
Accessible version
| Period | Year | Nominal ($ Millions) | Inflation-adjusted (2025-26 $ Millions) |
|---|---|---|---|
| Historical | 2004-05 | 1,307 | 2,069 |
| Historical | 2005-06 | 1,430 | 2,216 |
| Historical | 2006-07 | 1,555 | 2,369 |
| Historical | 2007-08 | 1,607 | 2,400 |
| Historical | 2008-09 | 1,538 | 2,258 |
| Historical | 2009-10 | 2,091 | 3,042 |
| Historical | 2010-11 | 2,159 | 3,062 |
| Historical | 2011-12 | 1,518 | 2,096 |
| Historical | 2012-13 | 1,611 | 2,196 |
| Historical | 2013-14 | 1,605 | 2,160 |
| Historical | 2014-15 | 1,602 | 2,112 |
| Historical | 2015-16 | 1,604 | 2,087 |
| Historical | 2016-17 | 2,087 | 2,667 |
| Historical | 2017-18 | 1,993 | 2,500 |
| Historical | 2018-19 | 1,685 | 2,069 |
| Historical | 2019-20 | 1,699 | 2,053 |
| Historical | 2020-21 | 1,609 | 1,918 |
| Historical | 2021-22 | 1,664 | 1,902 |
| Historical | 2022-23 | 1,727 | 1,863 |
| Historical | 2023-24 | 1,855 | 1,934 |
| Historical | 2024-25 | 2,002 | 2,041 |
| FAO Projection | 2025-26 | 2,021 | 2,021 |
| FAO Projection | 2026-27 | 2,137 | 2,094 |
| FAO Projection | 2027-28 | 2,190 | 2,104 |
On an inflation-adjusted basis (i.e., real 2025-26 dollars), spending on provincial subsidized housing programs decreased at an average annual rate of 0.1 per cent, from $2.1 billion in 2004-05 to $2.0 billion in 2024-25. Looking forward, the FAO estimates inflation-adjusted spending on provincial subsidized housing programs will increase at an average annual rate of 1.0 per cent, reaching $2.1 billion in 2027-28.
Throughout this period, there were a number of time-limited programs that caused temporary increases in spending, primarily in 2009-10, 2010-11, 2016-17 and 2017-18. These time-limited programs include the Social Housing Renovation and Retrofit Program (2009-10 to 2010-11), housing supports for low-income seniors and persons with disabilities under Canada’s Economic Action Plan (2009-10 to 2010-11), the Social Infrastructure Fund (2016-17), the Social Housing Improvement Program (2016-17), and the Social Housing Apartment Improvement Program (2017-18).
Spending by Level of Government
Each level of government has a role in funding and delivering the Province’s subsidized housing programs. The federal government provides funding to the Province through federal transfers based on bilateral agreements that prescribe the types of programs, delivery methods and targets. The Province, through MMAH, governs subsidized housing programs through provincial legislation and provides additional funding from provincial own-source revenues. Municipalities[12] deliver provincial programs using funding from the Province (including federal transfers) and municipal own-source revenues.
Nominal and Real Spending by Level of Government
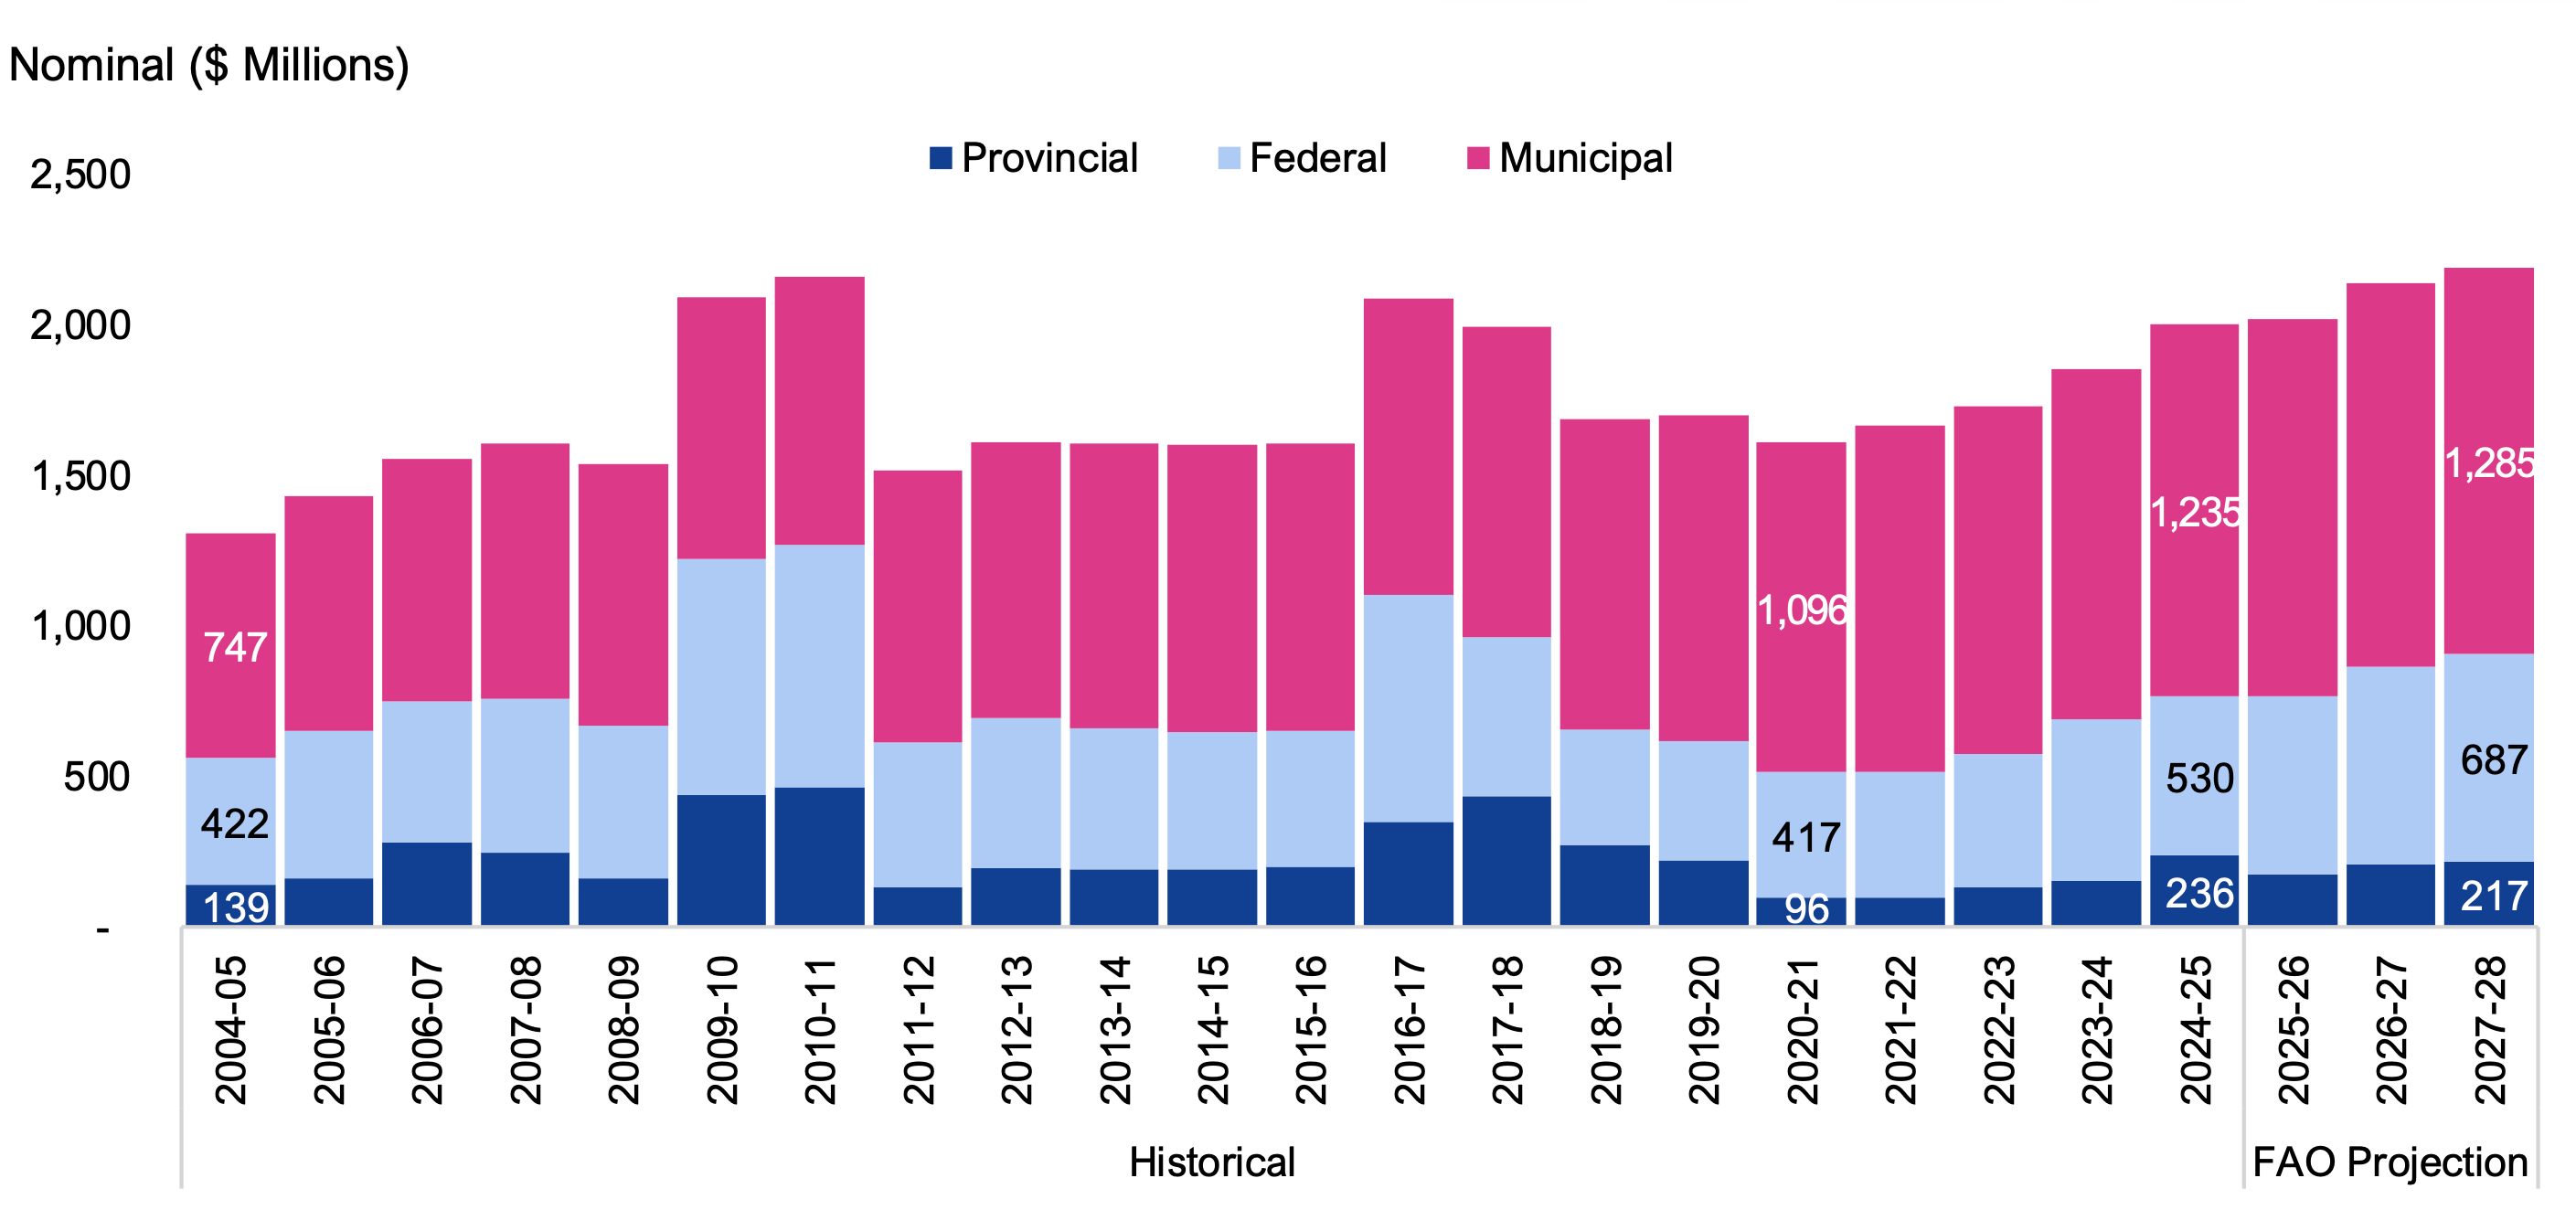
Overall, on a nominal dollar basis (i.e., not adjusted for inflation), municipal spending[13] is projected to increase at an average annual rate of 2.4 per cent from 2004-05 to 2027-28, federal spending is projected to increase at a 2.1 per cent average annual rate, and provincial spending is projected to grow by 2.0 per cent per year.
Figure 3.2 Historical and FAO projected provincial subsidized housing program spending by level of government, 2004-05 to 2027-28, nominal $ millions
Note: Between 2004-05 and 2022-23, municipal spending reflects MMAH’s reported municipal spending. For 2023-24 to 2027-28, municipal spending is an FAO estimate. Spending by the federal government is recorded by the Province as revenue and spending by MMAH in the Public Accounts of Ontario. Spending by municipalities is from own-sources and excludes funding provided by the federal or provincial governments.
Source: FAO analysis of information provided by MMAH.
Accessible version
| Period | Year | Provincial (Nominal $ Millions) | Federal (Nominal $ Millions) | Municipal (Nominal $ Millions) |
|---|---|---|---|---|
| Historical | 2004-05 | 139 | 422 | 747 |
| Historical | 2005-06 | 160 | 492 | 777 |
| Historical | 2006-07 | 283 | 467 | 806 |
| Historical | 2007-08 | 248 | 509 | 849 |
| Historical | 2008-09 | 160 | 507 | 871 |
| Historical | 2009-10 | 440 | 783 | 867 |
| Historical | 2010-11 | 465 | 804 | 890 |
| Historical | 2011-12 | 132 | 481 | 905 |
| Historical | 2012-13 | 194 | 498 | 918 |
| Historical | 2013-14 | 193 | 469 | 944 |
| Historical | 2014-15 | 191 | 458 | 953 |
| Historical | 2015-16 | 199 | 450 | 955 |
| Historical | 2016-17 | 348 | 755 | 983 |
| Historical | 2017-18 | 435 | 527 | 1,031 |
| Historical | 2018-19 | 271 | 386 | 1,029 |
| Historical | 2019-20 | 221 | 397 | 1,080 |
| Historical | 2020-21 | 96 | 417 | 1,096 |
| Historical | 2021-22 | 98 | 416 | 1,150 |
| Historical | 2022-23 | 131 | 446 | 1,151 |
| Historical | 2023-24 | 151 | 537 | 1,167 |
| Historical | 2024-25 | 236 | 530 | 1,235 |
| FAO Projection | 2025-26 | 176 | 589 | 1,256 |
| FAO Projection | 2026-27 | 209 | 655 | 1,272 |
| FAO Projection | 2027-28 | 217 | 687 | 1,285 |
In 2004-05, provincial subsidized housing program spending consisted of $747 million of municipal spending, $422 million of spending by the federal government and $139 million of provincial spending.[14] Between 2004-05 and 2020-21, municipal spending increased to $1.1 billion due to the rising cost of housing subsidies. This increase in municipal spending offset lower federal and provincial spending, which fell to $417 million and $96 million in 2020-21, respectively, due to the expiration of federal-provincial funding agreements. From 2020-21 to 2027-28, the FAO projects spending by all three levels of government will increase, with municipal spending reaching $1.3 billion and federal and provincial spending rising to $687 million and $217 million, respectively, due to investments under the National Housing Strategy (NHS).
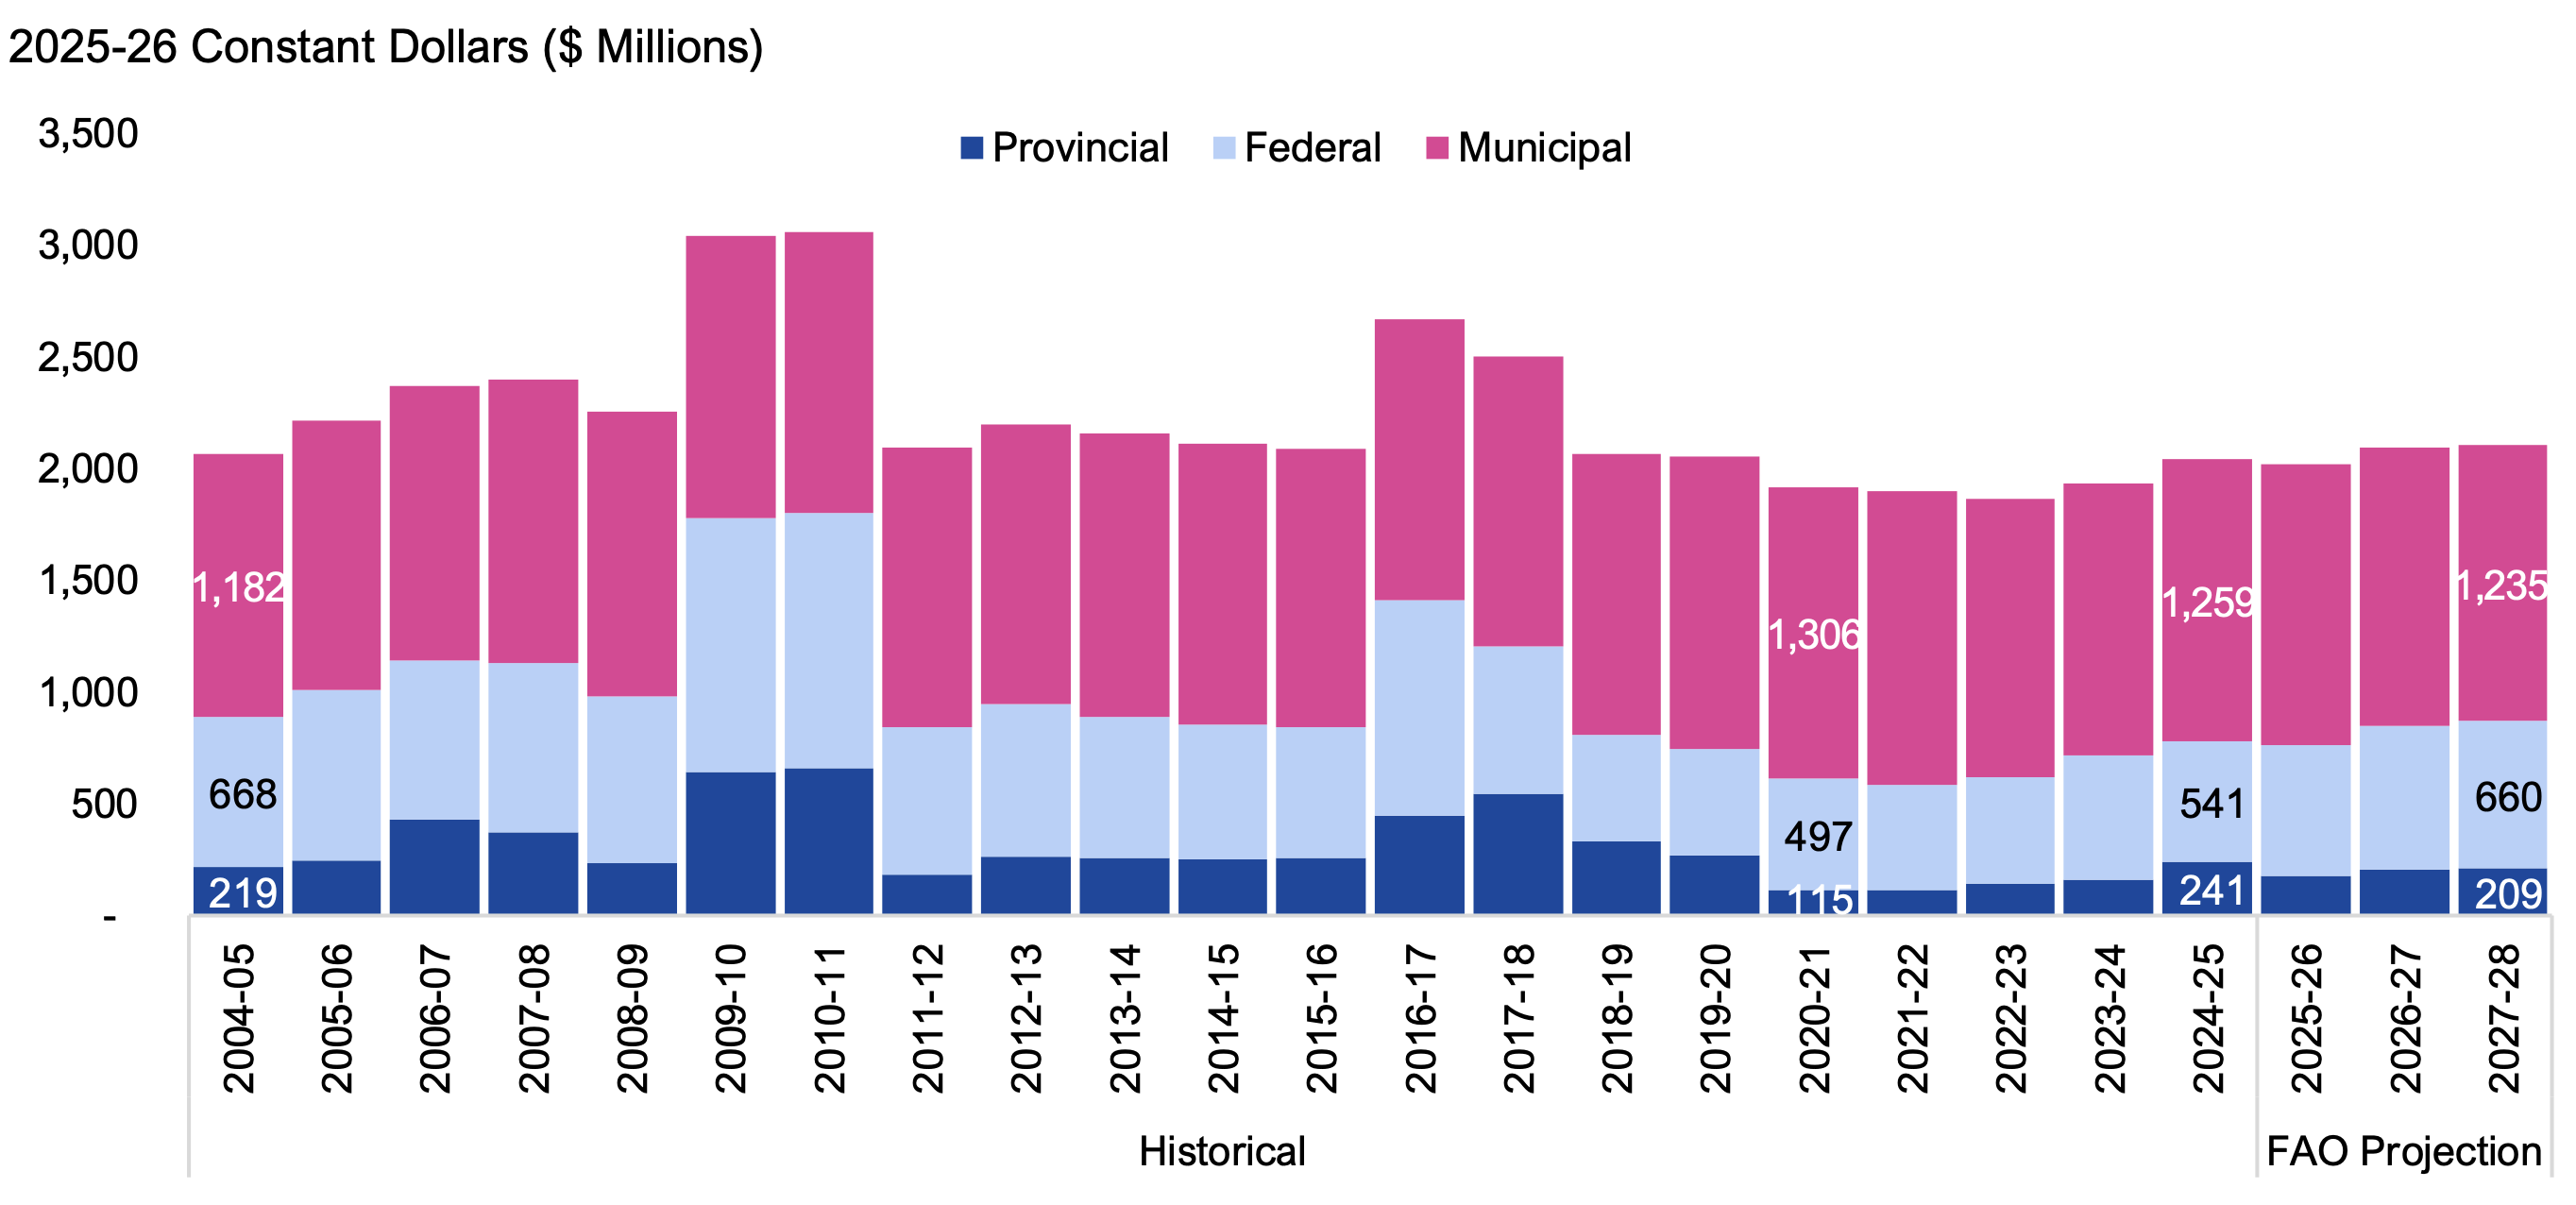
On an inflation-adjusted basis (i.e., real 2025-26 dollars), real municipal spending is projected to grow at an average annual rate of 0.2 per cent from 2004-05 to 2027-28, real federal spending is projected to decrease at an average annual rate of less than 0.1 per cent, and real provincial spending is expected to decrease at an average annual rate of 0.2 per cent.
Figure 3.3 Historical and FAO projected provincial subsidized housing program spending by level of government, 2004-05 to 2027-28, real (inflation-adjusted) $ millions
Note: Between 2004-05 and 2022-23, municipal spending reflects MMAH’s reported municipal spending. For 2023-24 to 2027-28, municipal spending is an FAO estimate. Spending by the federal government is recorded by the Province as revenue and spending by MMAH in the Public Accounts of Ontario. Spending by municipalities is from own-sources and excludes funding provided by the federal or provincial governments.
Source: FAO analysis of information provided by MMAH.
Accessible version
| Period | Year | Provincial (Constant 2025-26 $ Millions) | Federal (Constant 2025-26 $ Millions) | Municipal (Constant 2025-26 $ Millions) |
|---|---|---|---|---|
| Historical | 2004-05 | 219 | 668 | 1,182 |
| Historical | 2005-06 | 249 | 763 | 1,204 |
| Historical | 2006-07 | 430 | 711 | 1,228 |
| Historical | 2007-08 | 371 | 761 | 1,268 |
| Historical | 2008-09 | 235 | 744 | 1,279 |
| Historical | 2009-10 | 640 | 1,140 | 1,262 |
| Historical | 2010-11 | 660 | 1,140 | 1,262 |
| Historical | 2011-12 | 182 | 664 | 1,250 |
| Historical | 2012-13 | 265 | 679 | 1,251 |
| Historical | 2013-14 | 259 | 631 | 1,269 |
| Historical | 2014-15 | 252 | 604 | 1,256 |
| Historical | 2015-16 | 259 | 586 | 1,242 |
| Historical | 2016-17 | 445 | 965 | 1,257 |
| Historical | 2017-18 | 545 | 661 | 1,293 |
| Historical | 2018-19 | 332 | 474 | 1,263 |
| Historical | 2019-20 | 267 | 480 | 1,306 |
| Historical | 2020-21 | 115 | 497 | 1,306 |
| Historical | 2021-22 | 112 | 476 | 1,315 |
| Historical | 2022-23 | 141 | 481 | 1,241 |
| Historical | 2023-24 | 158 | 560 | 1,216 |
| Historical | 2024-25 | 241 | 541 | 1,259 |
| FAO Projection | 2025-26 | 176 | 589 | 1,256 |
| FAO Projection | 2026-27 | 205 | 642 | 1,247 |
| FAO Projection | 2027-28 | 209 | 660 | 1,235 |
In 2004-05, after adjusting for inflation, municipalities spent $1.18 billion on provincial subsidized housing programs, the federal government spent $668 million, and the Province spent $219 million. By 2020-21, real municipal spending increased to $1.31 billion while the expiry of federal-provincial funding resulted in real federal spending declining to $497 million and real provincial spending declining to $115 million. Beyond 2020-21, the FAO projects real municipal spending to decline while investments under the NHS will increase real federal and provincial spending. By 2027-28, the FAO estimates real spending by municipalities will decrease to $1.23 billion, while real federal spending will increase to $660 million and real provincial spending will increase to $209 million.
Share of Spending by Level of Government
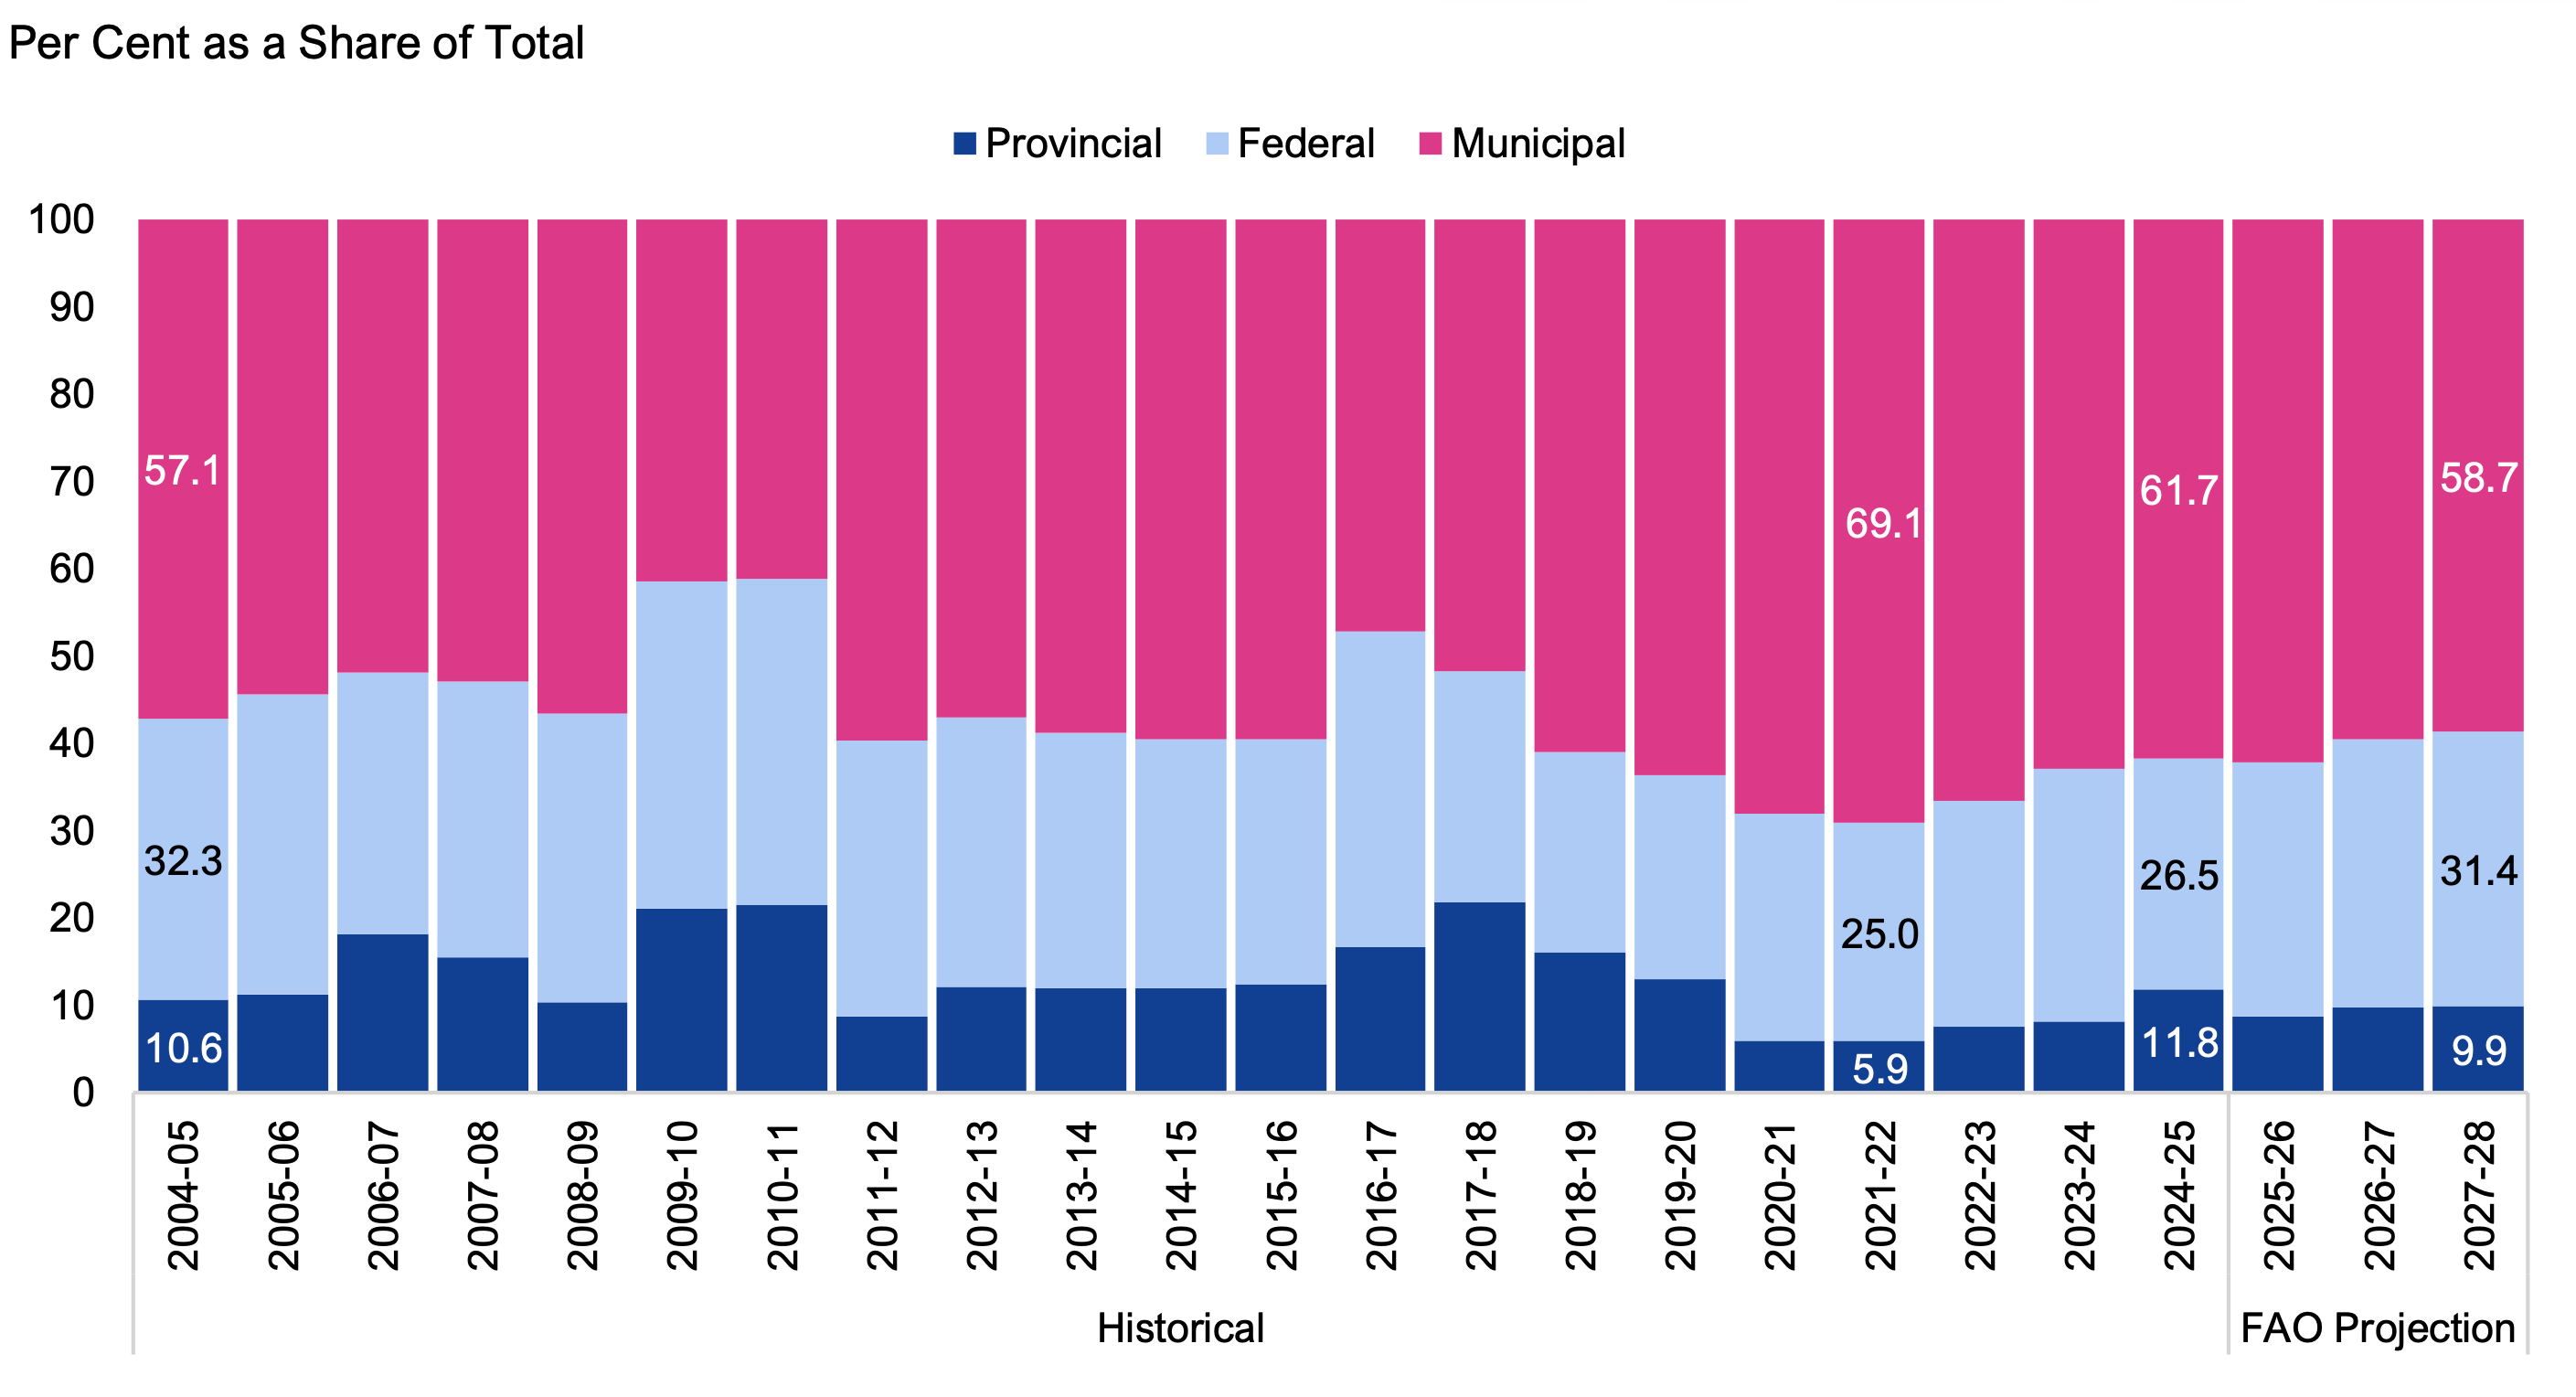
Overall, from 2004-05 to 2024-25, municipalities contributed an average of 56.8 per cent of total provincial subsidized housing program spending, the federal government contributed 29.9 per cent and the Province contributed 13.3 per cent.
Figure 3.4 Share of historical and FAO projected provincial subsidized housing program spending by level of government, 2004-05 to 2027-28
Note: Between 2004-05 and 2022-23, municipal spending reflects MMAH’s reported municipal spending. For 2023-24 to 2027-28, municipal spending is an FAO estimate. Spending by the federal government is recorded by the Province as revenue and spending by MMAH in the Public Accounts of Ontario. Spending by municipalities is from own-sources and excludes funding provided by the federal or provincial governments.
Source: FAO analysis of information provided by MMAH.
Accessible version
| Period | Year | Provincial (Per Cent as a Share of Total) | Federal (Per Cent as a Share of Total) | Municipal (Per Cent as a Share of Total) |
|---|---|---|---|---|
| Historical | 2004-05 | 10.6 | 32.3 | 57.1 |
| Historical | 2005-06 | 11.2 | 34.4 | 54.3 |
| Historical | 2006-07 | 18.2 | 30.0 | 51.8 |
| Historical | 2007-08 | 15.5 | 31.7 | 52.8 |
| Historical | 2008-09 | 10.4 | 33.0 | 56.6 |
| Historical | 2009-10 | 21.0 | 37.5 | 41.5 |
| Historical | 2010-11 | 21.5 | 37.2 | 41.2 |
| Historical | 2011-12 | 8.7 | 31.7 | 59.6 |
| Historical | 2012-13 | 12.1 | 30.9 | 57.0 |
| Historical | 2013-14 | 12.0 | 29.2 | 58.8 |
| Historical | 2014-15 | 11.9 | 28.6 | 59.5 |
| Historical | 2015-16 | 12.4 | 28.1 | 59.5 |
| Historical | 2016-17 | 16.7 | 36.2 | 47.1 |
| Historical | 2017-18 | 21.8 | 26.4 | 51.7 |
| Historical | 2018-19 | 16.1 | 22.9 | 61.0 |
| Historical | 2019-20 | 13.0 | 23.4 | 63.6 |
| Historical | 2020-21 | 6.0 | 25.9 | 68.1 |
| Historical | 2021-22 | 5.9 | 25.0 | 69.1 |
| Historical | 2022-23 | 7.6 | 25.8 | 66.6 |
| Historical | 2023-24 | 8.2 | 29.0 | 62.9 |
| Historical | 2024-25 | 11.8 | 26.5 | 61.7 |
| FAO Projection | 2025-26 | 8.7 | 29.1 | 62.2 |
| FAO Projection | 2026-27 | 9.8 | 30.7 | 59.5 |
| FAO Projection | 2027-28 | 9.9 | 31.4 | 58.7 |
In general, between 2004-05 and 2021-22, the share of provincial subsidized housing program spending funded by municipalities increased, while the share funded by federal and provincial governments decreased. In 2004-05, municipalities funded 57.1 per cent of subsidized housing spending, increasing to 69.1 per cent in 2021-22. Conversely, the share of spending funded by the federal and provincial governments declined from 32.3 per cent and 10.6 per cent, respectively, in 2004-05, to 25.0 per cent and 5.9 per cent in 2021-22. These decreases were due to a combination of increased municipal spending to absorb the rising cost of housing subsidies and the gradual expiration of federal-provincial funding commitments.
However, in recent years the trend has, with the share of spending funded by federal and provincial governments increasing due to new spending under the NHS. By 2024-25, the federal share increased by 1.5 percentage points to 26.5 per cent and the provincial share doubled to 11.8 per cent, while the municipal share fell by 7.4 percentage points to 61.7 per cent.
Beyond 2024-25, the FAO projects that the combined federal-provincial share of housing spending will continue to rise as NHS spending increases. In 2027-28, the FAO estimates 31.4 per cent of spending will be funded by the federal government and 9.9 per cent will be funded by the Province, with the municipal share falling to 58.7 per cent.
Spending by Program
In this report, the FAO categorizes provincial subsidized housing program spending as legacy program spending and National Housing Strategy (NHS) program spending. Legacy programs primarily consist of the Social Housing Agreement (SHA) and Affordable Housing Program (AHP), while National Housing Strategy (NHS) programs were introduced in 2019-20 to replace expiring federal-provincial funding under legacy programs. In addition to replacing SHA and AHP funding, the NHS expanded funding for subsidized housing programs and represented a significant shift in the structure of the Province’s subsidized housing programs. Accordingly, the following sections focus on subsidized housing programs since 2019-20 to assess recent developments.
Since the introduction of the NHS, total provincial subsidized housing program spending by all levels of government increased from $1.7 billion in 2019-20 to $2.0 billion in 2024-25, an average annual increase of 3.3 per cent. By program, spending on legacy housing programs declined from $1.5 billion in 2019-20 to $1.4 billion in 2024-25, representing an average annual decline of 1.7 per cent. At the same time, NHS spending increased at an average annual rate of 30.1 per cent, from $156 million in 2019-20 to $583 million in 2024-25.
By 2027-28, the FAO projects total spending on provincial subsidized housing programs by all levels of government will reach $2.2 billion, an average annual increase of 3.1 per cent from 2024-25. This includes spending on legacy programs growing at an average annual rate of 0.6 per cent, from $1.42 billion in 2024-25 to $1.44 billion in 2027-28, while NHS program spending is projected to increase at an average annual rate of 8.7 per cent, growing from $583 million in 2024-25 to $749 million in 2027-28.
Figure 3.5 Historical and FAO projected provincial subsidized housing program spending by program type, 2019-20 to 2027-28, nominal $ millions
Note: Spending figures include combined spending by the Province, federal government and municipalities on provincial subsidized housing programs.
Source: FAO analysis of information provided by MMAH.
Accessible version
| Period | Year | Legacy Programs (Nominal $ Millions) | NHS (Nominal $ Millions) | Total (Nominal $ Millions) |
|---|---|---|---|---|
| Historical | 2019-20 | 1,542 | 156 | 1,699 |
| Historical | 2020-21 | 1,420 | 188 | 1,609 |
| Historical | 2021-22 | 1,404 | 260 | 1,664 |
| Historical | 2022-23 | 1,380 | 348 | 1,727 |
| Historical | 2023-24 | 1,383 | 472 | 1,855 |
| Historical | 2024-25 | 1,418 | 583 | 2,002 |
| FAO Projection | 2025-26 | 1,413 | 608 | 2,021 |
| FAO Projection | 2026-27 | 1,428 | 708 | 2,137 |
| FAO Projection | 2027-28 | 1,442 | 749 | 2,190 |
Legacy Programs
Legacy subsidized housing programs were established under earlier federal and provincial policy frameworks to develop and support Ontario’s subsidized housing stock. Legacy subsidized housing programs include:
- The Social Housing Agreement (SHA): Much of Ontario’s existing subsidized housing stock was developed between the 1940s and the early 1990s through federal and provincial programs. These housing units, where renters typically pay rent-geared-to-income (RGI), are often referred to as social housing.[15] In 1999, the SHA between the Government of Canada and the Province shifted federal responsibility for most social housing in Ontario to the Province, replacing the previous cost-sharing model with a scheduled funding arrangement set to expire by 2033. Ontario subsequently transferred the administration and funding responsibilities for social housing to municipalities, first through the Social Housing Reform Act, 2000 and later the Housing Services Act, 2011.
- The Affordable Housing Program (AHP): The AHP is a federal-provincial bilateral agreement signed in 2002 that aimed at increasing the supply of affordable housing in Ontario. The program focused on three key areas: building new below-market rent units,[16] providing rent supplements to help tenants afford market rents, and providing homeownership assistance such as forgivable loans to help pay for the down payment and closing costs of a home purchase. The below-market rent units are scheduled to expire by 2031-32.
- The Rural and Urban Indigenous Housing Program (RUIHP): This program was launched in 2020 as the successor to the Rural and Native Housing program and has since been extended to 2027-28. The program primarily provides RGI housing units to off-reserve Indigenous and non-Indigenous households in urban and rural areas of Ontario.
- Other Legacy Programs: These programs include the Investment in Affordable Housing Extension (IAH-E) program, which concluded in 2019-20; the Survivors of Domestic Violence Portable Housing Benefit, which was integrated into the Canada-Ontario Housing Benefit under the NHS beginning in 2020-21; and the Rural and Native Housing program, which was replaced by the RUIHP in 2020-21.
Figure 3.6 Historical and FAO projected legacy program spending, 2019-20 to 2027-28, nominal $ millions
Note: Spending figures include combined spending by the Province, federal government and municipalities on legacy programs.
Source: FAO analysis of information provided by MMAH.
Accessible version
| Period | Year | Social Housing Agreement (Nominal $ Millions) | Affordable Housing Program (Nominal $ Millions) | Rural and Urban Indigenous Housing Program (Nominal $ Millions) | Other Legacy Programs (Nominal $ Millions) | Total Legacy (Nominal $ Millions) |
|---|---|---|---|---|---|---|
| Historical | 2019-20 | 1,432 | 15 | 0 | 96 | 1,542 |
| Historical | 2020-21 | 1,397 | 15 | 8 | 0 | 1,420 |
| Historical | 2021-22 | 1,381 | 15 | 8 | 0 | 1,404 |
| Historical | 2022-23 | 1,357 | 15 | 8 | 0 | 1,380 |
| Historical | 2023-24 | 1,361 | 14 | 8 | 0 | 1,383 |
| Historical | 2024-25 | 1,395 | 15 | 8 | 0 | 1,418 |
| FAO Projection | 2025-26 | 1,385 | 18 | 10 | 0 | 1,413 |
| FAO Projection | 2026-27 | 1,400 | 18 | 10 | 0 | 1,428 |
| FAO Projection | 2027-28 | 1,414 | 18 | 10 | 0 | 1,442 |
Legacy housing programs spending decreased from $1.5 billion in 2019-20 to $1.4 billion in 2024-25. The decline over this period was largely driven by the expiration of federal transfers under the SHA and the conclusion of the IAH-E program. Between 2024-25 and 2027-28, the FAO projects legacy housing programs spending will remain at $1.4 billion.
By level of government, the FAO projects federal spending on legacy programs will decline from $279 million in 2019-20 to $128 million in 2027-28, due to the expiration of federal transfers under the SHA. Provincial contributions are projected to decline from $182 million in 2019-20 to $28 million in 2027-28, largely due to the expiry of the IAH-E in 2019-20. Conversely, municipal spending, which comprises the majority of legacy program spending, is projected to increase from $1.1 billion in 2019-20 to $1.3 billion in 2027-28, largely due to projected increases in the cost of housing subsidies under legacy programs.
National Housing Strategy Programs
The NHS is a 10-year federal-provincial agreement introduced in 2019 and scheduled to conclude in 2028. The NHS aims to preserve and expand subsidized housing support through three cost-shared programs:
- The Canada-Ontario Community Housing Initiative (COCHI) provides funding to preserve and repair RGI and below-market rent housing units whose federal funding under the legacy Social Housing Agreement(SHA) is scheduled to expire during the NHS agreement period. COCHI also aims to expand the number of rent-assisted housing units in the province, including RGI, below-market rent and rent supplement units.
- The Ontario Priorities Housing Initiative (OPHI) provides funding for the creation and repair of below-market rent units, homeownership assistance such as forgivable loans to help pay for the down payment and closing costs of a home purchase, housing-related supports,[17] and rent supplements. OPHI is a successor to previous legacy subsidized housing programs such as the AHP.
- The Canada-Ontario Housing Benefit (COHB) provides a portable rent supplement to low-income households, including several target groups such as survivors of gender-based violence and people experiencing homelessness or at risk of homelessness. COHB provides a subsidy equal to the difference between the greater of 80 per cent of average market rent or a household’s actual shelter costs (up to 100 per cent of the average market rent) and 30 per cent of a household’s adjusted net income. Whereas COCHI and OPHI largely replace legacy programs, COHB represents an expansion of subsidized housing supports and has contributed to the overall increase in provincial subsidized housing program spending since 2020-21.
Figure 3.7 Historical and FAO projected National Housing Strategy program spending, 2019-20 to 2027-28, nominal $ millions
Note: Spending figures include combined spending by the Province and federal government on NHS programs.
Source: FAO analysis of information provided by MMAH.
Accessible version
| Period | Year | Canada-Ontario Community Housing Initiative (Nominal $ Millions) | Ontario Priorities Housing Initiative (Nominal $ Millions) | Canada-Ontario Housing Benefit (Nominal $ Millions) | Total NHS (Nominal $ Millions) |
|---|---|---|---|---|---|
| Historical | 2019-20 | 33 | 123 | 0 | 156 |
| Historical | 2020-21 | 81 | 64 | 43 | 188 |
| Historical | 2021-22 | 112 | 100 | 48 | 260 |
| Historical | 2022-23 | 161 | 91 | 95 | 348 |
| Historical | 2023-24 | 184 | 90 | 198 | 472 |
| Historical | 2024-25 | 252 | 83 | 248 | 583 |
| FAO Projection | 2025-26 | 275 | 81 | 253 | 608 |
| FAO Projection | 2026-27 | 334 | 61 | 314 | 708 |
| FAO Projection | 2027-28 | 366 | 22 | 360 | 749 |
Spending under the NHS increased from $156 million in 2019-20 to $583 million in 2024-25. Over this period, COCHI spending increased from $33 million in 2019-20 to $252 million in 2024-25, reflecting both the transition of social housing support from the SHA to COCHI and the expansion of rent-assisted units funded through COCHI. Additionally, spending for rent supplements under COHB began at $43 million in 2020-21 and increased to $248 million by 2024-25, as more households received support and the average level of support increased. OPHI funding declined from $123 million in 2019-20 to $83 million in 2024-25, as transitional rent supplements funded by OPHI in 2019-20 were shifted to COHB rent supplements starting in 2020-21.
Based on the Province’s current NHS Action Plan,[18] the FAO projects NHS program spending will increase to $749 million by 2027-28, the final year of the agreement. This increase is driven mainly by higher planned spending for COHB and COCHI, partially offset by lower planned spending for OPHI. As of the writing of this report, neither the federal nor provincial government has provided information on an extension of the NHS agreement beyond 2027-28.
By level of government, the FAO projects federal spending under the NHS will increase from $118 million in 2019-20 to $559 million in 2027-28, primarily due to increased federal COCHI and COHB funding. The FAO estimates provincial spending will increase from $39 million in 2019-20 to $189 million in 2027-28, largely due to the Province’s requirement to cost-match federal COHB funding. The NHS does not include a municipal spending component; however, the Province uses municipal spending under legacy programs to satisfy its cost-matching requirement for federal COCHI funding.[19]
Homelessness Programs
In addition to legacy and NHS programs, the Province also provides subsidized housing through provincial homelessness programs, includingthe Homelessness Prevention Program (HPP) and Indigenous Supportive Housing Program (ISHP). These programs provide affordable housing and support services to people at risk of or experiencing homelessness, including below-market rentals and rent supplements, as well as community outreach and support services, emergency shelters, and other types of housing assistance.
Spending on subsidized housing through provincial homelessness programs is not included in the spending figures in this chapter.[20] However, households supported by the RGI assistance, below-market rental and rent supplement components of these programs are included in the discussion on households supported in Chapters 4 and 5.
4. Households Supported by Subsidized Housing Programs
This chapter analyzes the number of households supported by provincial subsidized housing programs. The chapter first presents the historical and FAO projected number of households supported by the legacy, NHS and homelessness programs outlined in Chapter 3. It then breaks down the number of households supported by the different types of support that provincial subsidized housing programs provide.
In 2019-20, provincial subsidized housing programs supported 303,639 households, which increased to an estimated 315,908 households in 2024-25.[21] This represents an average annual growth of 0.8 per cent over the period. In 2025-26, the number of households supported declined to an estimated 307,343, reflecting a projected decrease in the number of rent supplements and below-market rent units, as discussed below. Going forward, the FAO projects the number of households supported will reach 314,822 in 2027-28, the final year of the NHS agreement.
Figure 4.1 Historical and FAO projected households supported by provincial subsidized housing programs, 2019-20 to 2027-28
Note: Excludes repairs for RGI and below-market rent housing units and housing-related support services, such as counselling and job placements, as these services do not directly subsidize household shelter costs.
Source: FAO analysis of information provided by MMAH.
Accessible version
| Period | Year | Households |
|---|---|---|
| Historical | 2019-20 | 303,639 |
| Historical | 2020-21 | 308,107 |
| Historical | 2021-22 | 304,577 |
| Historical | 2022-23 | 305,726 |
| Historical | 2023-24 | 313,023 |
| Historical | 2024-25 | 315,908 |
| FAO Projection | 2025-26 | 307,343 |
| FAO Projection | 2026-27 | 313,046 |
| FAO Projection | 2027-28 | 314,822 |
Households Supported by Program
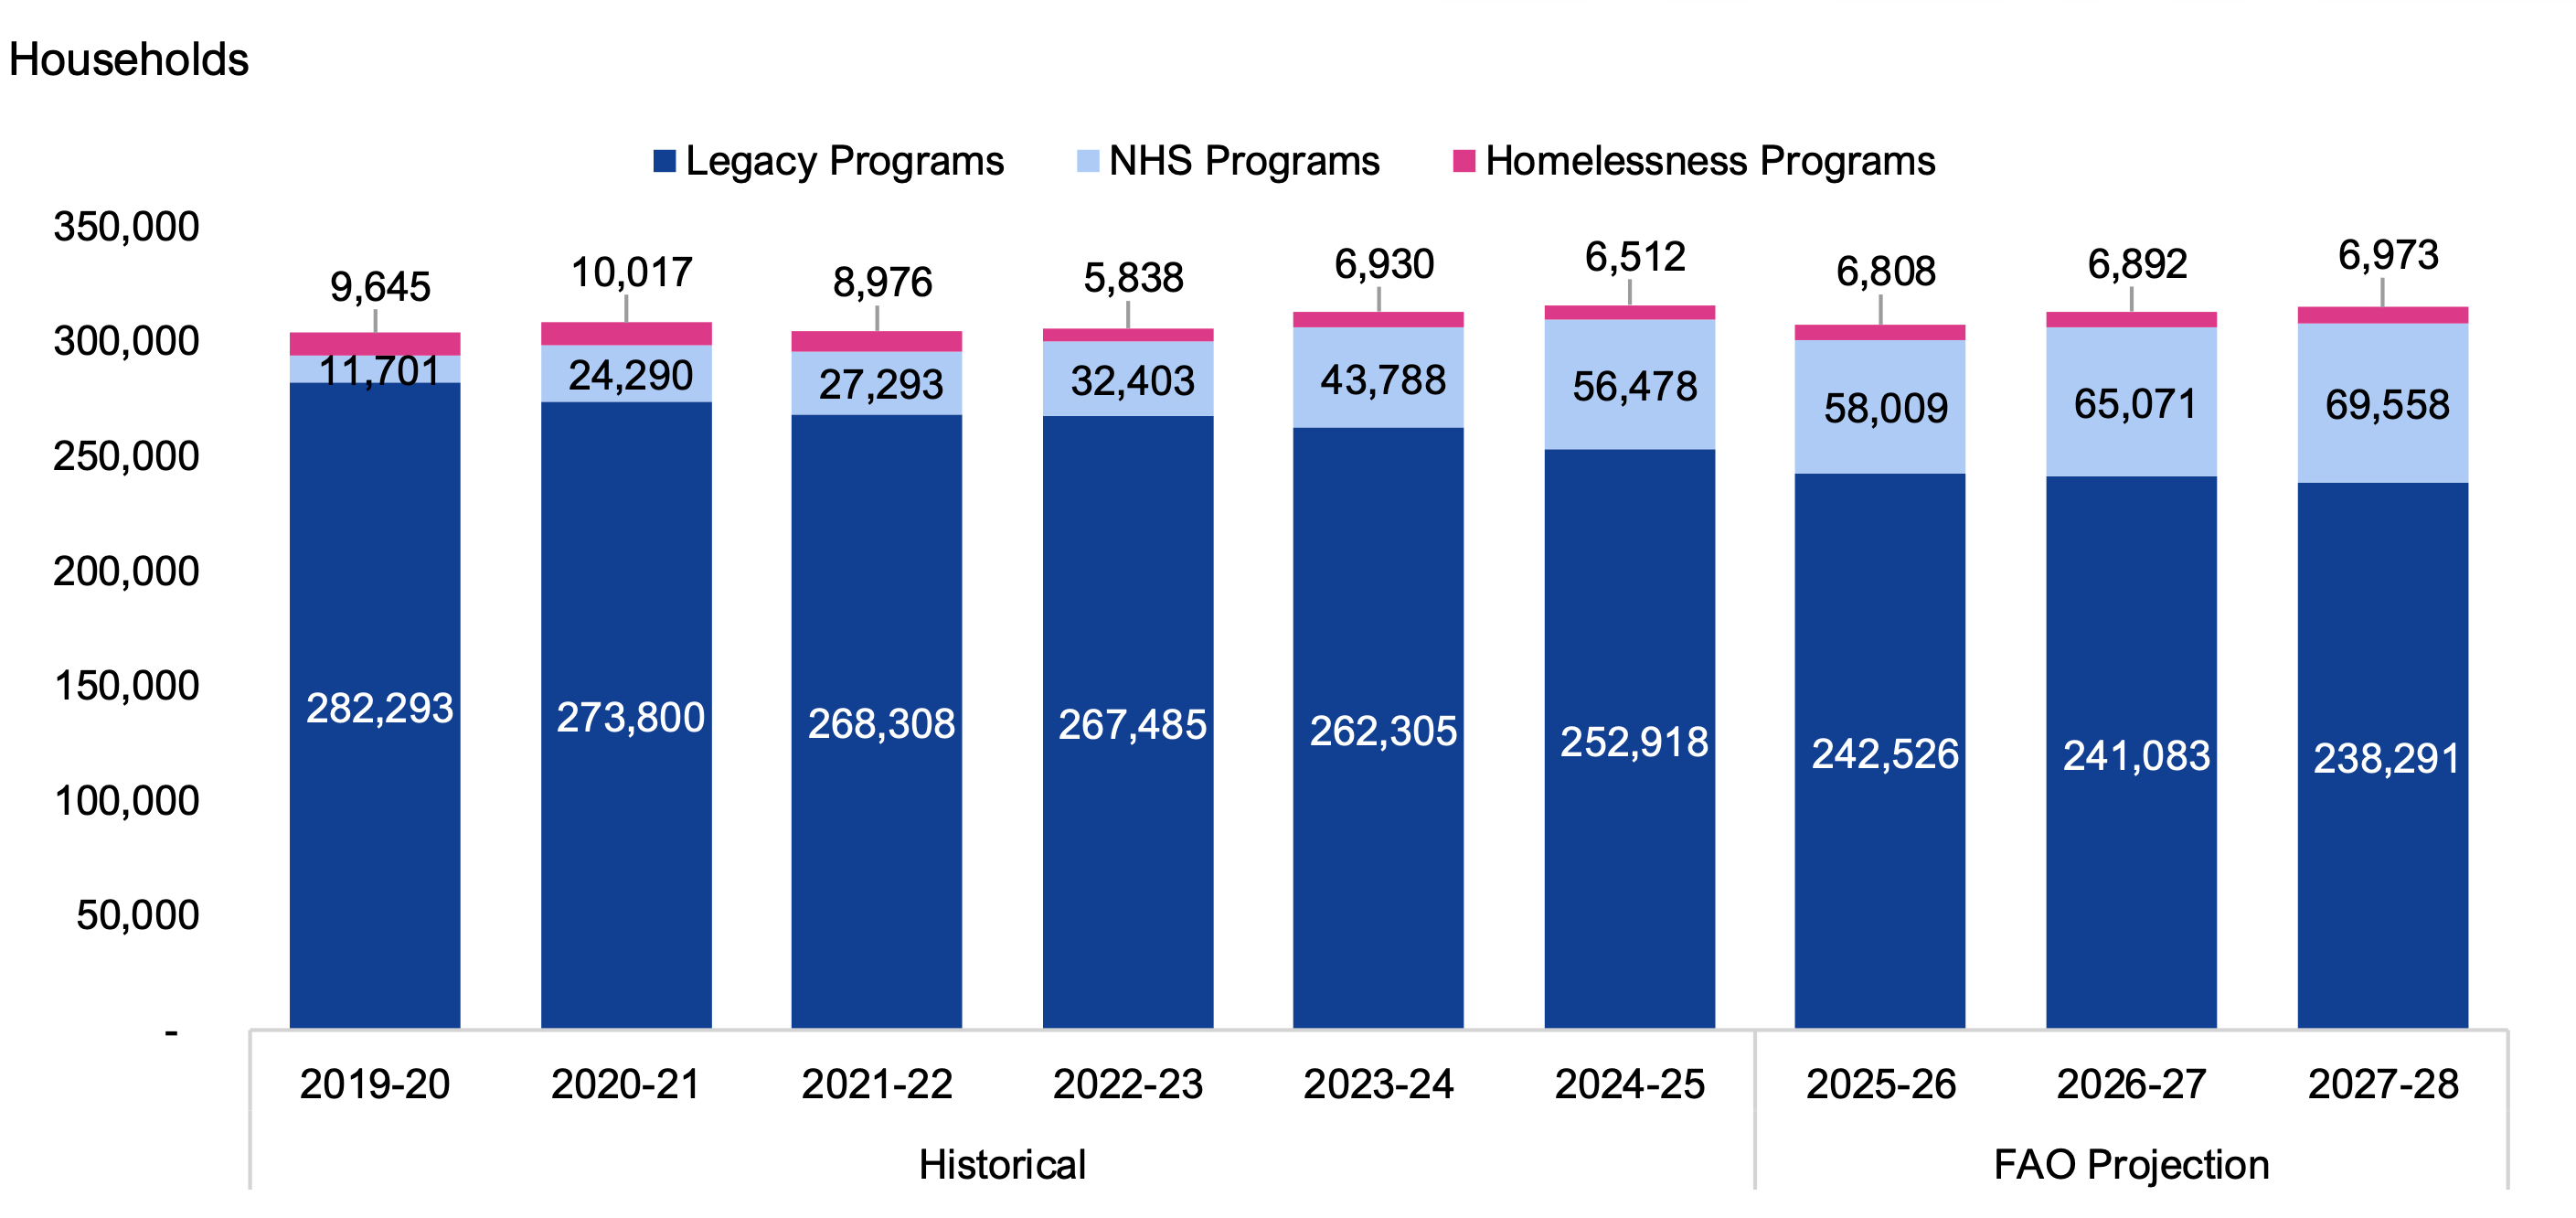
The overall increase in households supported between 2019-20 and 2024-25 reflects an increase in support under NHS programs, partially offset by lower support under legacy programs and homelessness programs. In 2019-20, the first year of the NHS, 282,293 households (93.0 per cent of total households supported) received support under legacy housing programs, 11,701 (3.9 per cent) were supported by NHS programs, and 9,645 (3.2 per cent) were supported by homelessness programs. By 2024-25, the number of households supported under legacy housing programs declined to 252,918 households (80.1 per cent of total households supported) and households supported by homelessness programs declined to 6,512 households (2.1 per cent), while households supported by NHS programs rose to 56,478 households (17.9 per cent).
By 2027-28, the final year of the NHS agreement, the FAO estimates that the number of households supported by legacy programs will decline further to 238,291 households (75.7 per cent of total households supported), while households supported by NHS programs will increase to 69,558 households (22.1 per cent) and households supported by homelessness programs will increase to 6,973 households (2.2 per cent).
Figure 4.2 Households supported by provincial subsidized housing programs by program type, 2019-20 to 2027-28
Note: Excludes repairs for RGI and below-market rent housing units and housing-related support services, such as counselling and job placements, as these services do not directly subsidize household shelter costs.
Source: FAO analysis of information provided by MMAH.
Accessible version
| Period | Year | Legacy Programs (Households) | NHS Programs (Households) | Homelessness Programs (Households) |
|---|---|---|---|---|
| Historical | 2019-20 | 282,293 | 11,701 | 9,645 |
| Historical | 2020-21 | 273,800 | 24,290 | 10,017 |
| Historical | 2021-22 | 268,308 | 27,293 | 8,976 |
| Historical | 2022-23 | 267,485 | 32,403 | 5,838 |
| Historical | 2023-24 | 262,305 | 43,788 | 6,930 |
| Historical | 2024-25 | 252,918 | 56,478 | 6,512 |
| FAO Projection | 2025-26 | 242,526 | 58,009 | 6,808 |
| FAO Projection | 2026-27 | 241,083 | 65,071 | 6,892 |
| FAO Projection | 2027-28 | 238,291 | 69,558 | 6,973 |
Households Supported by Type of Support
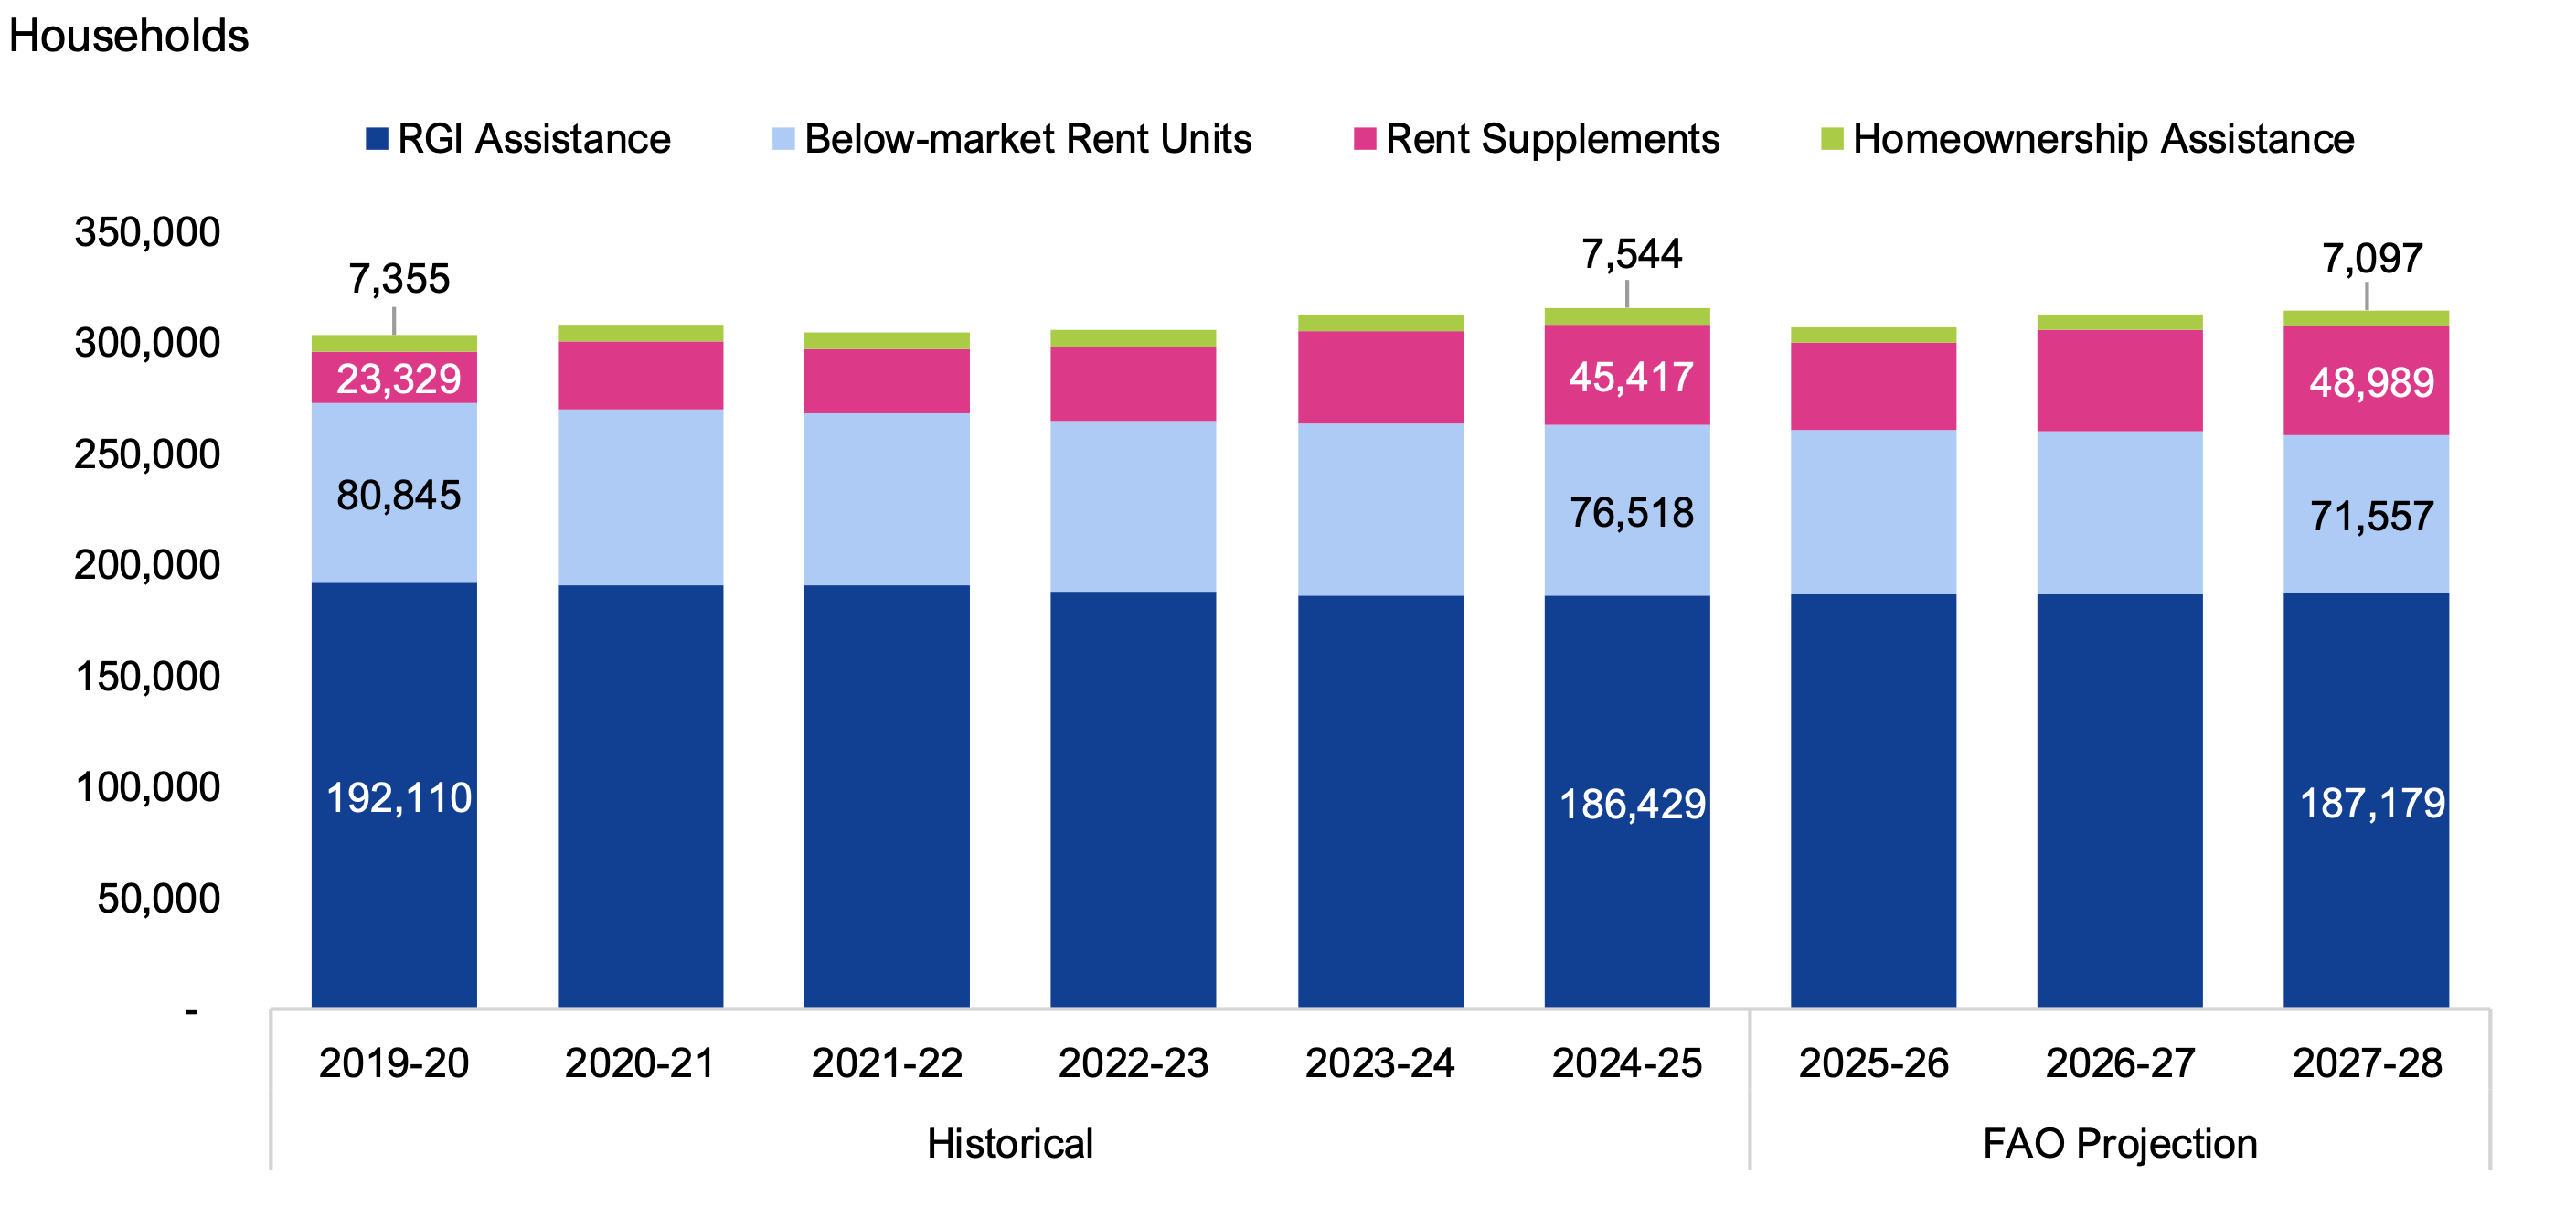
Provincial subsidized housing programs provide four overall types of support: rent-geared-to-income (RGI) assistance, below-market rent units, rent supplements and homeownership assistance.
There were 186,429 households that received RGI assistance[22] in 2024-25, representing 59.0 per cent of all households supported by provincial subsidized housing programs. The number of households that received RGI assistance declined from 192,110 in 2019-20, but the FAO projects an increase to 187,179 in 2027-28 as additional units are created through COCHI.
There were 76,518 households living in below-market rent housing units[23] in 2024-25, representing 24.2 per cent of all households supported by provincial subsidized housing programs. The number of below-market rent units declined from 80,845 in 2019-20. The FAO projects a further decline to 71,557 in 2027-28, as below-market rent units under legacy programs expire faster than projected increases in units created through NHS programs.
There were 45,417 households receiving rent supplements[24] in 2024-25, which comprised 14.4 per cent of all households supported by provincial subsidized housing programs. Households receiving rent supplements nearly doubled from 23,329 in 2019-20. The FAO projects that the number of households receiving rent supplements will increase to 48,989 in 2027-28 due to an increase in COHB and COCHI rent supplements.
There were 7,544 households receiving homeownership assistance in 2024-25, which accounted for 2.4 per cent of all households supported by provincial subsidized housing programs. Households receiving homeownership assistance increased from 7,355 in 2019-20. The FAO projects that the number of households receiving homeownership assistance will decrease to 7,097 in 2027-28 as existing homeownership support under legacy programs expires faster than the projected increase through OPHI.
Figure 4.3 Historical and FAO projected households supported by provincial subsidized housing programs by type of support, 2019-20 to 2027-28
Note: Excludes repairs for RGI and below-market rent housing units and housing-related support services, such as counselling and job placements, as these services do not directly subsidize household shelter costs.
Source: FAO analysis of information provided by MMAH.
Accessible version
| Period | Year | RGI Assistance (Households) | Below-market Rent Units (Households) | Rent Supplements (Households) | Homeownership Assistance (Households) |
|---|---|---|---|---|---|
| Historical | 2019-20 | 192,110 | 80,845 | 23,329 | 7,355 |
| Historical | 2020-21 | 191,112 | 79,170 | 30,380 | 7,445 |
| Historical | 2021-22 | 190,954 | 77,251 | 28,891 | 7,481 |
| Historical | 2022-23 | 187,978 | 76,644 | 33,598 | 7,506 |
| Historical | 2023-24 | 186,396 | 77,257 | 41,850 | 7,520 |
| Historical | 2024-25 | 186,429 | 76,518 | 45,417 | 7,544 |
| FAO Projection | 2025-26 | 186,796 | 74,238 | 38,970 | 7,339 |
| FAO Projection | 2026-27 | 187,008 | 73,501 | 45,195 | 7,342 |
| FAO Projection | 2027-28 | 187,179 | 71,557 | 48,989 | 7,097 |
5. Impact of Subsidized Housing Programs on Housing Need
This chapter analyzes the impact of provincial subsidized housing programs on total housing need in Ontario. The FAO defines a household as in need of subsidized housing if the household does not live in acceptable housing and cannot afford alternative acceptable housing,[25] without subsidized housing support. Housing is considered unacceptable if it is in need of major repairs, it has an insufficient number of bedrooms for the household’s size, or its cost exceeds 30 per cent of the household’s before-tax income.
Notably, the FAO’s definition for households in need of subsidized housing expands on the Canada Mortgage and Housing Corporation’s (CMHC’s) measure of “core housing need” as it includes households that already receive provincial subsidized housing support sufficient to make their housing affordable.[26]
Number of Households in Housing Need
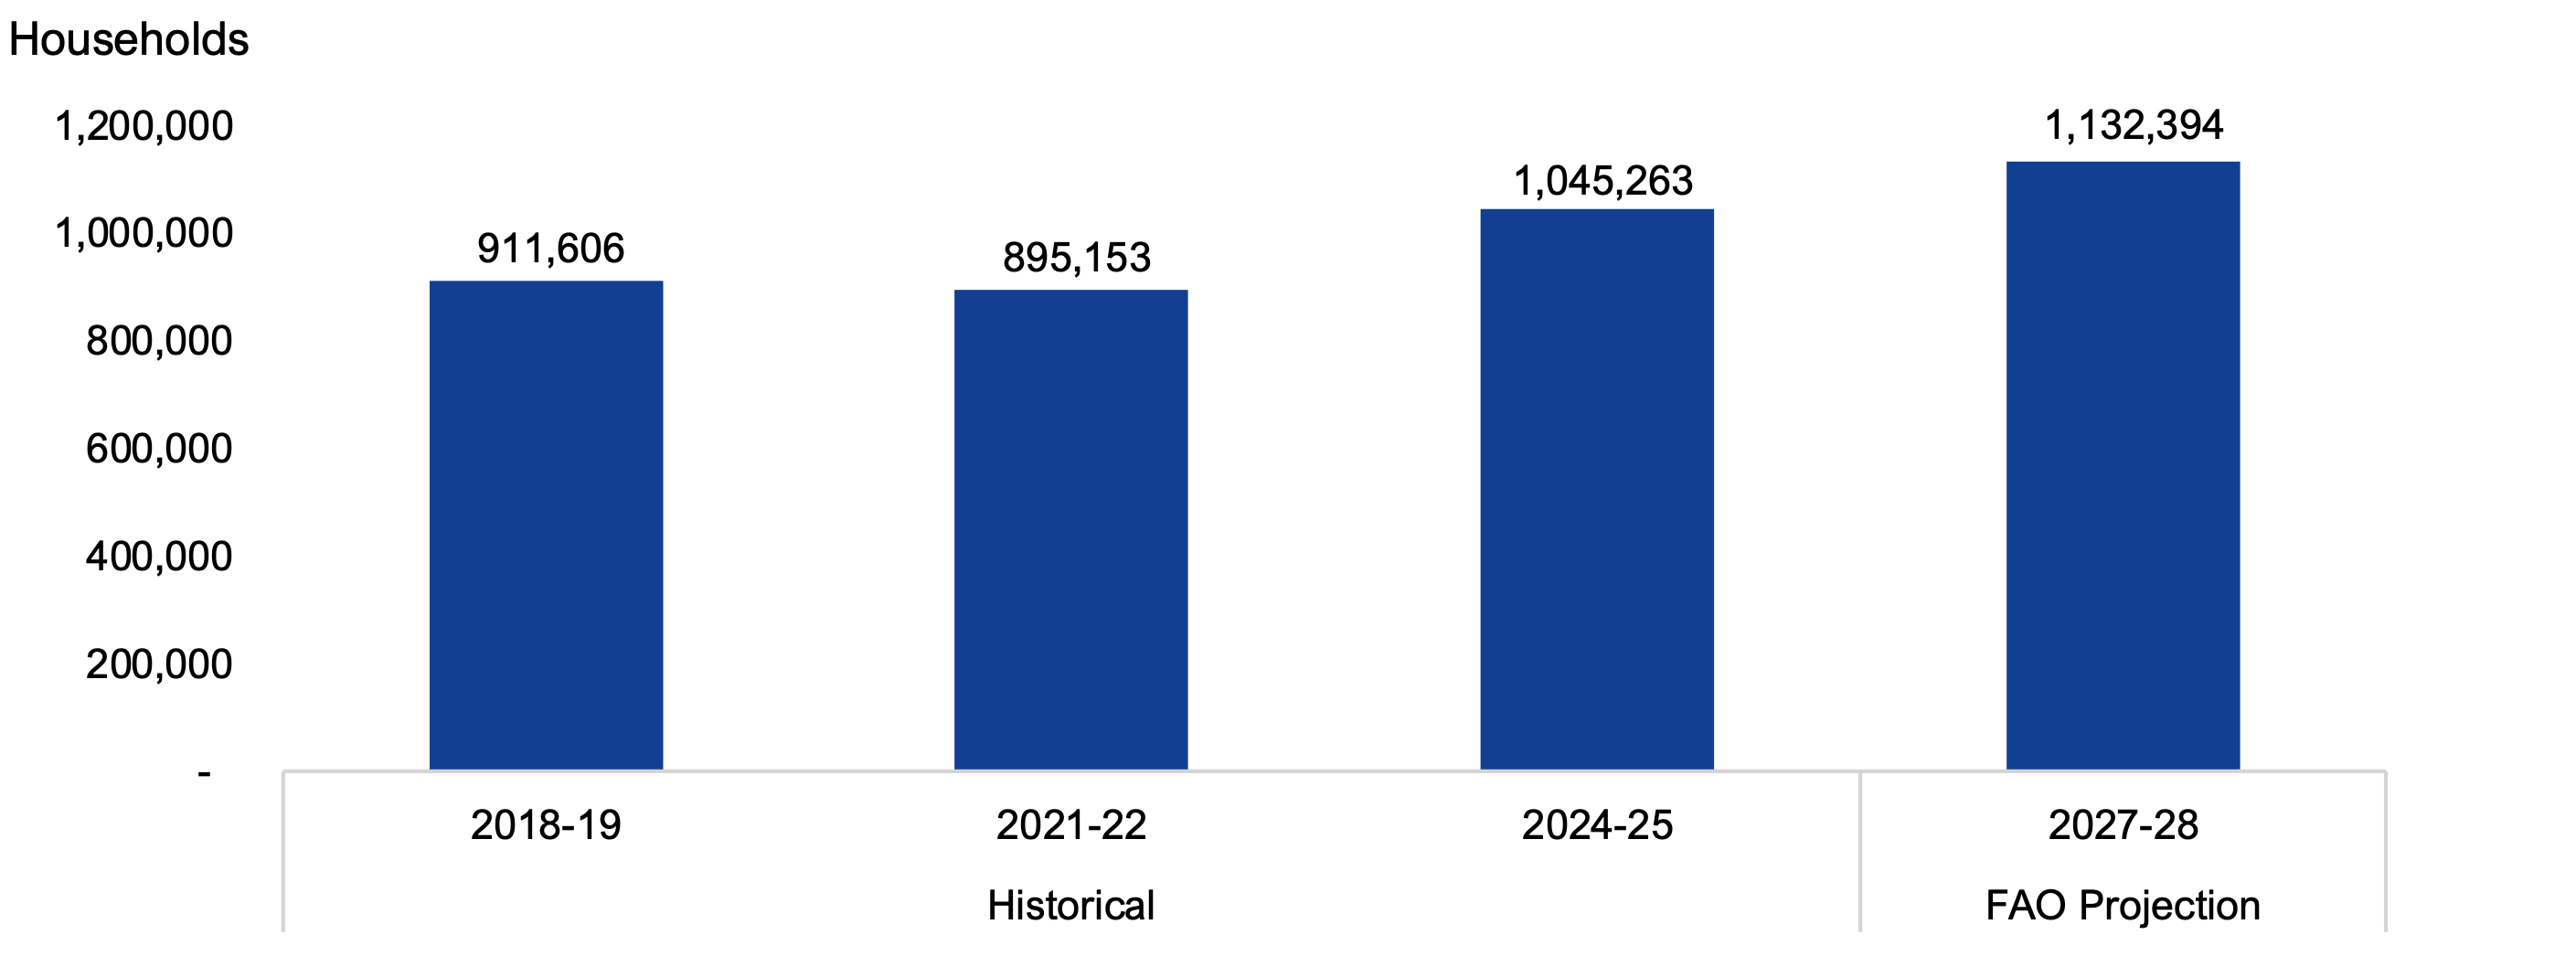
The FAO estimates that in 2018-19, there were 911,606 households in need of subsidized housing, representing 16.8 per cent of all Ontario households.[27] From 2018-19 to 2021-22, the number of households in need of subsidized housing decreased by 16,453 (-1.8 per cent), falling to an estimated 895,153 households (15.6 per cent of all Ontario households). This decrease was largely due to a temporary increase in average household income reflecting pandemic-related income supports from the federal government.
Figure 5.1 FAO estimated number of Ontario households in need of subsidized housing, 2018-19 to 2027-28
Note: Due to data limitations, 2018-19 reflects the 2018 calendar year.
Source: FAO analysis based on the 2021 Census, 2023 Canadian Income Survey, and information provided by MMAH.
Accessible version
| Period | Year | Households |
|---|---|---|
| Historical | 2018-19 | 911,606 |
| Historical | 2021-22 | 895,153 |
| Historical | 2024-25 | 1,045,263 |
| FAO Projection | 2027-28 | 1,132,394 |
From 2021-22 to 2024-25, the FAO estimates that the number of households in need of subsidized housing increased by 150,110 households (16.8 per cent), reaching 1,045,263 households (16.8 per cent of all Ontario households). This increase was driven primarily by a lapse of pandemic-related income supports and a deterioration in housing affordability. Over this period, high population growth and inflation, rising interest rates, and other economic factors placed upward pressure on the cost of shelter. Between 2021 and 2024, the median market rent in Ontario increased by an average annual rate of 5.9 per cent, and the average payment for new mortgage loans grew by an average annual rate of 12.9 per cent, both outpacing the 3.5 per cent average annual growth in household disposable incomes.[28]
Going forward, the number of households in need of subsidized housing is projected to increase by 87,131 households (8.3 per cent), to 1,132,394 households (17.6 per cent of all households in Ontario) in 2027-28. From 2024-25 to 2027-28, average rent and mortgage payments are expected to grow by 3.6 per cent[29] and 4.3 per cent per year, respectively, outpacing projected household income growth of 2.8 per cent per year.
Impact on Housing Need
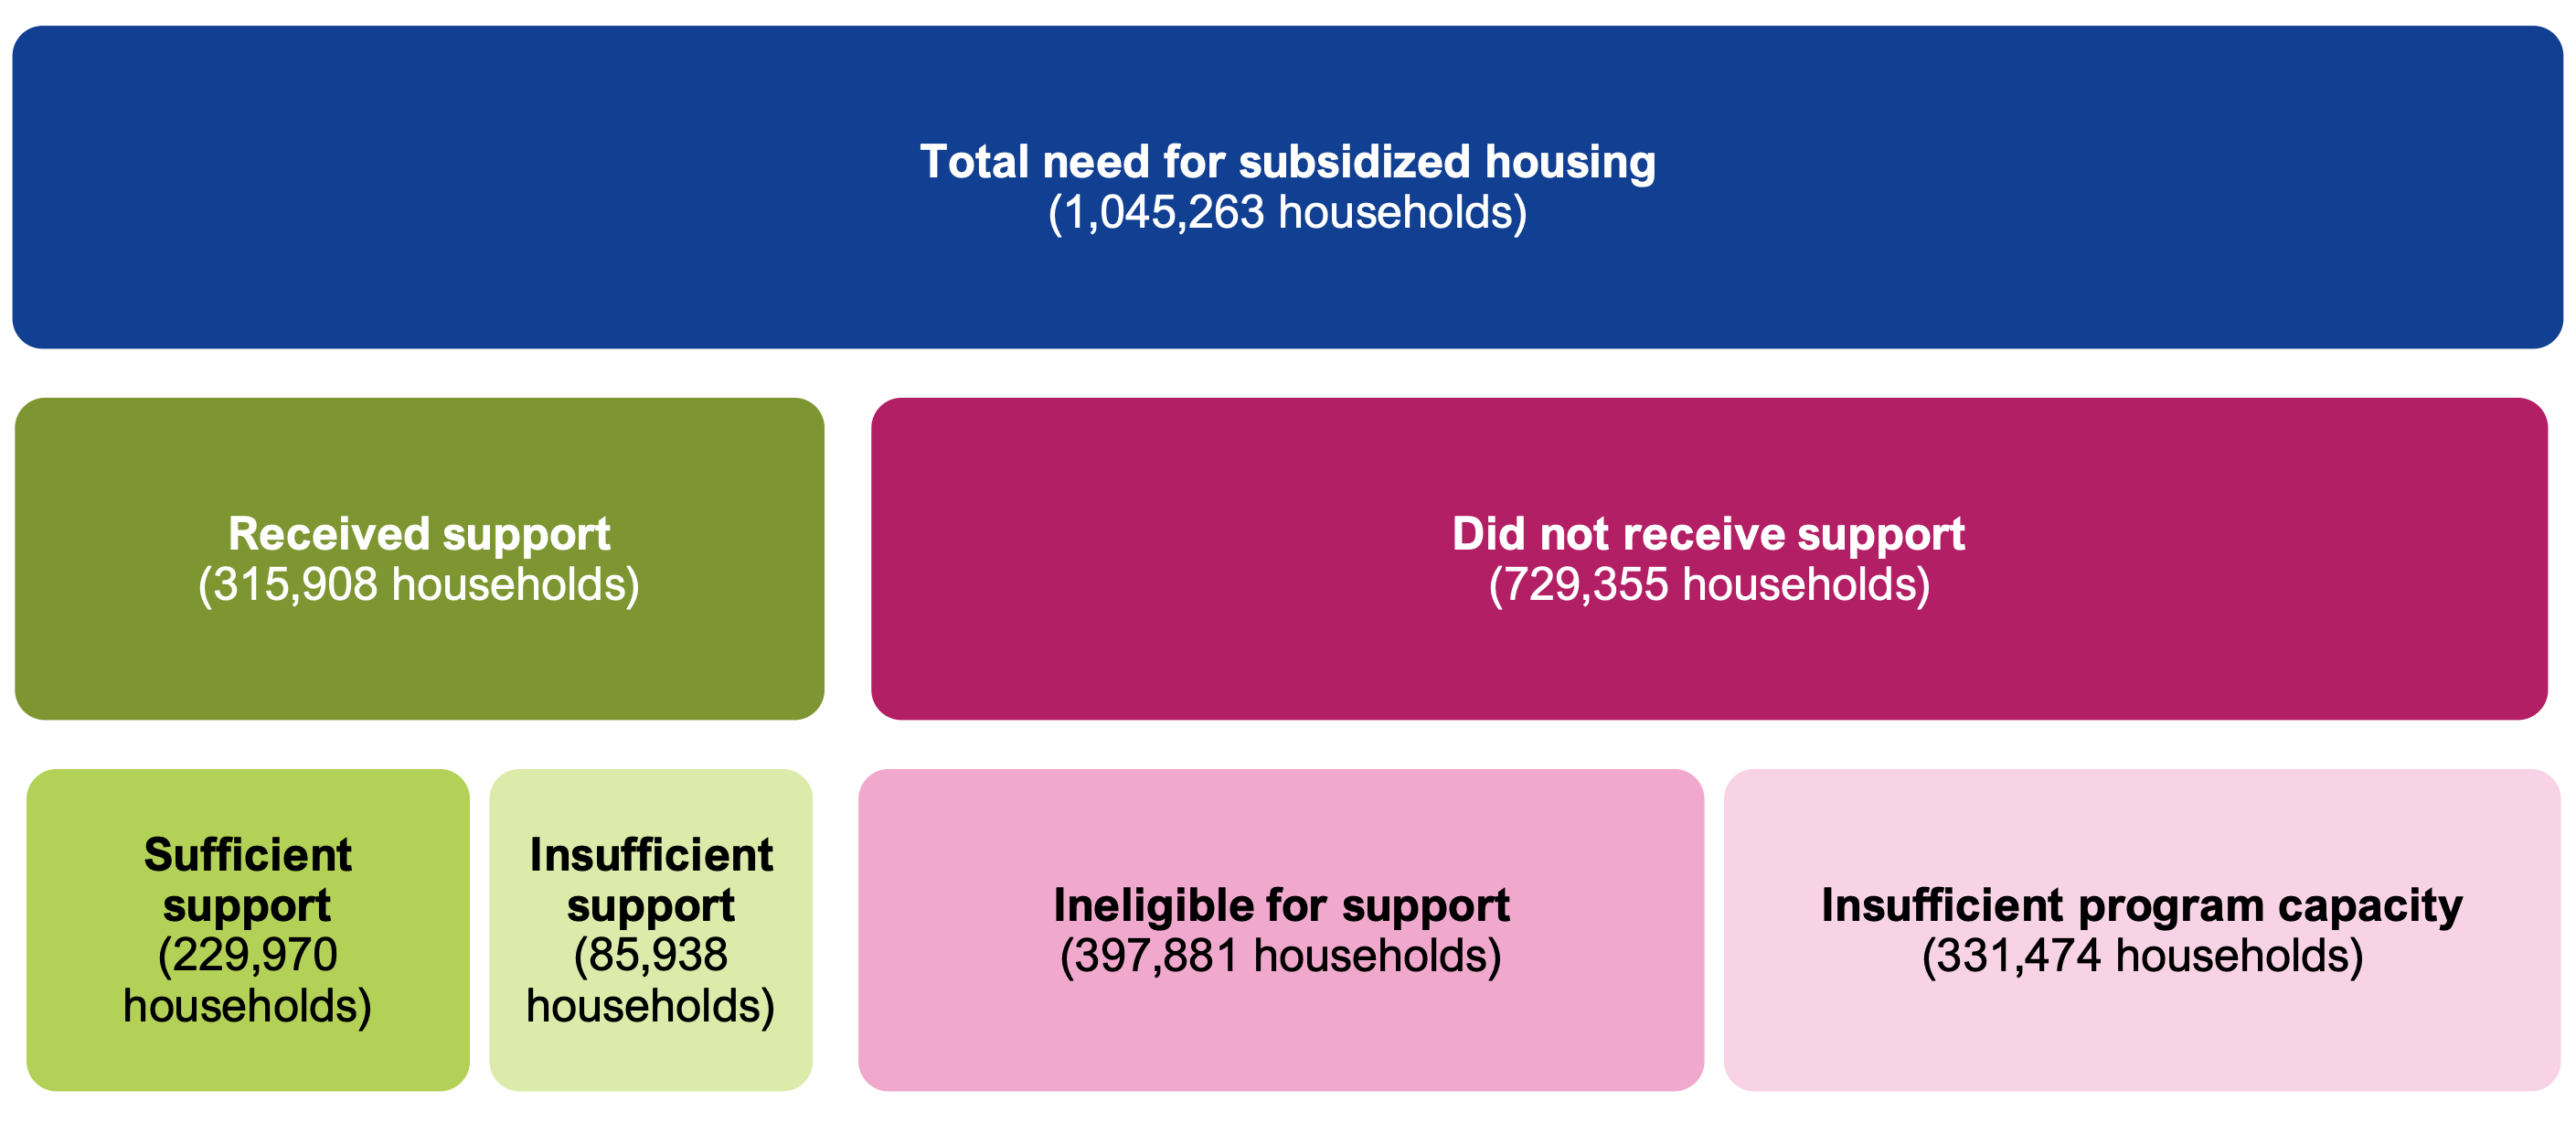
The FAO estimates that, of the 1,045,263 Ontario households in 2024-25 that were in need of subsidized housing, 315,908 (30.2 per cent of households in need) received provincial subsidized housing program support and 729,355 (69.8 per cent of households in need) did not receive support from provincial subsidized housing programs. Of those 315,908 households that received support in 2024-25:
- 229,970 households received sufficient support to make housing affordable by reducing their shelter costs to less than 30 per cent of household before-tax income. This primarily included households that received RGI assistance and households that received COHB rent supplements. Both programs are designed to limit shelter costs to 30 per cent of a household’s income, which eliminates the household’s housing affordability gap. In 2024-25, the FAO estimates that average annual support was $6,319 for RGI households and $10,578 for households that received COHB rent supplements. Additionally, some households in below-market rental housing received sufficient support to make housing affordable.
- 85,938 households received subsidized housing support but continued to face unaffordable housing costs (i.e., shelter costs that exceeded 30 per cent of household before-tax income). These households were primarily served through below-market rent programs, including OPHI and COCHI, where the level of support is linked to average market rents and not explicitly to a household’s income. In 2024-25, the estimated average support provided through OPHI below-market rent units was $4,599 per household, which was below the estimated average housing affordability gap ($4,956). As a result, the FAO estimates that the average level of support was insufficient to eliminate the housing affordability gap for approximately 80 per cent of households in below-market rent units. In addition, some households received homeownership assistance, which provides forgivable loans for down payments and closing costs. However, homeownership assistance does not guarantee that ongoing shelter costs will be affordable.
Of the 729,355 households in need of subsidized housing but not served by any provincial subsidized housing program, the FAO estimates that 397,881 households were ineligible for subsidized housing program support[30] while 331,474 households did not receive supports because of limited program capacity.
In total, the FAO estimates that in 2024-25, 815,293 households (13.1 per cent of all Ontario households) were in need of subsidized housing but either did not receive support (729,355 households) or received insufficient support to make their housing affordable (85,938 households).
Figure 5.2 Ontario households in need of subsidized housing in 2024-25
Source: FAO analysis based on the 2021 Census, 2023 Canadian Income Survey, and information provided by MMAH.
Accessible version
| Level | Category | Households |
|---|---|---|
| 0 | Total need for subsidized housing | 1,045,263 |
| 1 | Received support | 315,908 |
| 2 | Sufficient support | 229,970 |
| 2 | Insufficient support | 85,938 |
| 1 | Did not receive support | 729,355 |
| 2 | Ineligible for support | 397,881 |
| 2 | Insufficient program capacity | 331,474 |
Going forward, the FAO estimates that the total need for subsidized housing will grow from 1,045,263 households in 2024-25 to 1,132,394 households in 2027-28, an increase of 87,131 households (8.3 per cent). Over this period, the FAO projects that the number of households that receive sufficient support to make their housing affordable will increase from 229,970 households in 2024-25 to 238,380 households in 2027-28, an increase of 8,410 households (3.7 per cent), driven mainly by the expansion of COHB.
The FAO estimates that the number of Ontario households in need of subsidized housing that either did not receive support or received insufficient support to make their housing affordable will grow from 815,293 households in 2024-25 to 894,014 households in 2027-28, an increase of 78,721 households (9.7 per cent). In 2027-28, the FAO projects that 76,442 households will receive subsidized housing support but that the support will be insufficient to make their housing affordable, while 817,572 households in need of subsidized housing will not receive support. Of the 817,572 households that are in need of subsidized housing but do not receive support, the FAO estimates that 436,353 households will be ineligible for subsidized housing program support while 381,219 households will not receive support because of limited program capacity.
Figure 5.3 FAO estimated number of Ontario households in need of subsidized housing, by sufficiency of support, 2024-25 to 2027-28
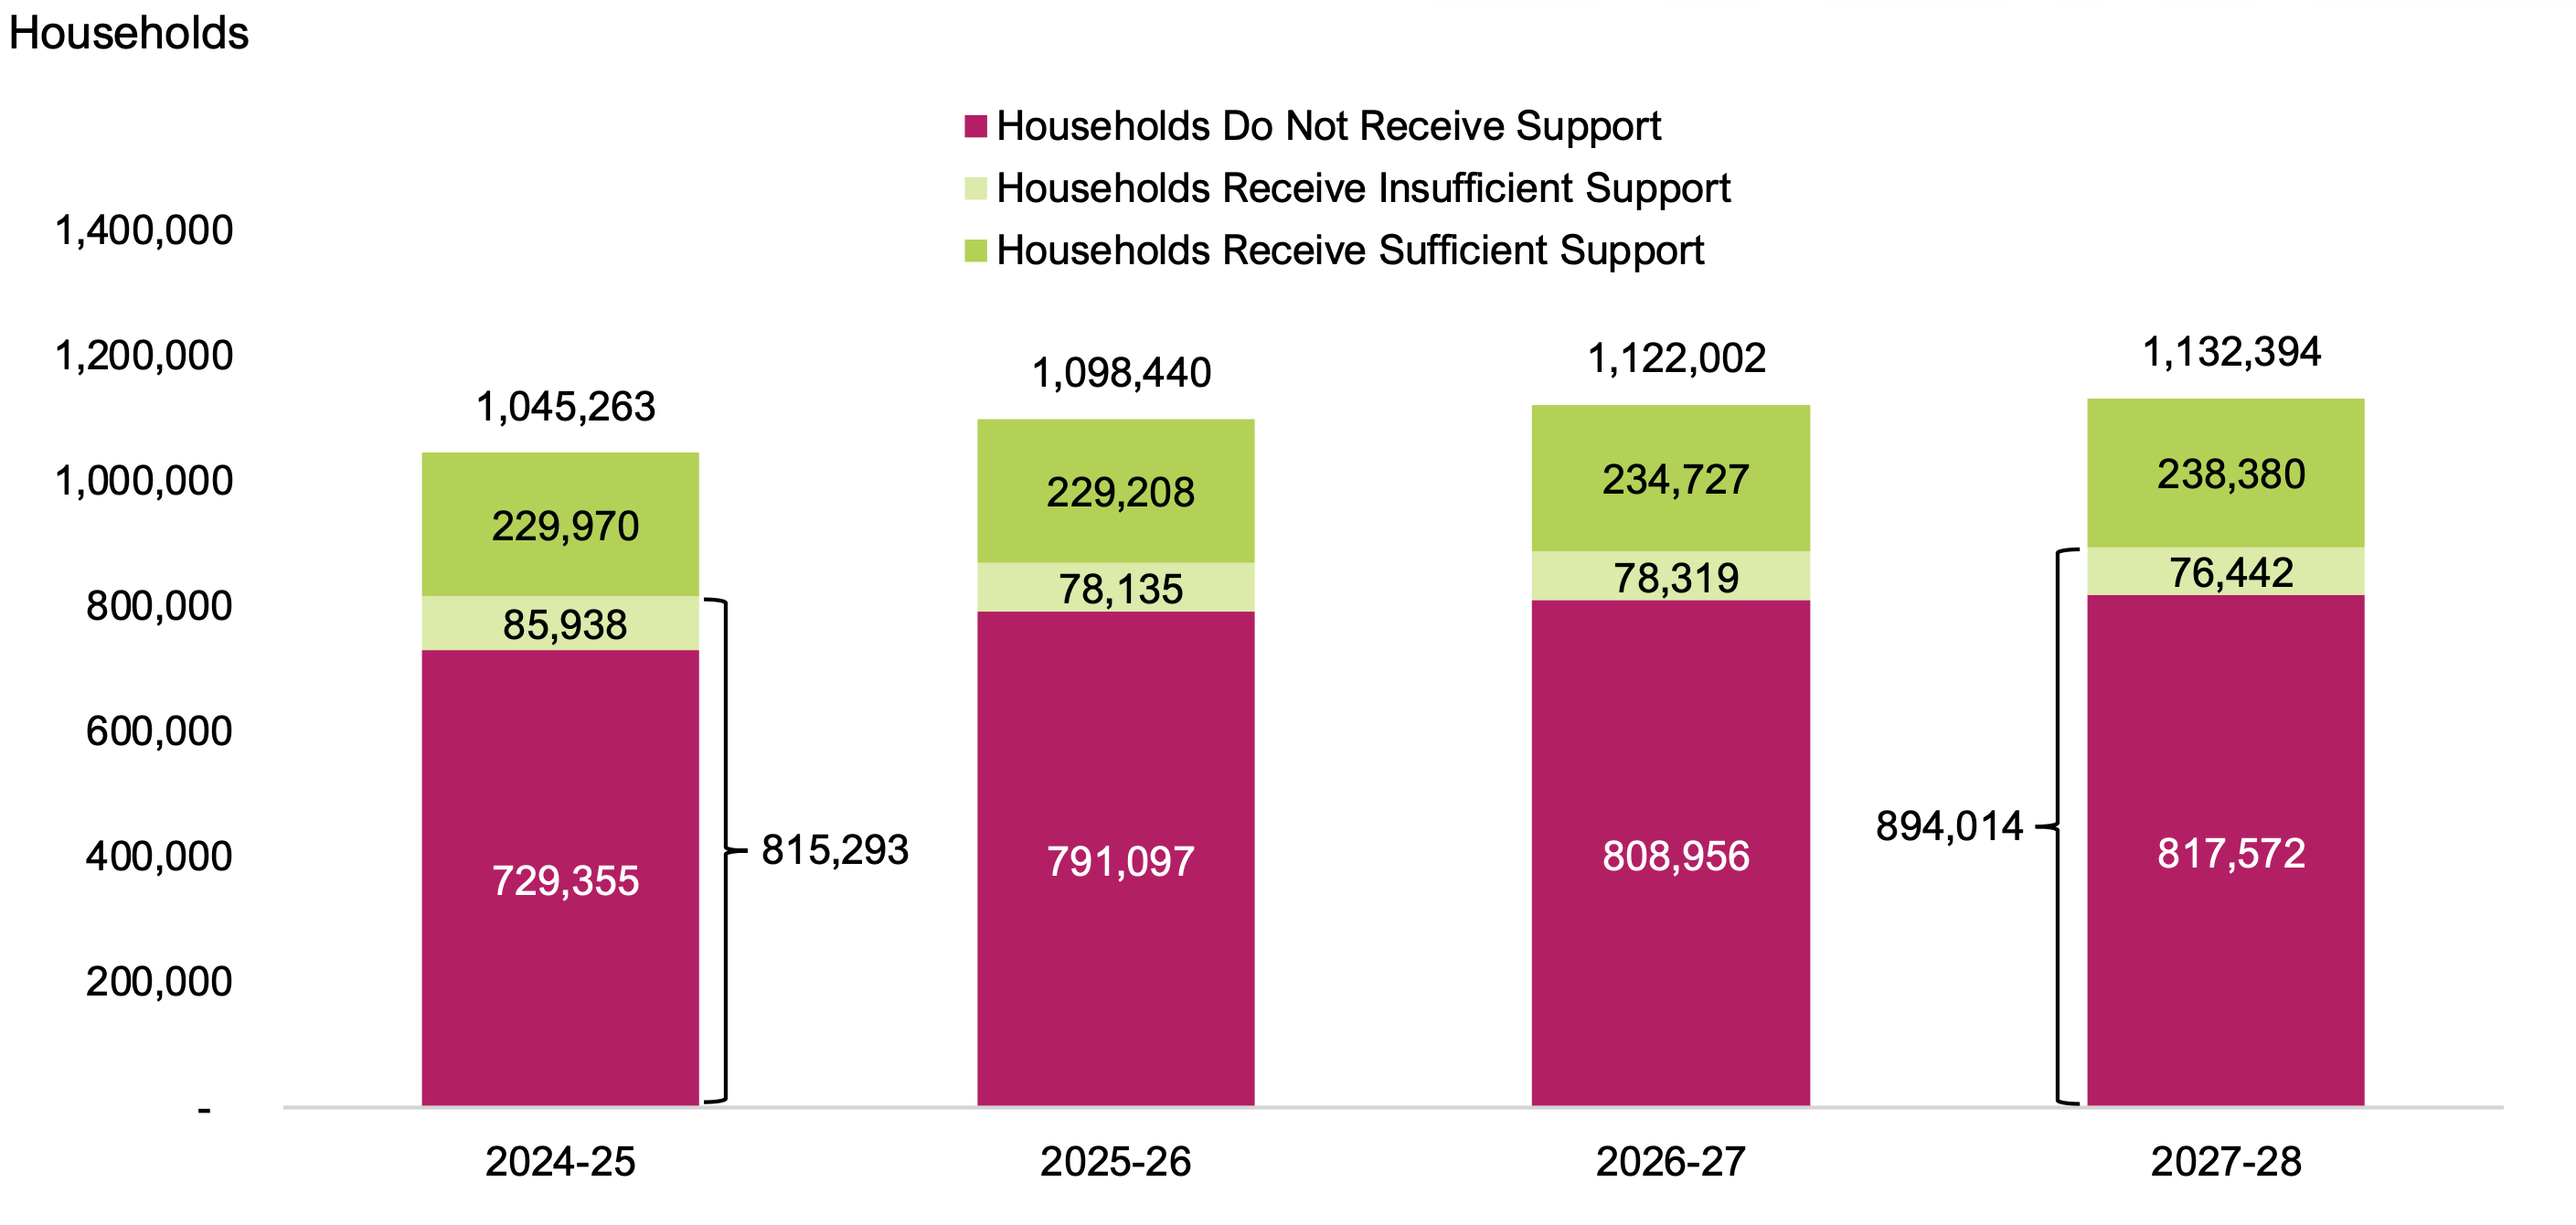
Note: The FAO defines a household as in need of subsidized housing if the household does not live in acceptable housing and cannot afford alternative acceptable housing, without subsidized housing support. Housing is considered unacceptable if it is in need of major repairs, it has an insufficient number of bedrooms for the household’s size, or its cost exceeds 30 per cent of the household’s before-tax income. “Households receive sufficient support” are households that receive support to make housing affordable by reducing their shelter costs to less than 30 per cent of household before-tax income. “Households receive insufficient support” are households that receive subsidized housing support but continue to face unaffordable housing costs (i.e., shelter costs that continue to exceed 30 per cent of household before-tax income).
Source: FAO analysis based on the 2021 Census, 2023 Canadian Income Survey, and information provided by MMAH.
Accessible version
| Year | Households Do Not Receive Support | Households Receive Insufficient Support | Households Receive Sufficient Support | Total Households in Need of Subsidized Housing |
|---|---|---|---|---|
| 2024-25 | 729,355 | 85,938 | 229,970 | 1,045,263 |
| 2025-26 | 791,097 | 78,135 | 229,208 | 1,098,440 |
| 2026-27 | 808,956 | 78,319 | 234,727 | 1,122,002 |
| 2027-28 | 817,572 | 76,442 | 238,380 | 1,132,394 |
Progress on NHS Targets
In the most recent NHS Action Plan, the Province and federal government set updated targets for housing assistance provided under the NHS by type of support by 2027-28. These targets included the expansion of 19,660 rent-assisted units, 104,685 preserved housing units (RGI and below-market rent), 617 households receiving homeownership assistance, and a cumulative 59,438 unique households receiving rent supplements, including 43,604 households through COHB and 15,834 households through OPHI.[31]
As of 2024-25, based on information provided by the Province, the FAO estimates that the Province created 13,298 rent-assisted units (67.6 per cent of the 19,660 unit target);[32] exceeded its housing units preservation target with an estimated 130,517 RGI and below-market rent housing units preserved; provided homeownership assistance to 240 households (38.9 per cent of the 617 target); and provided COHB rent supplements to 31,655 households (72.6 per cent of the 43,604 target). MMAH noted to the FAO that it does not track unique households in receipt of OPHI rent supplements.
| Target | Program | 2027-28 NHS Targets | Actual 2019-20 to 2024-25 | Progress |
|---|---|---|---|---|
| Expansion of Rent-assisted Units | COCHI | 19,660 | 13,298* | 67.6% |
| OPHI | ||||
| Non-NHS | ||||
| Preserved Housing Units | COCHI | 104,685 | 130,517 | 124.7% |
| Homeownership Assistance | OPHI | 617 | 240 | 38.9% |
| Rent Supplements (Unique Households) | COHB | 43,604 | 31,655 | 72.6% |
| OPHI | 15,834 | ** | ** |
Footnotes
[1] Spending by the federal government on provincial subsidized housing programs is recorded by the Province as revenue and spending by MMAH in the Public Accounts of Ontario. Spending by municipalities on provincial subsidized housing programs is from own-sources and excludes funding provided by the federal or provincial governments.
[2] In this report, “municipalities” can refer to municipal governments, municipal service managers and Indigenous Program Administrators, as applicable.
[3] The number of households supported excludes services that do not directly subsidize household shelter costs, including repairs for RGI and below-market rent housing units, and housing-related support services such as counselling and job placements.
[4] In addition to legacy and NHS programs, the Province also provides subsidized housing through provincial homelessness programs, includingthe Homelessness Prevention Program (HPP) and Indigenous Supportive Housing Program (ISHP). Spending on subsidized housing through provincial homelessness programs is not included in the spending figures in this report. However, households supported by the RGI assistance, below-market rental and rent supplement components of homelessness programs are included in the discussion on households supported.
[5] Alternative acceptable housing is considered affordable if the local median market rent does not exceed 30 per cent of the household’s before-tax income.
[6] The FAO’s definition for households in need of subsidized housing expands on the Canada Mortgage and Housing Corporation’s (CMHC’s) measure of “core housing need” as the FAO’s definition also includes households that already receive provincial subsidized housing support sufficient to make their housing affordable.
[7] In this report, “municipalities” can refer to municipal governments, municipal service managers and Indigenous Program Administrators, as applicable.
[8] For the purposes of this report, the term “rent supplements” refers to both rent supplements, which are rent subsidies paid to landlords, and housing allowances and portable housing benefits, which are rent subsidies paid to households.
[9] Provincial programs administered by municipalities include those transferred under the Social Housing Reform Act, 2000 and later the Housing Services Act, 2011.
[10] See Ontario’s Third Action Plan under the National Housing Strategy (2025-2028) and CMHC – Ontario Bilateral Agreement Under the 2017 National Housing Strategy.
[11] See FAO, Economic and Budget Outlook, Winter 2026.
[12] In this report, “municipalities” can refer to municipal governments, municipal service managers and Indigenous Program Administrators, as applicable.
[13] From 2004-05 to 2022-23, municipal spending figures are based on information provided by MMAH. From 2023-24 to 2027-28, municipal spending figures are FAO estimates.
[14] Spending by the federal government on provincial subsidized housing programs is recorded by the Province as revenue and spending by MMAH in the Public Accounts of Ontario. Spending by municipalities on provincial subsidized housing programs is from own-sources and excludes funding provided by the federal or provincial governments.
[15] Rent-geared-to-income housing provides units with rents capped at 30 per cent of a household’s before-tax income. While the SHA provides most support through RGI rentals, the SHA also provides below-market rent housing units and rent supplements.
[16] Below-market rent units are defined as housing with average rents at or below 80 per cent of the average market rent for comparable units in the area. Under the Affordable Housing Program (AHP), developers received construction grants paid over 20 years in exchange for maintaining these units as affordable, after which rents could transition to market rates.
[17] Housing-related supports include services such as counselling and job placements.
[18] For more information, see Ontario’s Third Action Plan under the National Housing Strategy (2025-2028).
[19] For more information, see CMHC – Ontario Bilateral Agreement Under the 2017 National Housing Strategy.
[20] The FAO estimates annual provincial spending of approximately $80 million to $100 million on subsidized housing supports through provincial homelessness programs.
[21] The number of households supported excludes services that do not directly subsidize household shelter costs, including repairs for RGI and below-market rent housing units, and housing-related support services such as counselling and job placements.
[22] RGI assistance primarily provides housing units with rents capped at 30 per cent of a household’s before-tax income, but also provides some households with rent supplements.
[23] Below-market rent units are generally defined as housing with average rents at or below 80 per cent of the average market rent for comparable units in the area.
[24] “Rent supplements” refers to both rent supplements, which are rent subsidies paid to landlords, and housing allowances and portable housing benefits, which are rent subsidies paid to households. However, rent supplements that provide RGI assistance are categorized under RGI assistance.
[25] Alternative acceptable housing is considered affordable if the local median market rent does not exceed 30 per cent of the household’s before-tax income.
[26] Under the CMHC’s definition of “core housing need”, if a household is receiving sufficient government support to make housing affordable (i.e., government support brings shelter costs below 30 per cent of the household’s before-tax income), then the household is not classified as in core housing need. The FAO’s definition of households in need of subsidized housing includes households receiving sufficient government support through provincial subsidized housing programs to make housing affordable. Similar to the CMHC’s definition of core housing need, the FAO’s households in need of subsidized housing excludes individuals in government institutions and individuals experiencing homelessness.
[27] Due to data limitations, 2018-19 figure reflects the 2018 calendar year.
[28] CMHC housing market information portal and CMHC average scheduled monthly payment for new mortgage loans.
[29] The FAO’s projection for rent growth consists of actual growth of 5.7 per cent in 2025 as measured by growth in CMHC’s estimation of median rent in Ontario. Beyond 2025, the FAO projects rent growth slowing to 2.4 per cent by 2028.
[30] Ineligible households are those that are in need of subsidized housing but do not meet program eligibility requirements. Factors affecting eligibility include immigration status, and income or asset levels. Provincial subsidized housing programs are generally restricted to Canadian citizens, permanent residents and refugee claimants. Non-permanent residents, such as international students and temporary foreign workers, are generally ineligible for provincial subsidized housing programs. Additionally, households with incomes or assets exceeding prescribed limits are ineligible for provincial subsidized housing programs. The prescribed asset limits vary by municipality (e.g., the City of Toronto has an asset limit of $150,000), but the Province prescribes a minimum asset limit of $50,000. As a result, most homeowner households in need of subsidized housing are ineligible for provincial subsidized housing program support because their home equity exceeds their local asset limit.
[31] For more information, see Ontario’s Third Action Plan under the National Housing Strategy (2025-2028).
[32] Includes 3,685 physical units created through COCHI and OPHI, 1,800 COCHI and OPHI rent supplements, and 7,813 non-NHS-funded units (e.g., through homelessness initiatives and Ministry of Health supportive housing programs).