


According to the Public Accounts of Ontario, the Province recorded an actual deficit of $7.4 billion in 2018-19, double the 2017-18 deficit of $3.7 billion. The actual 2018-19 deficit also turned out to be significantly lower than the $11.7 billion deficit projected by both the FAO and the government at the time of the 2019 Ontario Budget.
This note examines the underlying factors behind the relatively large $3.7 billion year-over-year deterioration in the 2018-19 deficit, and shows that this sharp rise was largely the result of policy choices by both the previous and current governments – including the cancellation of the cap and trade program and higher spending on electricity subsidies.
The note also looks at the unusually large $4.3 billion improvement in the actual 2018-19 deficit from the 2019 budget projection,[1] which was largely the result of unexpectedly strong revenues.
Ontario’s deficit rose by $3.7 billion in 2018-19, but was $4.3 billion lower than the budget projection
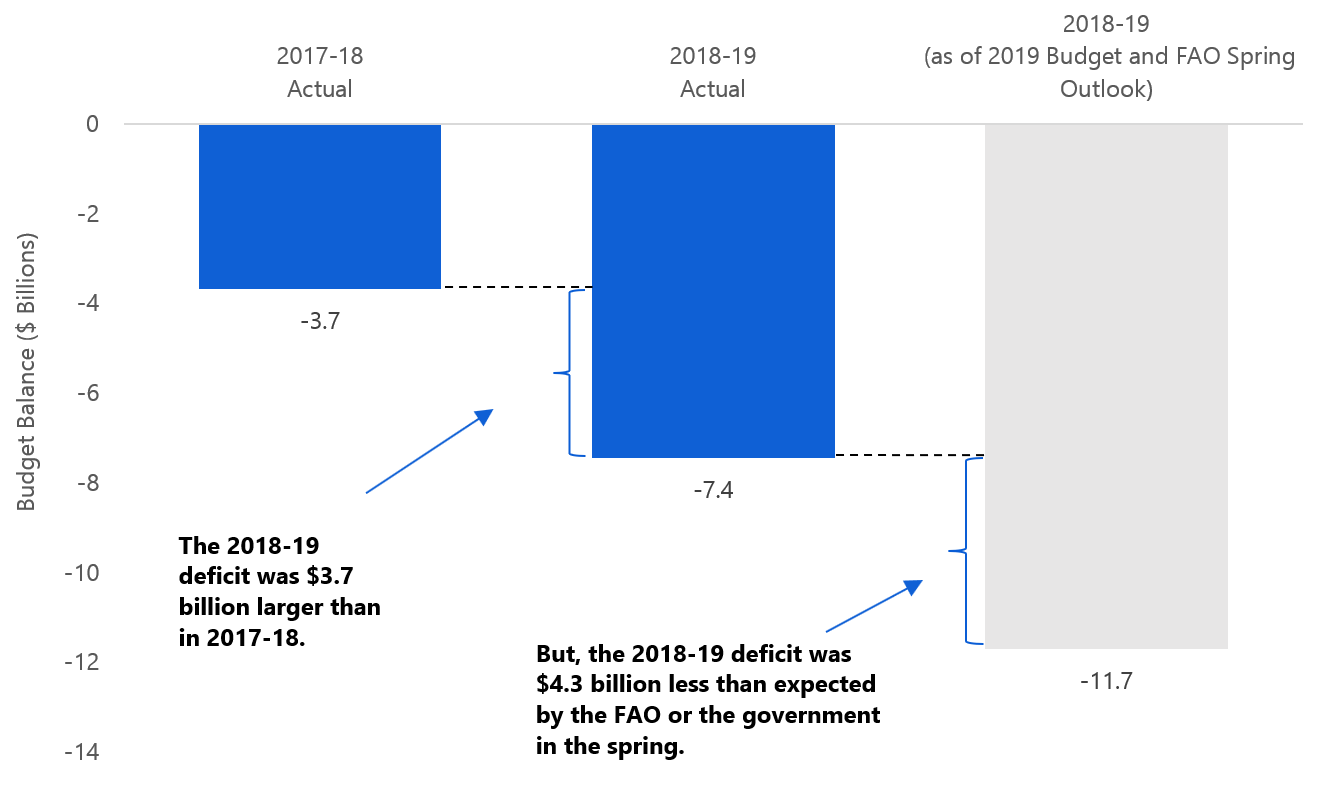
Source: 2018-19 Ontario Public Accounts and 2019 Ontario Budget.
Examining the year-over-year increase in Ontario’s 2018-19 deficit: spending increases outpaced revenue, doubling the deficit
In 2018-19, Ontario recorded a budget deficit of $7.4 billion, double the 2017-18 deficit of $3.7 billion. The relatively sharp increase in the deficit was the result of modest revenue growth, combined with a relatively large increase in program spending. Policy decisions by both the current and previous governments contributed to the slow increase in revenues as well as the rise in spending last year.
Policy decisions weakened revenue growth
A decline in non-tax revenue offset the surprisingly strong tax revenue growth in 2018-19
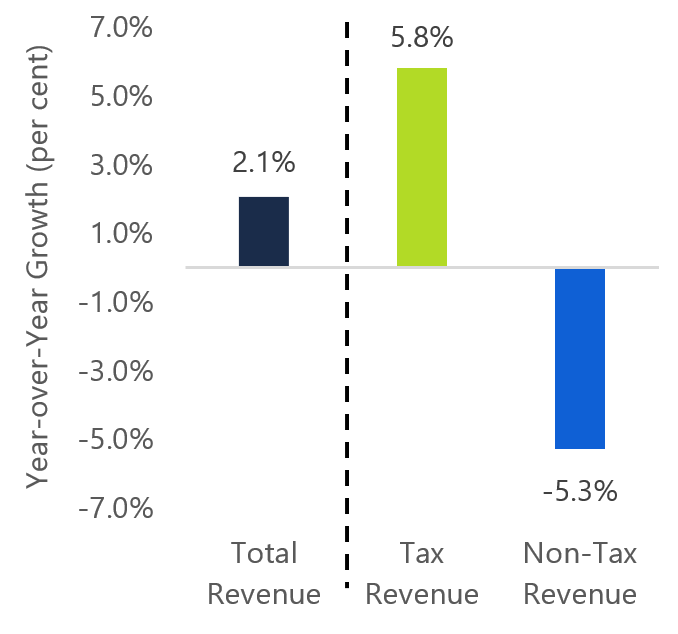
Source: Ontario Public Accounts and FAO.
Ontario’s total revenues increased by a modest 2.1 per cent in 2018-19, the result of a surprisingly strong 5.8 per cent increase in tax revenues offset by a 5.3 per cent decline in non-tax revenues. The decline in non-tax revenues reflected a number of policy decisions that included the loss of revenue from the cancellation of the cap and trade program, the end of the debt retirement charge, fewer asset sales, and a one-time reduction in Hydro One’s net income.
Tax revenue growth was unexpectedly strong
Tax revenue gains typically reflect economic growth. From 2000 to 2017, tax revenues grew by 3.5 per cent per year on average, in-line with 3.6 per cent average growth in nominal GDP.
Surprisingly strong tax revenues in 2018-19
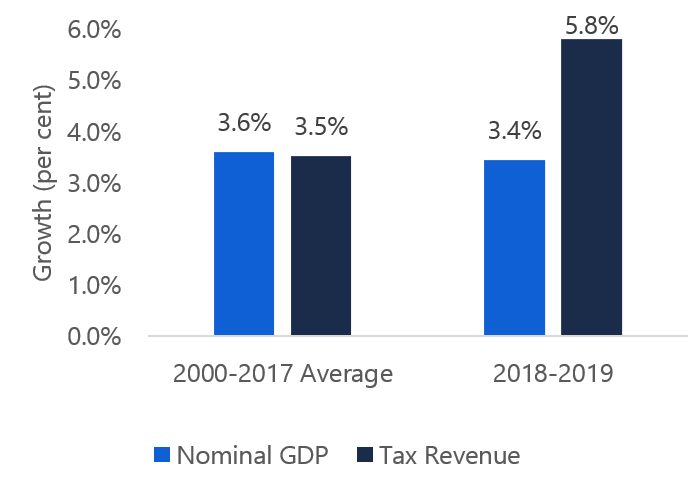
Source: Ontario Public Accounts and FAO.
However, in 2018-19, tax revenues increased by 5.8 per cent (or $5.8 billion), well ahead of the estimated 3.4 per cent growth in nominal GDP.
The higher-than-expected growth in tax revenue was primarily due to much stronger corporate income tax revenues than anticipated. Personal income tax also showed surprising strength in 2018-19, rising 7.5 per cent. These increases were partly offset by a decline in land transfer taxes due to a softer resale housing market.
Government policy decisions reduced non-tax revenues in 2018-19
Non-tax revenue[2] declined by 5.3 per cent (or -$2.7 billion) in 2018-19, driven by several key policy decisions by both the previous and current governments.
Policy decisions lowered 2018-19 non-tax revenues
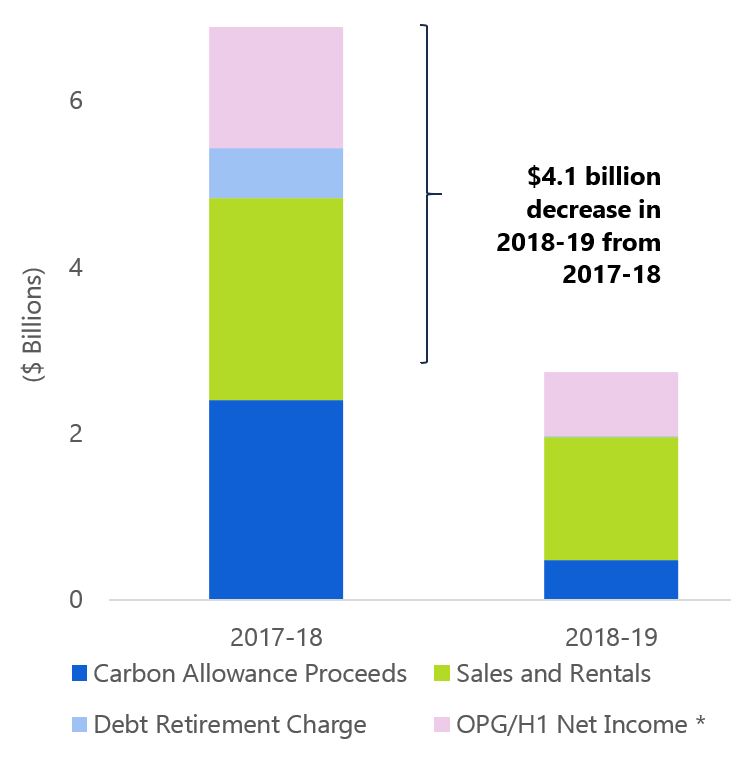
* Note: This includes the net income of Ontario Power Generation, Hydro One and Brampton Distribution Holdco Inc.
Source: Ontario Public Accounts and FAO.
In July 2018, the Province ended the cap and trade program, which raised revenue through the auction of emissions allowances to fund spending on greenhouse gas reduction initiatives. The end of the cap and trade program led to a $1.9 billion decline in 2018-19 revenues compared to 2017-18.[3]
As part of the Province’s partial sale of Hydro One, the government sold 20 per cent of Hydro One’s equity in 2017-18,[4] temporarily boosting sales and rental revenue in that year. Fewer asset sales in 2018-19 resulted in a $0.9 billion reduction in sales and rentals revenue when compared to 2017-18.
A further consequence of Hydro One’s partial sale was an Ontario Energy Board ruling that resulted in a one-time $0.4 billion reduction in the Province’s revenue received from the corporation in 2018-19.[5]
In addition, the Debt Retirement Charge[6] was removed from non-residential electricity bills on March 31, 2018, which permanently lowered non-tax revenue by $0.6 billion beginning in 2018-19.
Taken together, these four non-tax revenue streams declined by $4.1 billion in 2018-19. This more than offset a $1.4 billion increase in other non-tax revenue sources, leading to a $2.7 billion decline in overall non-tax revenues in 2018-19. See Appendix A for further details.
Electricity subsidies a key factor behind strong spending increase in 2018-19
Program spending increased by 4.5 per cent (or $6.4 billion) in 2018-19, with each of the five largest ministries recording significantly higher spending on a year-over-year basis.
| Ministry Expense | 2017-18 ($ millions) |
2018-19 ($ millions) |
y/y change ($ millions) |
y/y growth (per cent) |
| Program Spending | 142,363 | 148,751 | 6,388 | 4.5% |
| Health and Long-Term Care | 59,066 | 61,511 | 2,445 | 4.1% |
| Education * | 28,998 | 30,425 | 1,427 | 4.9% |
| Community and Social Services | 12,264 | 12,767 | 503 | 4.1% |
| Advanced Education and Skills Development | 11,104 | 11,869 | 765 | 6.9% |
| Energy | 3,496 | 4,899 | 1,403 | 40.1% |
| of which: Electricity Cost Relief Programs | 2,834 | 4,242 | 1,407 | 49.7% |
| All Other Ministries | 27,435 | 27,280 | -155 | -0.6% |
| Interest on Debt | 11,903 | 12,384 | 481 | 4.0% |
| Total Expense | 154,266 | 161,135 | 6,869 | 4.5% |
The cost of electricity subsidies reached $4.2 billion in 2018-19
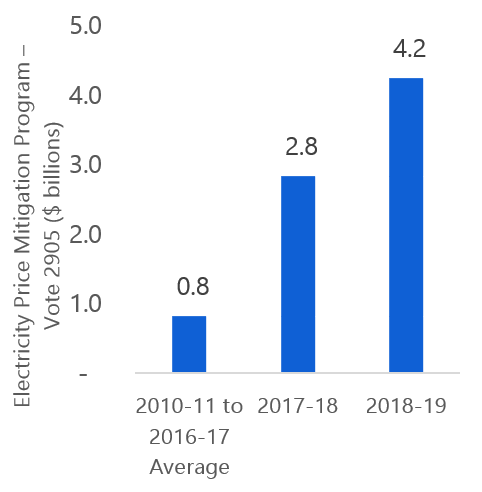
Source: Ontario Public Accounts and FAO.
Notably, Ministry of Energy expenditures increased at the fastest rate, largely due to the sharply higher cost of electricity subsidies.
The government spent $4.2 billion subsidizing electricity prices in 2018-19, an increase of almost 50 per cent from $2.8 billion in 2017-18.[7]
Spending by the Ministry of Health and Long-Term Care increased by 4.1 per cent (or $2.4 billion) in 2018-19. This was mainly driven by funding increases for hospitals[8] and higher expenditure for Drug Programs that reflected the introduction of OHIP+.[9]
Education spending grew by 4.9 per cent in 2018-19, an increase of $1.4 billion.[10] Increased funding for school boards was the largest driver of education spending, along with spending for childcare and early years programs.[11]
Spending in all other ministries declined by $0.2 billion in 2018-19, mostly due to lower spending in Indigenous Relations and Reconciliation, Environment and Climate Change, and the Treasury Board Secretariat.[12] See Appendix B for further details.
Comparing Ontario’s actual 2018-19 results with the 2019 budget projection: unexpectedly strong revenues and lower spending reduced the deficit
The FAO’s Spring 2019 Economic and Budget Outlook projected an $11.7 billion deficit for 2018-19, consistent with the interim deficit reported in the 2019 Ontario Budget. However, the 2018-19 Ontario Public Accounts reported an actual budget deficit of $7.4 billion last year, $4.3 billion lower than projected by both the FAO and Ontario government.
The unusually large[13] $4.3 billion improvement in the deficit, compared to the spring projection, was the result of $2.9 billion in higher revenues – in large part a sharp jump in corporate tax revenues – combined with $1.4 billion in lower program spending than projected in the 2019 budget.
Unexpectedly high revenue and government spending revisions improved Ontario’s 2018-19 deficit
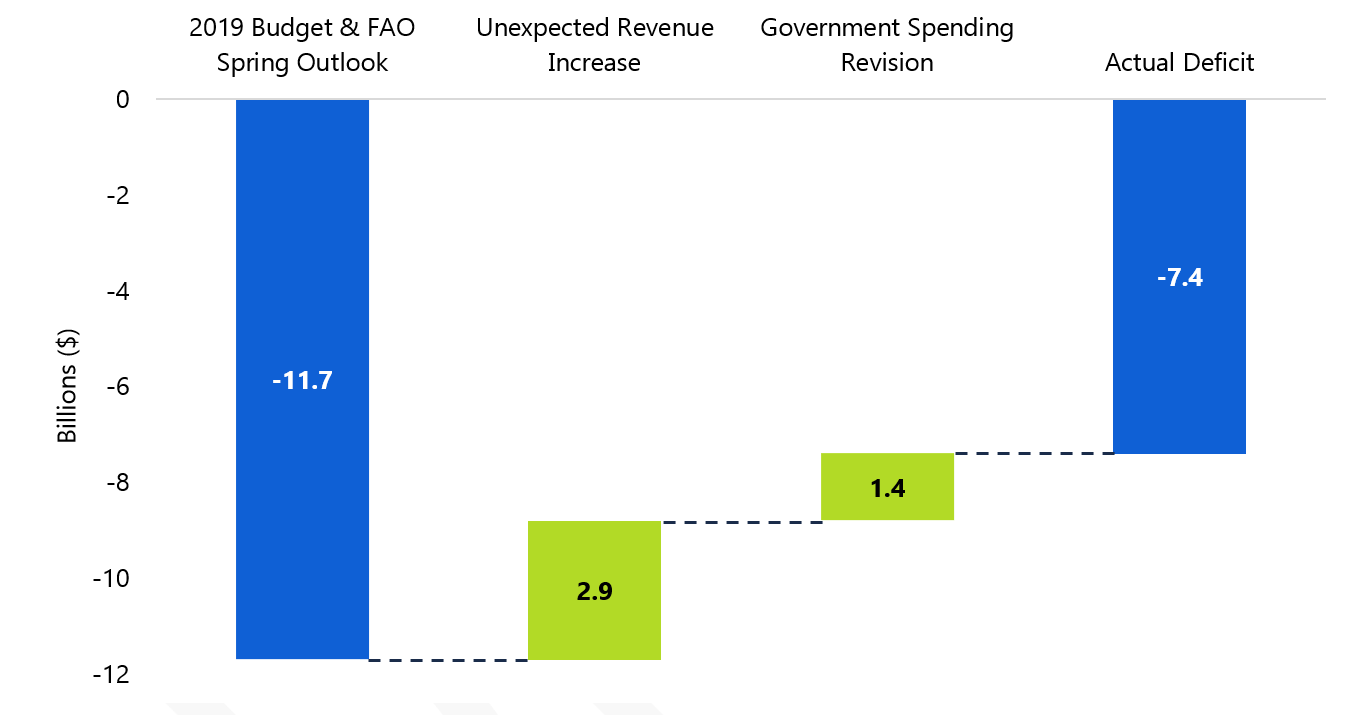
Source: 2018-19 Ontario Public Accounts and FAO.
Three revenue sources accounted for most of the $2.9 billion increase relative to the FAO projection. Corporations tax for 2018-19 was $1.4 billion (or 9.3 per cent) higher than anticipated, personal income tax was $0.4 billion higher, while income from government business enterprises was $0.6 billion above expectations.
At the same time, total spending in the 2018-19 Public Accounts was $1.4 billion lower than planned at the time of the 2019 budget, primarily due to lower than planned spending in Health and Long-term Care, Education, Environment, as well as unspent contingency funds.[14]
With the release of the Public Accounts showing a deficit of $7.4 billion in 2018-19, the government has significantly overachieved on the 2019 budget’s projection of an $11.7 billion deficit, largely as a result of unexpectedly high revenues. However, the extent to which this overachievement will carry-forward to future years is uncertain.
The government will be releasing an updated fiscal plan, incorporating the 2018-19 final results, in the upcoming 2019 Fall Economic Statement, scheduled for release on November 6.
Appendix A: Revenue by Source
| 2017–18 Actual | 2018–19 Actual | y/y change | y/y growth | |
| $M | $M | $M | Per cent | |
| Taxation | ||||
| Personal Income Tax | 32,900 | 35,381 | 2,481 | 7.5% |
| Sales Tax | 25,925 | 27,808 | 1,883 | 7.3% |
| Corporations Tax | 15,612 | 16,606 | 994 | 6.4% |
| Employer Health Tax | 6,205 | 6,544 | 339 | 5.5% |
| Education Property Tax | 5,883 | 6,171 | 288 | 4.9% |
| Ontario Health Premium | 3,672 | 3,819 | 147 | 4.0% |
| Land Transfer and Non-Residential Speculation Tax | 3,174 | 2,761 | -413 | -13.0% |
| Gasoline Tax | 2,701 | 2,709 | 8 | 0.3% |
| Tobacco Tax | 1,244 | 1,241 | -3 | -0.2% |
| Fuel Tax | 760 | 774 | 14 | 1.8% |
| Beer and Wine Tax | 601 | 603 | 2 | 0.3% |
| Electricity Payments-In-Lieu of Taxes | 494 | 435 | -59 | -11.9% |
| Ontario Portion of Federal Cannabis Excise Duty | – | 19 | 19 | |
| Other Taxes | 552 | 653 | 101 | 18.3% |
| Total Tax Revenue | 99,723 | 105,524 | 5,801 | 5.8% |
| Transfers from Government of Canada | ||||
| Canada Health Transfer | 14,359 | 14,852 | 493 | 3.4% |
| Canada Social Transfer | 5,314 | 5,451 | 137 | 2.6% |
| Equalization Payments | 1,424 | 963 | -461 | -32.4% |
| Labour Market Development Agreement | 672 | 719 | 47 | 7.0% |
| Infrastructure Programs | 1,065 | 605 | -460 | -43.2% |
| Social Housing | 419 | 394 | -25 | -6.0% |
| Direct Transfers to Hospitals, School Boards and Colleges | 314 | 390 | 76 | 24.2% |
| Home Care and Mental Health | 116 | 329 | 213 | 183.6% |
| Workforce Development Agreement | 234 | 296 | 62 | 26.5% |
| Indian Welfare Services Agreement | 274 | 281 | 7 | 2.6% |
| Early Learning and Childcare | 122 | 160 | 38 | 31.1% |
| Bilingualism Development | 85 | 85 | – | 0.0% |
| Legal Aid – Criminal | 64 | 64 | – | 0.0% |
| Youth Criminal Justice | 52 | 53 | 1 | 1.9% |
| Labour Market Agreement for Persons with Disabilities | 63 | – | – 63 | |
| Other | 283 | 448 | 165 | 58.3% |
| Total Transfer Revenue | 24,860 | 25,090 | 230 | 0.9% |
| Income from Investment in Government Business Enterprises | ||||
| Ontario Lottery and Gaming Corporation | 2,487 | 2,464 | -23 | -0.9% |
| Liquor Control Board of Ontario | 2,207 | 2,276 | 69 | 3.1% |
| Ontario Cannabis Store | -6 | -42 | -36 | 600.0% |
| Ontario Power Generation Inc./Hydro One Ltd. | 1,464 | 772 | -692 | -47.3% |
| Total Government Business Enterprise Income | 6,152 | 5,470 | -682 | -11.1% |
| Other Revenue | ||||
| Fees, Donations and Other Revenues from Hospitals, School Boards and Colleges | 8,309 | 9,237 | 928 | 11.2% |
| Vehicle and Driver Registration Fees | 1,912 | 1,991 | 79 | 4.1% |
| Sales and Rentals | 2,450 | 1,477 | -973 | -39.7% |
| Other Fees and Licenses | 819 | 861 | 42 | 5.1% |
| Carbon Allowance Proceeds | 2,401 | 472 | -1,929 | -80.3% |
| Royalties | 290 | 251 | -39 | -13.4% |
| Independent Electricity System Operator Revenue | 210 | 227 | 17 | 8.1% |
| Power Supply Contract Recoveries | 185 | 173 | -12 | -6.5% |
| Local Services Realignment | 138 | 138 | 0 | 0.0% |
| Net Reduction of Power Purchase Contracts | 74 | 41 | -33 | -44.6% |
| Electricity Debt Retirement Charge | 593 | 15 | -578 | -97.5% |
| Miscellaneous | 2,478 | 2,733 | 255 | 10.3% |
| Total Other Revenue | 19,859 | 17,616 | -2,243 | -11.3% |
| Total Revenue | 150,594 | 153,700 | 3,106 | 2.1% |
Appendix B: Expense by Ministry
| 2017–18 Actual ($M) |
2018–19 Actual ($M) |
y/y change ($M) |
y/y growth (Per cent) |
|
|---|---|---|---|---|
| Ministry | ||||
| Accessibility Directorate of Ontario | 19 | 18 | -1 | -5.3% |
| Advanced Education and Skills Development | 11,104 | 11,869 | 765 | 6.9% |
| Agriculture, Food and Rural Affairs | 989 | 1,066 | 77 | 7.8% |
| Attorney General | 1,686 | 1,714 | 28 | 1.7% |
| Board of Internal Economy | 296 | 371 | 75 | 25.3% |
| Children and Youth Services | 4,116 | 4,419 | 303 | 7.4% |
| Citizenship and Immigration | 44 | 100 | 56 | 127.3% |
| Community and Social Services | 12,264 | 12,767 | 503 | 4.1% |
| Community Safety and Correctional Services | 2,523 | 2,678 | 155 | 6.1% |
| Economic Development and Growth/Research, Innovation and Science | 898 | 890 | -8 | -0.9% |
| Education | 27,339 | 28,747 | 1,408 | 5.2% |
| Teachers’ Pension | 1,659 | 1,678 | 19 | 1.1% |
| Energy | 3,496 | 4,899 | 1,403 | 40.1% |
| Environment and Climate Change | 715 | 560 | -155 | -21.7% |
| Executive Offices | 55 | 50 | -5 | -9.1% |
| Finance | 845 | 954 | 109 | 12.9% |
| Interest on Debt | 11,903 | 12,384 | 481 | 4.0% |
| Municipal Partnership Fund | 506 | 510 | 4 | 0.8% |
| Power Supply Contract Costs | 191 | 173 | -18 | -9.4% |
| Francophone Affairs | 6 | 6 | 0 | 0.0% |
| Government and Consumer Services | 569 | 567 | -2 | -0.4% |
| Health and Long-Term Care | 59,066 | 61,511 | 2,445 | 4.1% |
| Indigenous Relations and Reconciliation | 1,208 | 289 | -919 | -76.1% |
| Infrastructure | 1,739 | 1,766 | 27 | 1.6% |
| International Trade | 47 | 39 | -8 | -17.0% |
| Labour | 303 | 308 | 5 | 1.7% |
| Municipal Affairs and Housing | 1,368 | 1,479 | 111 | 8.1% |
| Natural Resources and Forestry | 851 | 838 | -13 | -1.5% |
| Northern Development and Mines | 744 | 826 | 82 | 11.0% |
| Senior Affairs | 27 | 32 | 5 | 18.5% |
| Status of Women | 27 | 22 | -5 | -18.5% |
| Tourism, Culture and Sport | 1,582 | 1,545 | -37 | -2.3% |
| Transportation | 4,452 | 4,713 | 261 | 5.9% |
| Treasury Board Secretariat | 187 | 182 | -5 | -2.7% |
| Employee and Pensioner Benefits | 1,442 | 1,165 | -277 | -19.2% |
| Total Expense | 154,266 | 161,135 | 6,869 | 4.5% |
This chart compares Ontario’s actual deficit in 2018-19 to the actual deficit in 2017-18 and to the projected deficit for 2018-19 in the 2019 Ontario Budget and FAO spring outlook. The graph shows that the deficit in 2017-18 was $-3.7 billion, the actual deficit in 2018-19 was $-7.4 billion, and the projected deficit for 2018-19 was $-11.7 billion. The graph highlights the fact that the 2018-19 deficit was $3.7 billion larger or roughly double the 2017-18 budget deficit, and that the 2018-19 deficit was $4.3 billion less than expected by the FAO or the government in the spring.
This chart shows the year-over-year growth of total revenue, tax revenue, and non-tax revenue for 2018-19. The graph shows that total revenue grew 2.1 per cent, tax revenue grew 5.8 per cent and non-tax revenue declined by 5.3 per cent in 2018-19.
This chart shows the average annual growth in nominal GDP and tax revenue from 2000 to 2017 and the growth in nominal GDP and tax revenue in 2018-19. Between 2000 and 2017, the nominal GDP grew by 3.6 per cent per year while tax revenue grew by 3.5 per cent per year. In 2018-19, nominal GDP grew by 3.4 per cent while tax revenue grew by 5.8 per cent.
This chart decomposes the non-tax revenue in 2017-18 and 2018-19 into four components namely (1) carbon allowance proceeds, (2) sales and rentals, (3) debt retirement charge, and (4) net income from Ontario Power Generation, Hydro One, and Brampton Distribution Holdco Inc. It illustrates that the revenue from carbon allowance proceeds was $2.40 billion in 2017-18 and $0.47 billion in 2018-19. Revenue from sales and rentals was $2.43 billion in 2017-18 and $1.48 in 2018-19. Revenue from debt retirement charge was $0.59 billion in 2017-18 and $0 in 2018-19. And revenue from Ontario Power Generation, Hydro One, and Brampton Distribution Holdco Inc. was $1.46 billion in 2017-18 and $0.77 billion in 2018-19. Overall, this chart highlights the fact that there was a $4.1 billion decrease in non-tax revenue in 2018-19 from 2017-18.
This chart shows the average cost of the Electricity Price Mitigation Program (Vote 2905) from 2010-11 to 2016-17, and the cost of the program in both 2017-18 and 2018-19. The chart shows that the cost of the program was $0.8 billion on average from 2010-11 to 2016-17, $2.8 billion in 2017-18, and $4.2 billion in 2018-19.
This chart shows the breakdown of the difference between the projected budget deficit as of the 2019 Budget and FAO Spring Outlook and the actual deficit in 2018-19. It decomposes the difference between the $-11.7 billion deficit projected in the 2019 budget and FAO spring outlook and the $-7.4 billion actual deficit into two components: (1) unexpected revenue increase amounting $2.9 billion and (2) government spending revision amounting $1.4 billion.
Footnotes
[1] The 2019 budget refers to the prior year (2018-19) as the ‘interim estimate’.
[2] This includes transfers from the federal government, income from government business enterprises, and other non-tax revenues, such as service fees.
[3]The FAO estimated that cancelling Ontario’s cap and trade program added $841 million on net to the 2018-19 deficit, because the Province gave up the revenue but did not cancel all the spending programs. Also, the Province sustained “wind-down” costs and several of the cancelled spending programs funded infrastructure projects that will not provide immediate savings to the Province. See the FAO’s 2018 report “Cap and Trade: A Financial Review of the Decision to Cancel the Cap and Trade Program”
[4]The FAO estimates the secondary offering in 2017-18 generated about $0.7 billion in revenue. See the FAO’s 2018 report on the partial sale of Hydro One for more details.
[5] 5 The partial sale of Hydro One created a $2.8 billion deferred tax asset. The Ontario Energy Board (OEB) ruled that 38 per cent of this gain should be allocated to ratepayers. Hydro One’s appeal of the OEB’s decision in Divisional Court was unsuccessful. This resulted in an $867 million payment from Hydro One to ratepayers in 2018-19, temporarily lowering its net income (see the 2018-19 Public Accounts, page 78). As the government owns 47 per cent of Hydro One, the net impact on the Province’s deficit was approximately $400 million. See the FAO’s 2018 report on the partial sale of Hydro One for more details.
[6] The Debt Retirement Charge (DRC) was a charge payable on electricity consumed in Ontario and replaced a portion of debt servicing costs previously included as part of electricity bills before the restructuring of the former Ontario Hydro. The government ended the DRC on residential bills as of January 1, 2016.
[7] This increase reflects the first full-year fiscal impact of the Fair Hydro Plan (FHP) provisions, which was introduced on July 1, 2017. These costs are consistent with the Auditor General’s recommended accounting treatment of the FHP. Many of the FHP’s provisions began on July 1, 2017 and had a partial impact in the 2017-18 fiscal year. In addition, higher electricity generation costs and electricity demand in 2018-19 increased the required subsidy to satisfy the FHP’s commitment to limit electricity bill increases to the rate of inflation. See the FAO’s “An Assessment of the Fiscal Impact of the Province’s Fair Hydro Plan“.
[8] Spending by Local Health Integration Networks (LHINs, vote item 1411) increased by $1.2 billion in 2018-19, and hospital funding accounts for two-thirds of LHIN spending. See the FAO’s “Expenditure Estimates 2019-20 Ministry of Health and Long-Term Care“.
[9] OHIP+ added to Ontario drug programs expenditures in 2018-19. See the FAO’s 2019 “Ontario Health Sector” report for more details.
[10] This includes spending for the Ontario Teacher’s Pension Plan.
[11] Total expense in the Elementary and Secondary Education Program (vote 1002, which provides financial support to school boards) was increased by $1.0 billion in 2018-19.
[12] In 2017-18 the Province recorded a $1.1 billion one-time settlement in Indigenous Relations and Reconciliation, which led to a $900 million decline in 2018-19 spending.