

1. Summary
Ontario Hospital Capacity Prior to the COVID-19 Outbreak
- In 2019-20, there were 141 public hospitals serving the province, with around 34,700 beds. Of these beds, 22,400 were acute care beds, which included 2,012 beds configured for critical care.[1]
- The average occupancy rate of the Province’s acute care beds was 96 per cent in 2018-19, including approximately 28 hospitals where the average occupancy rate for the year was over 100 per cent.[2]
- In comparison to other countries, Ontario’s rate of total hospital beds per 1,000 people is among the lowest in the Organisation for Economic Co-operation and Development (OECD) and Ontario’s occupancy rate is the highest.
Actions to Limit the Spread of the COVID-19 Outbreak and Increase Hospital Capacity
- COVID-19 was first identified in the Hubei Province in China in December 2019. COVID-19 has proven to be uniquely infectious and has a higher mortality rate than the flu.[3]
- Without any actions to limit the spread of COVID-19 in Ontario, the virus would have resulted in a sharp rise in the demand for hospital services with the potential to overwhelm the health care system.[4]
- As a result, the Province announced strict economic and social measures to slow and limit the spread of the virus in order to delay and lower the peak number of infections, thereby reducing hospital demand. At the same time, the government increased health sector funding and took other measures to both increase the availability of existing hospital beds and to add new hospital beds and ventilators.
Impact of Measures on Hospital Bed Availability
- The FAO estimates that in the lead-up to the COVID-19 outbreak, the Province had 906 acute care beds, 357 critical care beds, and 356 critical care beds with ventilators that were unoccupied (i.e., available).
- By April 14, the Province and Ontario hospitals had taken measures that made available an additional 9,349 acute care beds, 2,077 critical care beds and 2,075 critical care beds with ventilators, including:[5]
- Cancelling elective surgeries and other measures taken to free-up existing beds (including moving existing hospital patients to alternative places of care) resulted in the availability of 7,849 acute care and 585 critical care beds (583 with ventilators).
- Measures to expand capacity, including $0.3 billion in funding for new beds and other actions taken by hospitals, created 1,500 acute care beds and 1,492 critical care beds.
- The Province deployed 1,492 ventilators: 200 from its stockpile and 1,300 from other sources.
Usage of Available Hospital Beds by COVID-19 Patients
- From April 17 to April 19, the total number of hospitalized COVID-19 patients began to decline, only to begin to increase again, starting April 20, likely due to the growing COVID-19 outbreak in long-term care homes. As of April 23, there were 910 hospitalized COVID-19 patients, of which 243 required critical care. Despite the recent growth in hospitalizations, the Province has a significant amount of remaining available capacity to accommodate COVID-19 hospitalizations. As of April 23, there were approximately 9,345 unoccupied acute care and 2,191 unoccupied critical care beds.
| Acute Care | Critical Care | Critical Care with Ventilator | |
|---|---|---|---|
| Total Beds Available | 10,255 | 2,434 | 2,431 |
| Available Beds Used by COVID-19 Patients | 910 | 243 | 193 |
| Remaining Beds Available | 9,345 | 2,191 | 2,238 |
- To illustrate the importance of when the emergency measures were implemented in Ontario, the FAO analyzed the potential impact on Ontario’s critical care hospitalizations if the measures to limit the spread of the COVID-19 virus beginning on March 17 had been implemented five days later. In this scenario, the number of concurrent COVID-19 critical care patients to date would have been over 1,100, over four times greater than what has occurred as of April 23.[6]
Reallocation of Health Sector Resources to Vulnerable Areas
- As of the writing of this report, the primary focus of the Province’s COVID-19 response now involves redirecting resources to manage the growing outbreak in vulnerable populations such as long-term care (LTC) home residents. As of April 23, at least 30 per cent of new reported COVID-19 cases are the result of testing LTC residents and staff and over 60 per cent of fatal COVID-19 cases in Ontario have resulted from outbreaks in the Province’s LTC homes.
- On April 15, the Province announced new measures to address the spread of COVID-19 in LTC homes.[7] In addition, it has been reported that some long-term care homes have begun to transfer residents to local hospitals, thereby utilizing unoccupied hospital beds. This may allow LTC homes to better isolate their remaining residents and more effectively attempt to control the COVID-19 outbreak.
Key Questions for MPPs
To date, the measures to increase the available capacity of hospital beds and limit the spread of COVID-19 in Ontario have allowed Ontario hospitals to accommodate the surge of COVID-19 patients. However, going forward, the spread of the virus and the impact on hospital capacity remains uncertain and will be influenced by the actions taken by the Province to lift the containment measures and resume normal operations in the economy and the health sector. To support MPPs’ review of the Province’s actions, the FAO has identified the following key questions that MPPs may wish to ask the government. For each question, the FAO provides additional information in chapter 6 to provide context.
- What are the conditions required to lift the containment measures?
- How will the containment measures be lifted?
- What preparations is the government making to ensure that COVID-19 continues to be contained?
- How will Ontario’s health care system return to normal and how much additional funding will be required?
2. Background and Purpose of Report
Hospital Capacity Prior to the COVID-19 Outbreak
In Ontario, hospitals are independent corporations but are funded and controlled by the government of Ontario (the Province).[8] In 2019-20, there were 141 public hospitals serving the province, with around 34,700 beds. The Province’s 34,700 total hospital beds included 22,400 acute care beds, with the remaining 12,300 beds for chronic care, general rehabilitation, special rehabilitation and mental health. Of the 22,400 acute care beds, 2,012 were configured for critical care[9] and 1,319 of these critical care beds were equipped with mechanical ventilators. In addition to the ventilators in hospitals, the Province maintains a stockpile of over 200 ventilators for periods of capacity pressure.[10]
Figure 2-1 Total Hospital Beds in Ontario by Type, Before the COVID-19 Outbreak
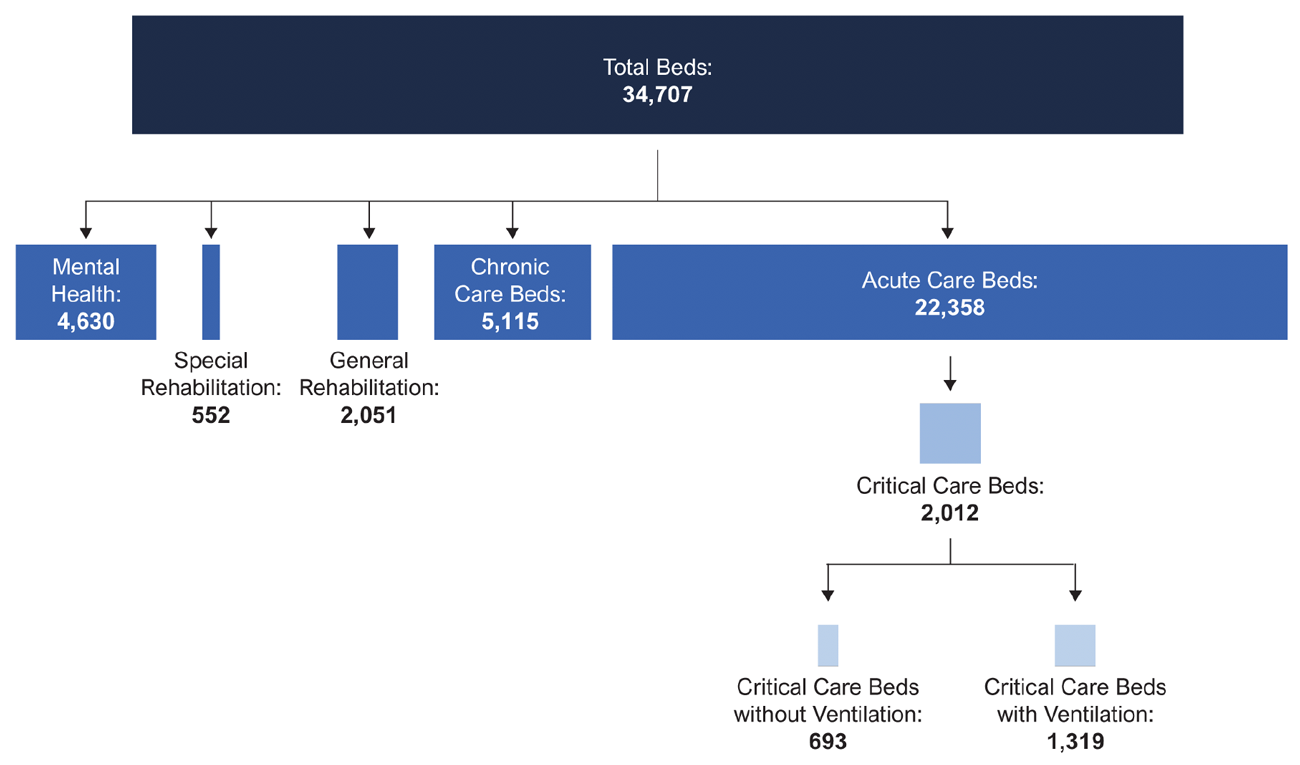
Note: The figures for acute care beds, critical care beds and ventilation are for March 2020. The bed count for mental health, general and special rehabilitation and chronic care beds is from 2018-19.
Source: Ministry of Health, Critical Care Services Ontario and FAO analysis.
The average occupancy rate of both acute care beds and total hospital beds was 96 per cent in 2018-19, which included approximately 28 hospitals where the average occupancy rate for the year was over 100 per cent.[11] Due to the lack of beds compared to patients, some hospitals have relied on placing patients in emergency rooms, in unconventional spaces (such as hallways) or on stretchers. On average, hospitals reported that 1,057 patients received care in these unconventional settings each day in 2018-19.
Overall, in comparison to other countries, Ontario’s rate of total hospital beds per 1,000 people is among the lowest in the Organisation for Economic Co-operation and Development (OECD) and Ontario’s occupancy rate of 96 per cent is the highest. See Appendix A: International Comparison of Hospital Capacity and Occupancy for more information.
Purpose of this Report
The purpose of this report is to provide Members of Provincial Parliament (MPPs) with a preliminary review of the impact of the COVID-19 outbreak on the Ontario health sector, with a focus on hospital capacity. The report begins by providing an overview of the COVID-19 outbreak. Next, the report reviews the Province’s actions to limit the spread of COVID-19 and increase health sector capacity and availability. The report then reviews the COVID-19 outbreak in Ontario and the effect of the outbreak on hospital capacity. Finally, looking forward, the FAO identifies key questions that MPPs may wish to ask the government.
This report does not seek to:
- Estimate the future spread of COVID-19 in Ontario.
- Evaluate public health outcomes resulting from the COVID-19 outbreak.
3. Overview of the 2019 Novel Coronavirus Outbreak
The coronavirus disease 2019 (COVID-19) was first identified in the Hubei Province in China in December 2019. The virus responsible for COVID-19 is part of the coronavirus family that also includes SARS and MERS but is uniquely infectious and has a higher mortality rate than the flu.
Approximately 80 to 90 per cent of individuals who are infected with COVID-19 recover without requiring hospital treatment.[12] However, the remaining 10 to 20 per cent develop more severe symptoms and require hospitalization. Approximately one quarter of hospitalized patients develop more severe breathing difficulty and require admission to intensive care. In the most severe intensive care cases, the body’s response to the virus causes fluid to enter the lungs and the patient will require a mechanical ventilator to assist with breathing.[13]
On average, each infected person spreads the virus to 2.5 other people every five days.[14] With this reproduction rate, the number of infections would grow by 20 per cent per day, resulting in the infection doubling every 4 to 5 days, and over a 30-day period, multiplying by nearly 250 times.
At this pace of growth, the government of Canada warned that COVID-19 was expected to infect between 30 per cent to 70 per cent of all Canadians.[15] In Ontario, this would represent between 4 to 10 million infections and result in 40,000 to 100,000 fatalities.
Figure 3-1 Infection Rate of COVID-19
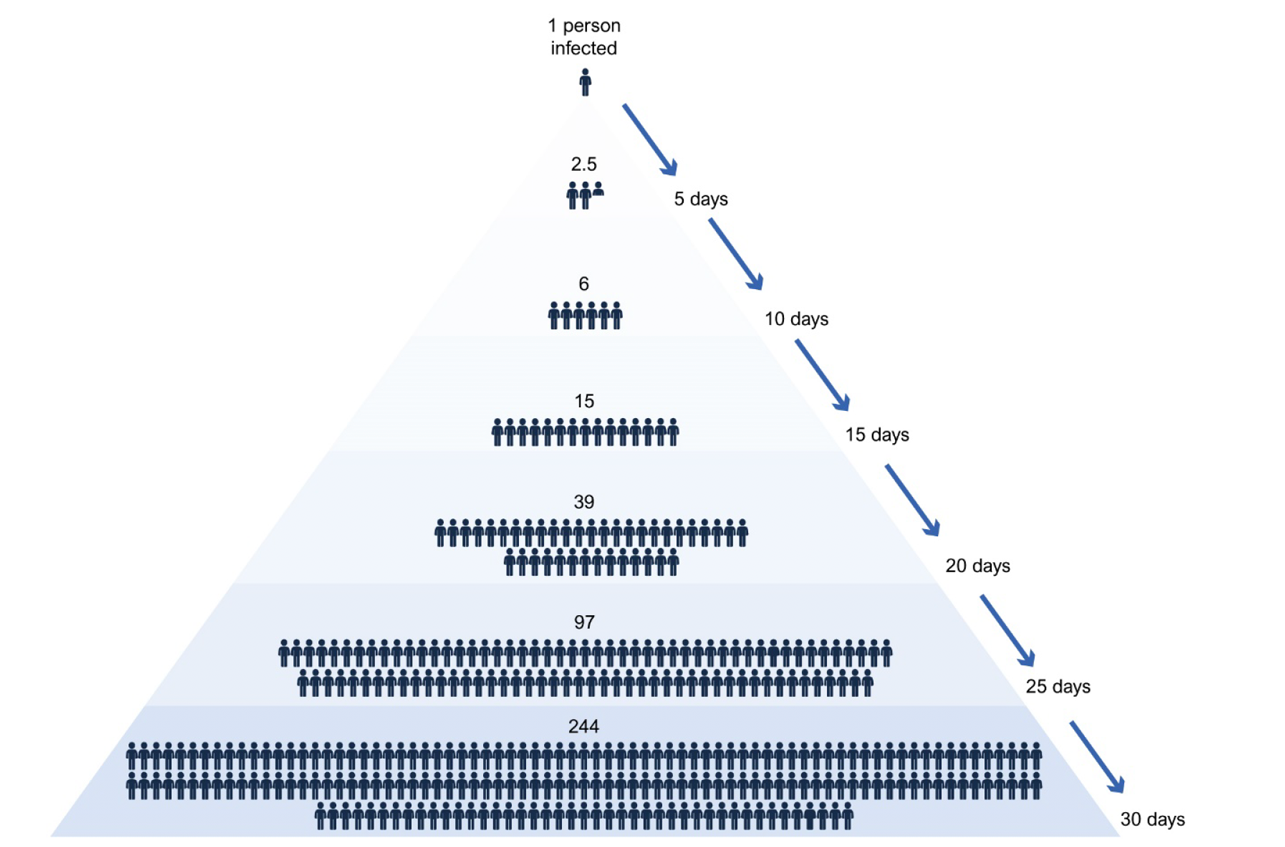
Source: World Health Organization, Coronavirus Disease 2019 Situation Report – 46, March 6, 2020 and The Novel Coronavirus, 2019-nCoV, is Highly Contagious and More Infectious Than Initially Estimated, Steven Sanche, Yen Ting Lin, Chonggang Xu, Ethan Romero-Severson, Nick Hengartner, Ruian Ke, February 11, 2020.
4. Ontario Government Response
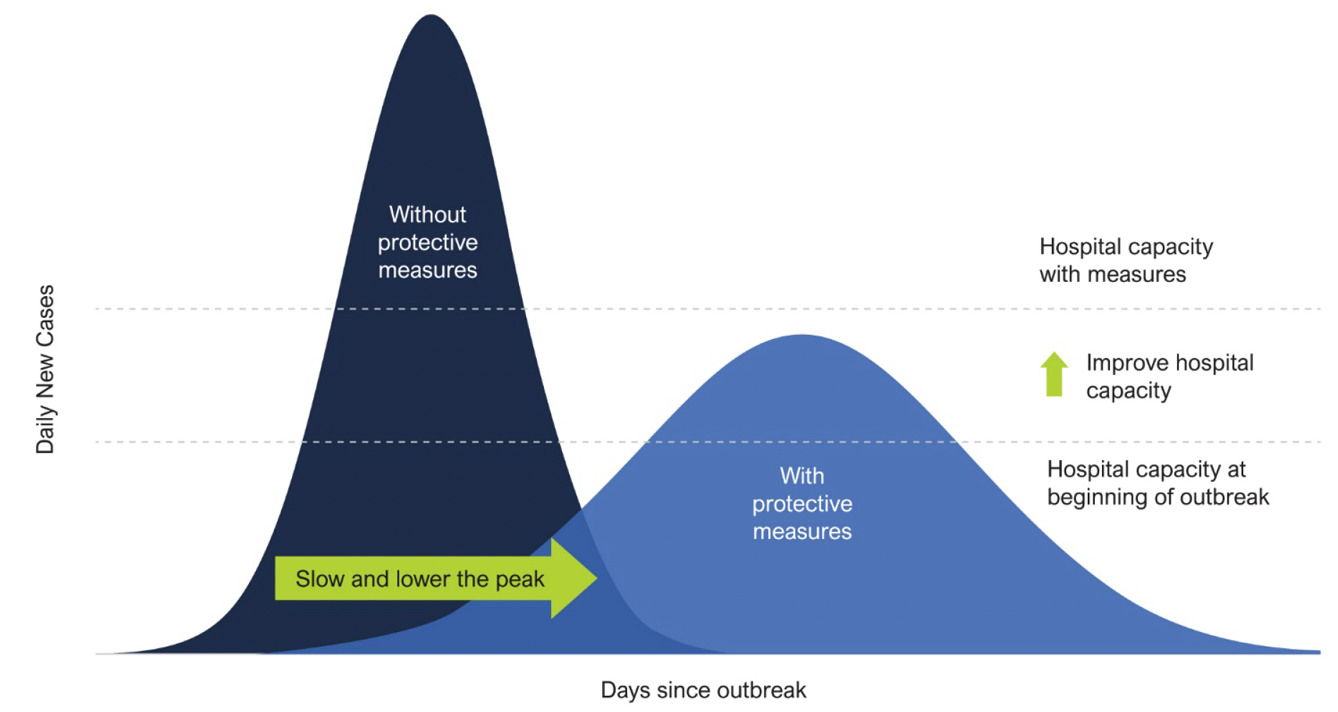
Without any actions to limit the spread of COVID-19 in Ontario, the virus would have resulted in a sharp rise in the demand for hospital services with the potential to overwhelm the health care system. As a result, the Province announced strict measures to slow the spread of the virus and reduce the peak number of infections, thereby reducing hospital demand. At the same time, the government increased health sector funding and took other measures to increase hospital capacity and availability.
Figure 4-1 Goal of Government Measures on COVID-19 Infection and Hospital Capacity
Measures to Limit the Spread of COVID-19
The Province has undertaken a number of measures to slow the spread of COVID-19. Given the highly infectious nature of the virus, these measures were designed to reduce the number of person-to-person contacts. These measures include:
- On March 12, the Province announced that public schools would be closed for two weeks after March break and, on the following day, the government limited visitors to long-term care homes and prohibited gatherings over 250 people.
- On March 17, the Province declared a state of emergency and closed private schools, child care centres, bars, restaurants, theatres and concert venues, prohibited organized public events of over fifty people, and encouraged employers to facilitate work-from-home arrangements.
- On March 23, the Province ordered all non-essential workplaces to close.[16]
- On March 28, the Province prohibited gatherings of more than five people.
- On March 30, the state of emergency was extended to April 14 and expanded to order the closure of all outdoor recreational amenities.
- On April 3, the Province reduced the list of essential workplaces from 74 to 44.
- On April 14, the government extended the state of emergency to May 12.
- On April 15, the government increased testing of staff and residents in long-term care homes, restricted long-term care home staff from working in more than one long-term care home or other health care setting (starting April 22), and redeployed health care staff into long-term care homes.
The federal government also took measures, in coordination with provincial governments, to limit the spread of the outbreak. These measures include restrictions on international travellers and requiring all returning travellers to self-quarantine for 14 days. In addition, the federal government prohibited the boarding of airlines and trains by any individuals showing COVID-19 symptoms.
Measures to Increase Health Sector Capacity and Availability
In addition to measures intended to limit the spread of the COVID-19 outbreak, the Ontario government undertook a number of measures starting in mid-March to expand health sector capacity and increase the availability of existing resources. These measures included the cancellation of elective surgeries and other non-urgent clinical activity, the expansion of the number of acute and critical care beds, relocating 1,000 hospital patients to alternative settings, and the deployment of ventilators from the provincial stockpile.
Financially, the Province announced an additional $3.3 billion in funding for the health sector in 2020-21, compared to the 2020-21 outlook in the 2019 Ontario Budget. As a result of this additional funding, health sector spending is projected to increase by 5.4 per cent in 2020-21, the largest year-over-year per cent increase since 2009-10. Of the $3.3 billion in new funding, $2.1 billion is directed to the COVID-19 response. The remaining $1.2 billion is to address underlying health sector demand pressures which existed prior to the COVID-19 outbreak.
Of the $3.3 billion health sector funding increase in 2020-21:
- $1.1 billion is to fund COVID-19 measures, including:
- $341 million for an additional 1,500 acute care beds (including 500 critical care beds), and more assessment centres;
- $243 million to long-term care homes to support infection control, provide COVID-related supplies and increase screening;
- $120 million to increase home and community care capacity;
- $85 million in additional funding for public health agencies (in addition to the reversal of a previous funding cut described below);
- $75 million for additional personal protective equipment;
- $61 million for physician services in assessment centres and health human resources, including enhanced physician services in remote communities; and
- $59 million for virtual doctor consultations and Telehealth.
- $1.0 billion is for a COVID-19 health contingency fund that is available to be allocated in 2020-21.
- $1.2 billion is to address underlying pressures in the health sector unrelated to COVID-19, including:
- $594 million to address existing cost pressures in hospitals and an updated projection for hospital spending;
- $200 million in additional funding for OHIP payments to physicians to address higher than previously forecasted demand for services;
- $114 million to reverse the planned reduction in public health spending announced in the 2019 Ontario Budget;[17]
- $92 million to address existing pressures and fund minor capital projects in long-term care homes;
- $61 million in funding for immunization programs; and
- $34 million to support the Canadian Blood Services and increase the availability of blood products.
Impact of Measures on Hospital Bed Availability
As previously discussed, prior to the COVID-19 outbreak, Ontario had a low number of hospital beds and a high occupancy rate compared to similar jurisdictions. The FAO estimates that, prior to the COVID-19 outbreak, the Province had only 906 acute care beds, 357 critical care beds, and 356 critical care beds with ventilators that were unoccupied.
After the onset of the COVID-19 outbreak, the measures taken by the Province and Ontario hospitals led to a significant increase in available beds for COVID-19 patients. The FAO estimates that the Province’s hospitals made available an additional 9,349 acute care beds, 2,077 critical care beds and 2,075 critical care beds with ventilators. In Figure 4‑2, the FAO provides estimates of the number of available beds before and after measures taken by the Province.
| Acute Care Beds | Critical Care Beds | Critical Care Beds with Ventilators | |
| Available Beds Prior to the COVID-19 Outbreak | |||
| Total beds | 22,358 | 2,012 | 1,319 |
| Occupied beds | 21,452 | 1,655 | 963 |
| Total Available Beds Prior to the COVID-19 Outbreak | 906 | 357 | 356 |
| Measures to Increase Bed Availability for COVID-19 Patients | |||
| Cancelling elective surgeries and other measures taken by hospitals to free-up existing capacity | 6,849 | 585 | 583 |
| Moving hospital patients to alternative places of care | 1,000 | ||
| New funded beds | 1,500 | 500 | |
| Other expansion of critical care capacity | 992 | ||
| Deployment of additional ventilators | 1,492 | ||
| Total Additional Beds Made Available | 9,349 | 2,077 | 2,075 |
| Total Beds Available for COVID-19 Patients as of April 14 | 10,255 | 2,434 | 2,431 |
Prior to the outbreak, 96 per cent of the 22,358 acute care beds were occupied leaving 906 beds available for COVID-19 patients. On March 15, hospitals took measures to increase the availability of acute care beds, such as cancelling elective surgeries, which is estimated to have opened 6,849 acute care bed spaces. In addition, the Province announced the funding of 1,500 new acute care beds (which includes 500 critical care beds) and the transfer of 1,000 hospital patients to alternative settings. As a result of these measures, the FAO estimates that by April 14, 10,255 acute care bed spaces were available for COVID-19 patients.
Similarly, prior to the COVID-19 outbreak, an estimated 357 critical care beds were unoccupied out of a total of about 2,012 beds. The FAO estimates that cancelling elective surgeries and other measures taken by hospitals opened up 585 critical care spaces. In addition, the Province provided new funding for an additional 500 critical care beds and hospitals deployed 992 critical care beds from other sources. As a result, the FAO estimates that 2,434 critical care beds were available for COVID-19 patients as of April 14.
Finally, at the beginning of the COVID-19 outbreak, the Province had 1,319 critical care beds with ventilators, of which approximately 356 were unoccupied. The FAO estimates that the cancellation of elective surgeries and other measures taken by hospitals opened 583 critical care beds with ventilators. Furthermore, the Province deployed 1,492 additional ventilators, of which 200 were from its stockpile, 600 were procured and approximately 700 were from other sources. Consequently, by April 14, the FAO estimates that 2,431 critical care beds with ventilators were available for COVID-19 patients.
5. Impact of the COVID-19 Outbreak on Hospital Capacity
Outbreak in Ontario
As of April 23, 2020, a total of 13,519 people had tested positive for COVID-19 in Ontario, of which 7,087 have recovered (i.e., resolved), 763 have died and 5,669 cases remain active.[18]
It is important to note when analyzing trends of COVID-19 cases in Ontario over time that the identification of new cases and active cases depends on the number of individuals tested by the Province. Identified cases likely only represent a small proportion of infected individuals[19] and changes in testing guidelines make day to day case numbers not directly comparable.
When the Province declared a state of emergency on March 17, there were 189 confirmed COVID-19 cases in Ontario and the number of cases was increasing by approximately 30 per day. The incubation period of COVID-19 is up to 14 days; therefore, it would take up to two weeks to see the effect of the containment measures on the spread of the virus. Over the two weeks following the state of emergency declaration, the number of daily new cases grew rapidly to over 400 new cases per day at the beginning of April. At that time, the effect of the containment measures began to manifest, and the growth rate of new cases as a share of total cases began to decline.
On April 10, the Province announced a plan to increase testing to 14,000 tests per day by April 29, up from an average of 4,300 tests per day from April 1 to April 12.[20] As of April 23, the Province was processing approximately 12,000 tests per day and the higher testing level is targeted towards priority groups such as health care workers and long-term care home residents. Currently, new COVID-19 cases are increasing by approximately 600 per day, however, a growing proportion of new confirmed cases in Ontario are associated with outbreaks in long-term care homes. The FAO estimates that between April 13 and 23, over 30 per cent of new cases in Ontario were from long-term care homes. Overall, the growth rate of cases in Ontario has lowered steadily throughout the month of April despite the increase in testing. However, the reduction in the growth rate of COVID-19 cases in the community is being offset by increasing growth in cases from congregate settings such as long-term care homes.
Looking ahead, the growth of new COVID-19 cases in Ontario remains uncertain and is heavily dependent on the number of individuals tested and the success of the ongoing measures being taken to prevent the spread of the virus.
Figure 5-1 New COVID-19 Cases per day in Ontario and Growth Rate of COVID-19 Cases
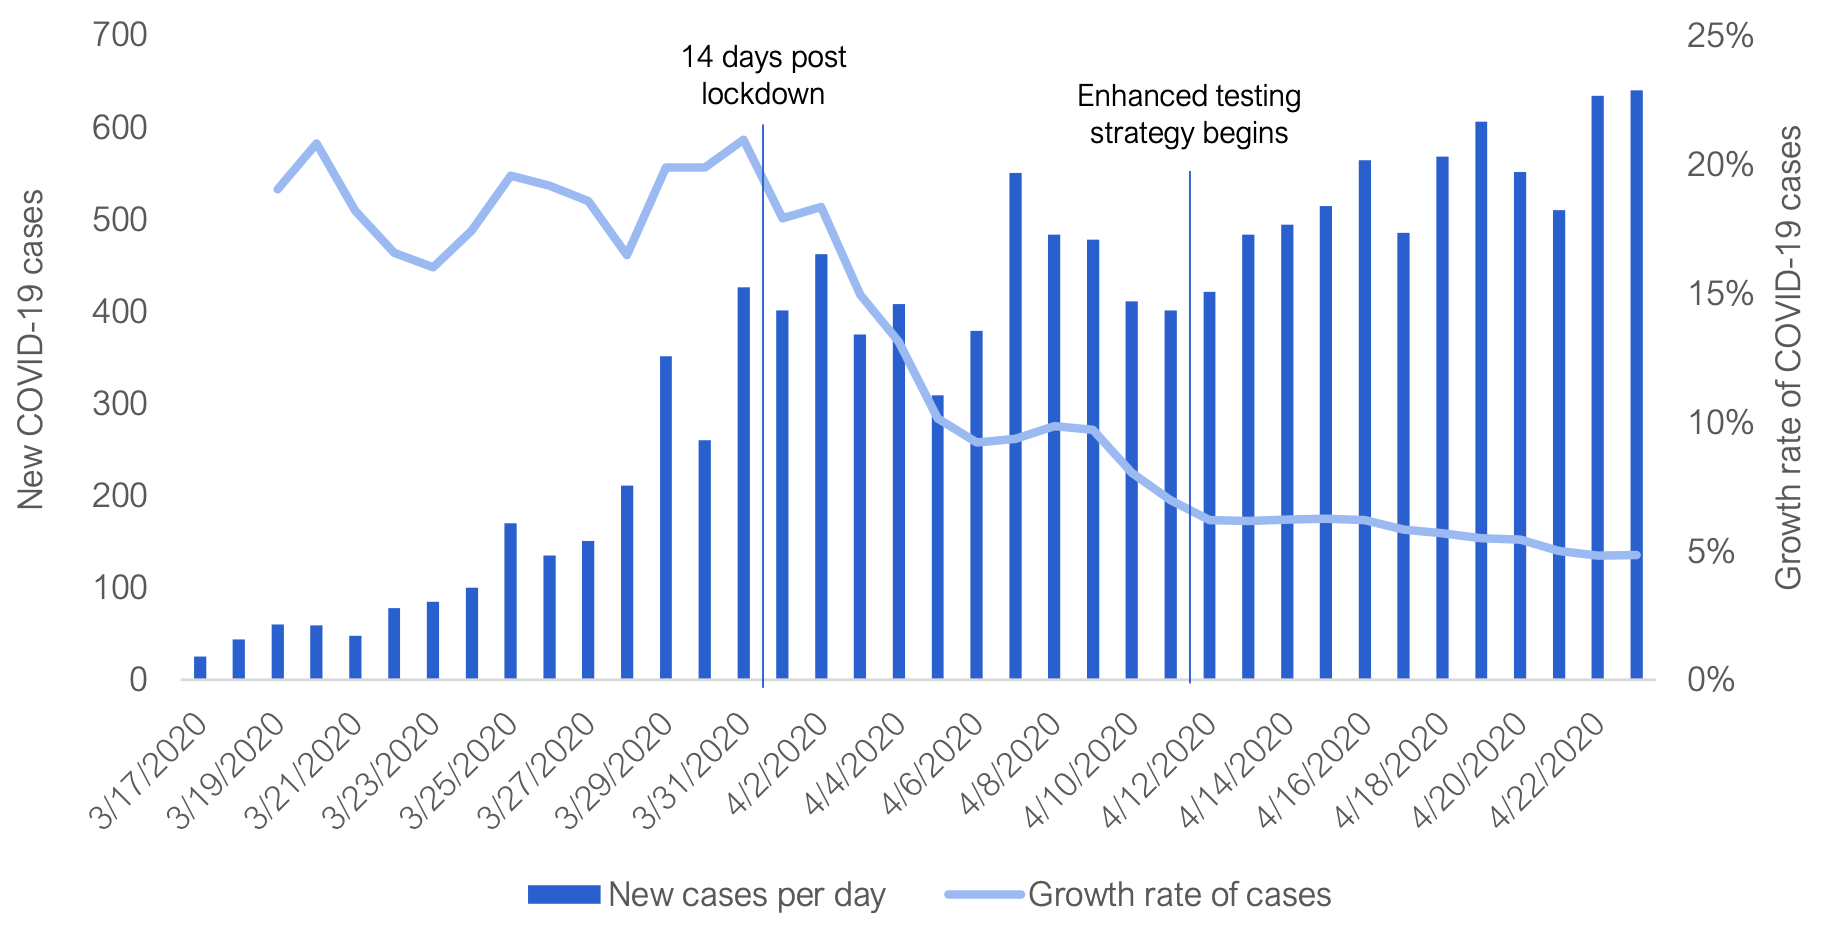
Note: Growth of new cases is a 3-day average and represents new cases as a share of total existing cases.
Source: Government of Ontario daily COVID-19 status updates and FAO.
The following chart outlines how the status of confirmed COVID-19 cases in Ontario has evolved over time. Cases are considered active if the case has not yet been classified as resolved or fatal. Non-fatal cases are classified as resolved 14 days after the onset of symptoms provided that the case is not listed as hospitalized.[21] As of April 23, there have been a total of 13,519 confirmed COVID-19 cases in Ontario. Of those cases, 5,669 remain active, 7,087 have been resolved and there have been 763 fatalities.
The number of active cases grew at approximately 16 per cent per day over the two weeks following the state of emergency declaration. Since that time, the number of active cases has continued to increase, however, the growth rate of active cases has declined due to slower growth of new cases and increasing numbers of daily recoveries. Ontario has yet to see a decline in the total number of active cases and as of April 23, active cases are increasing by approximately 150-200 per day as new confirmed cases continue to outpace new recoveries.
Figure 5-2 Ontario COVID-19 Cases by Status
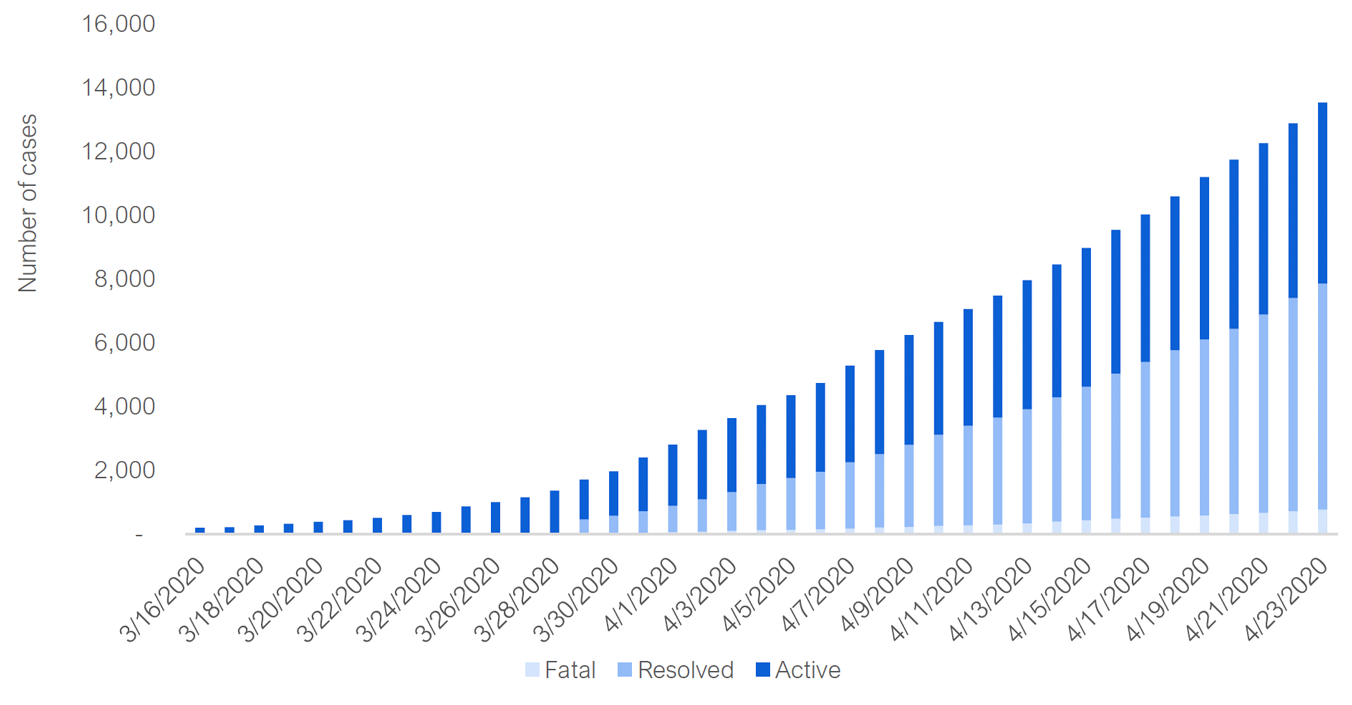
Source: Government of Ontario daily COVID-19 status updates and FAO.
Approximately 12 per cent of confirmed COVID-19 cases in Ontario have required hospitalization and 3 per cent of cases have been severe enough to require admission to critical care. The number of hospitalizations is less subject to testing bias as severe cases are more likely to be identified. Therefore, trends in hospitalizations can provide a slightly better indication of the progression of the virus than the number of new or active cases.
The Province began providing daily reporting on COVID-19 related hospitalizations on March 28. At that time there were an estimated 168 COVID-19 patients in hospital, 92 of which were occupying a critical care space.
Ontario experienced steady growth in the number of hospitalized COVID-19 patients from March 28 to April 17, at which point the Province saw its first day over day decline in hospitalizations. Beginning April 20, total hospitalizations began to rise again and, as of April 23, there were 910 hospitalized COVID-19 patients. The recent increase in hospitalizations may be the result of COVID-19 outbreaks in long-term care homes, with reports that hospitals are starting to admit long-term care residents.[22]
Despite the recent growth in overall hospitalizations, the peak number of patients in critical care to date was on April 8 at 264. As of April 23, there were 243 COVID-19 patients in critical care.
Figure 5-3 Hospitalized COVID-19 Patients by Day
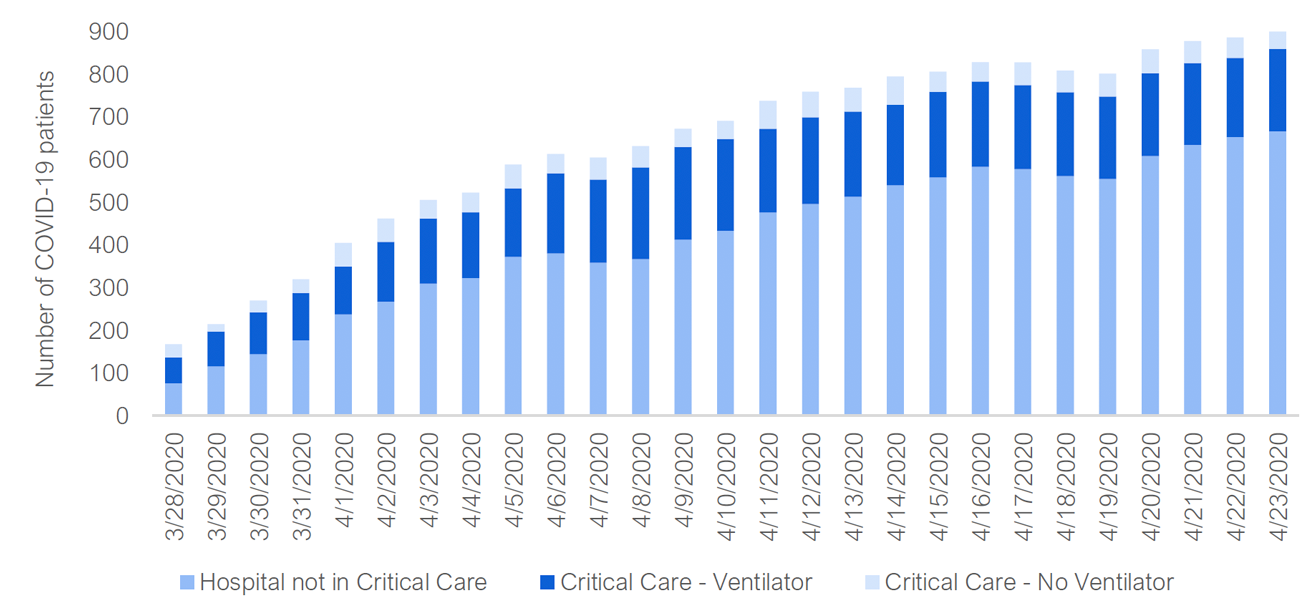
Source: Critical Care Services Ontario Daily Reports and FAO.
Effect of COVID-19 on Hospital Capacity
The COVID-19 pandemic has placed significant strain on health sector resources in many parts of the world and presented the risk that the Ontario hospital system could become overwhelmed with COVID-19 patients. Within hospitals, critical care spaces, particularly spaces equipped with a ventilator, are the primary resource constraint.
In chapter 4, the FAO outlined the measures taken by the Province to expand health sector capacity and availability, with a focus on hospital acute and critical care beds. To date, the actions taken by the Province have provided sufficient availability to accommodate COVID-19 patients requiring hospitalization.
As noted in chapter 4, prior to the outbreak of COVID-19, the Province had only 906 acute care beds, 357 critical care beds and 356 critical care beds with ventilators available for COVID-19 patients. As of April 14, availability for COVID-19 patients had increased to 10,255 acute care beds, 2,434 critical care beds and 2,431 critical care beds with ventilators.
The significant increase in available critical care capacity has occurred due to a combination of lower numbers of non-COVID-19 patients occupying critical care spaces and the deployment of 1,500 additional ventilated beds. From March 28 to April 23 the total number of unoccupied critical care spaces in Ontario increased from 478 to over 2,100. Over that same time period the peak number of COVID-19 patients in critical care was 264.
Figure 5-4 Critical Care Capacity: Occupied and Available
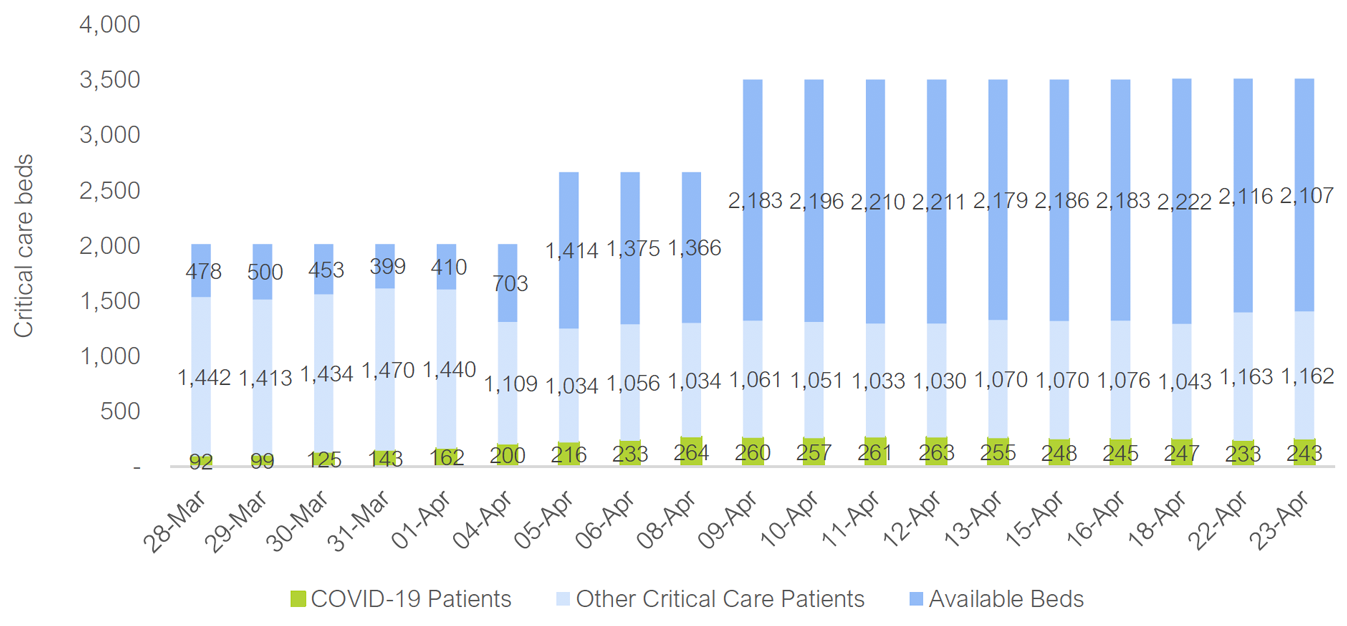
Source: Critical Care Services Ontario Daily Reports.
In the most serious cases of COVID-19, patients require mechanical assistance to breathe and must be placed on a ventilator. Approximately two-thirds of COVID-19 patients admitted to critical care in Ontario have been placed on a ventilator. To date, the peak number of ventilated patients was 217 on April 9. At that time there were close to 2,000 ventilated beds available for COVID-19 patients. As of April 23, about 80 per cent of Ontario’s ventilated beds were available.
Figure 5-5 Available and Occupied Ventilator Capacity
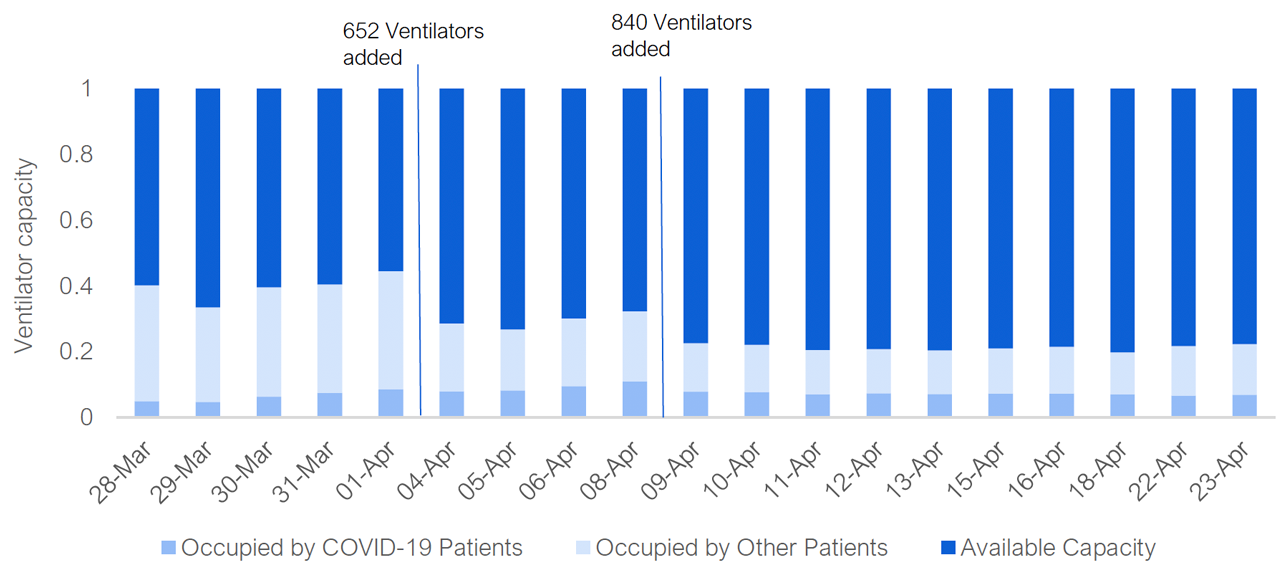
Source: Critical Care Services Ontario Daily Reports.
Note: Suspected COVID-19 patients on ventilators are not reported separately and therefore are included in the Other Patients category.
Summary
From April 17 to April 19, the total number of hospitalized COVID-19 patients began to decline, only to begin to increase again, starting April 20, likely due to the growing COVID-19 outbreak in long-term care homes. As of April 23, there were 910 hospitalized COVID-19 patients, of which 243 required critical care. Despite the recent growth in hospitalizations, the Province has a significant amount of remaining available capacity to accommodate COVID-19 hospitalizations. As of April 23, there were approximately 9,345 unoccupied acute care and 2,191 unoccupied critical care beds.
| Acute Care | Critical Care | Critical Care with Ventilator | |
|---|---|---|---|
| Total Beds Available | 10,255 | 2,434 | 2,431 |
| Available Beds Used by COVID-19 Patients | 910 | 243 | 193 |
| Remaining Beds Available | 9,345 | 2,191 | 2,238 |
It is important to note that although there is currently adequate hospital capacity for COVID-19 patients, there have been regions of the Province that experienced excess demand for critical care. For example, prior to the deployment of additional ventilators by the Province, the Central West Local Health Integration Network (LHIN) was reported to be over capacity of ventilated patients.[23] The deployment of additional ventilators to the region increased the stock of ventilated beds from 26 to 105 which has been sufficient to accommodate the maximum of 37 vented patients in the Central West LHIN to date.
Timing of Emergency Measures: Scenario Analysis
In chapter 4, the FAO identified the measures introduced by the Province to slow and limit the spread of COVID-19. This section highlights how the timing of those measures may have affected COVID-19 hospitalizations.
Spread Compared to Other Jurisdictions
The following chart compares the growth of COVID-19 cases per 100,000 population in Ontario against other selected jurisdictions that declared a state of emergency prior to Ontario. When Ontario declared a state of emergency there were approximately 1.5 cases per 100,000 population in the province. This can be compared to 14 cases per 100,000 in Spain, 15 cases per 100,000 in Italy and just 1.2 cases per 100,000 in South Korea.[24]
There are many factors that influence the spread of COVID-19. However, it appears that the relatively early implementation of lockdown measures in Ontario has contributed to avoiding the much worse outcomes that occurred in Spain and Italy. Conversely, the growth in cases in Ontario has been higher than what has occurred in South Korea. South Korea acted to raise its virus alert to the highest level at one COVID-19 case per 100,000 population, similar to the timing in Ontario. However, South Korea also used a very successful strategy to contain the spread of COVID-19 using mass testing and contact tracing.
Figure 5-7 Number of COVID-19 cases per 100,000 population
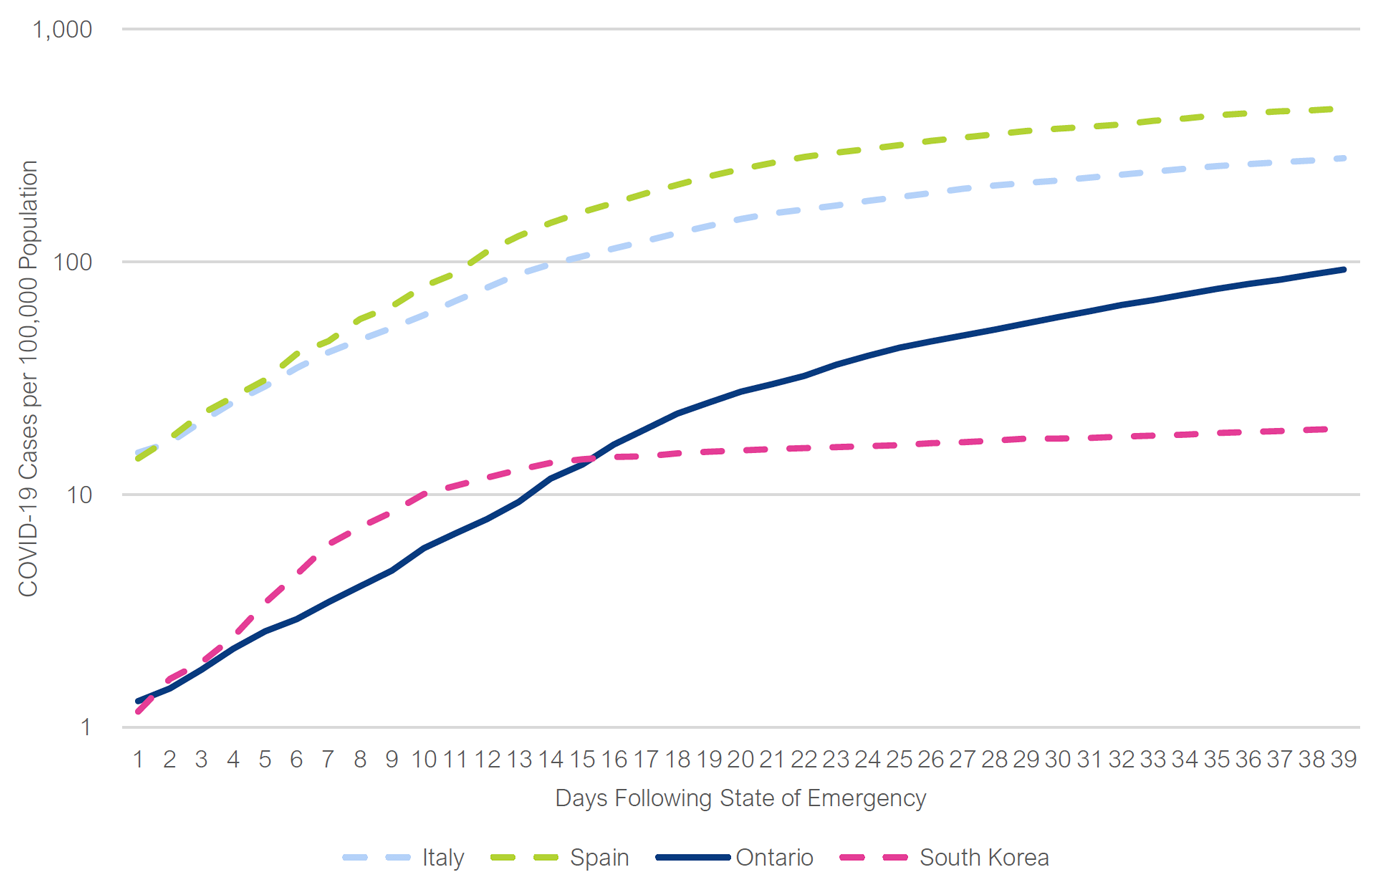
Note: For South Korea, the FAO considers the country raising its virus alert level to the highest level on February 23rd as the comparable action to declaring a state of emergency.
Source: Johns Hopkins University Center for Systems Science and Engineering and Government of Ontario.
Delayed Lockdown Scenario
To illustrate the effect of early implementation of the state of emergency measures in Ontario, the FAO analyzed the potential impact on Ontario’s critical care available capacity if the lockdown measures to limit the spread of the COVID-19 virus beginning on March 17 had been implemented five days later. Under this scenario, the number of concurrent COVID-19 critical care patients to date would have been over 1,100, over four times greater than what has occurred as of April 23. However, the Province would still have had sufficient critical care beds as a result of the expansion of critical care capacity.
Figure 5-8 Scenario – COVID-19 Patients in Critical Care Against Available Capacity if Lockdown Had Occurred Five Days Later
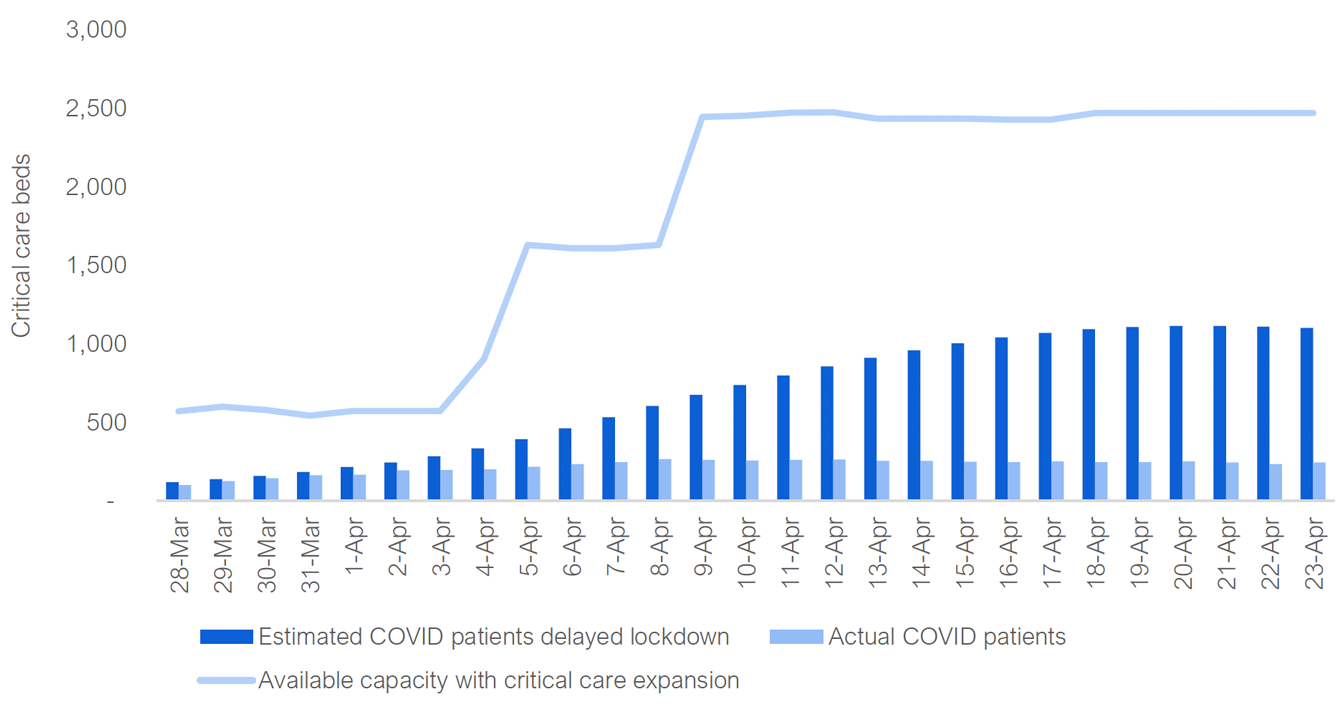
Source: Critical Care Services Ontario and FAO.
Reallocation of Health Sector Resources to Vulnerable Areas
On April 20, the Province released modeling data which indicated that the spread of COVID-19 in the community may have peaked and that hospitals have enough available capacity to handle the projected case load in the near future. However, the Province also indicated that the spread of COVID-19 is continuing to grow in congregate settings such as long-term care (LTC) homes and retirement homes. As of April 23, at least 30 per cent of new reported cases are the result of testing LTC residents and staff. As of the writing of this report, the primary focus of the Province’s COVID-19 response now involves redirecting resources to manage the growing outbreak in vulnerable populations such as LTC residents.
Elderly individuals face a much higher risk of developing serious complications from COVID-19. Most LTC home residents in Ontario are over the age of 75 and live with conditions that have compromised their health. The age of the residents in combination with the congregate living conditions mean that LTC residents are a high-risk population for COVID-19.
Over 60 per cent of the fatal COVID-19 cases in Ontario have resulted from outbreaks in the Province’s long-term care homes. As of April 23, Ontario’s 626 long-term care homes have had 143 outbreaks and are the source of 3,085 of Ontario’s 13,519 confirmed COVID-19 cases.
Figure 5-9 Fatal COVID-19 Cases from Long-Term Care Homes
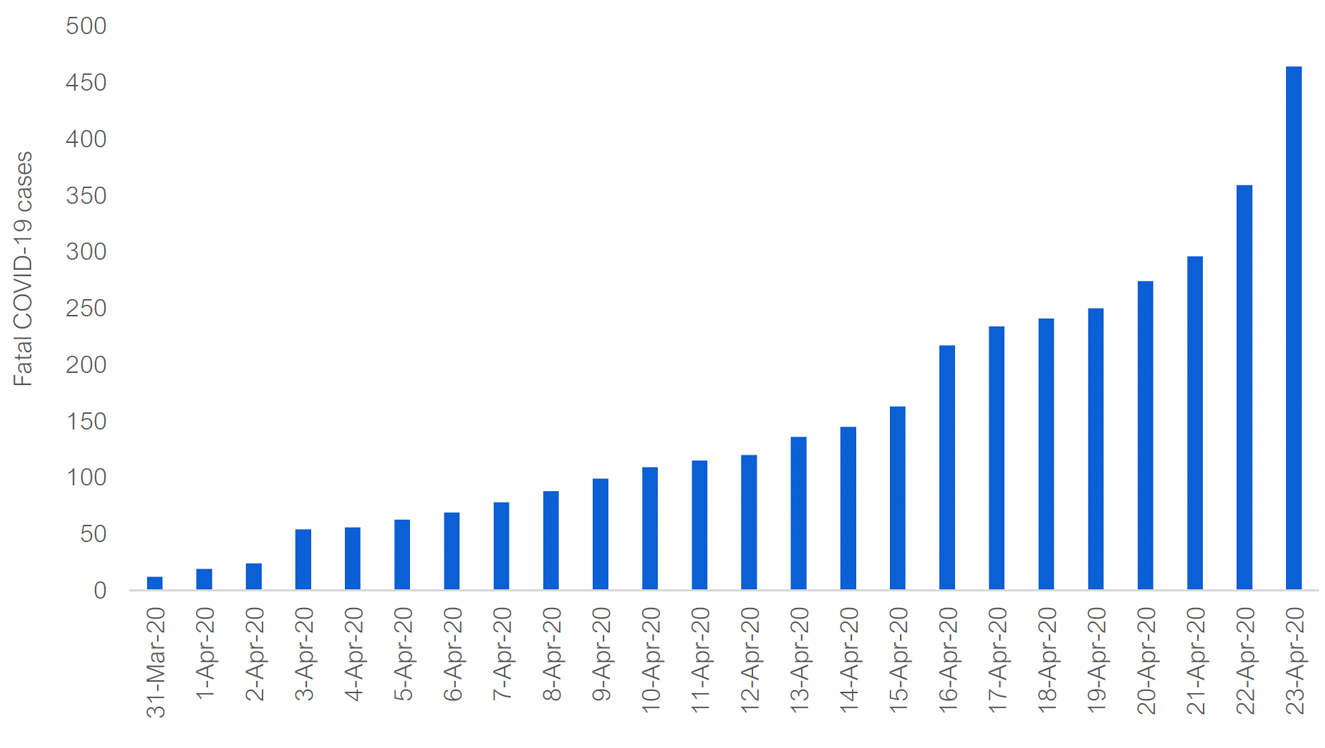
Source: Ontario daily COVID-19 epidemiological summaries.
Note: This chart displays data from the integrated Public Health Information System (iPHIS) database. The Province has indicated that there may be a delay in reporting deaths in iPHIS.
On April 15, the Province announced new measures to address the spread of COVID-19 in long-term care homes, including:
- Providing public health and infection control expertise, including additional training for long-term care home staff working in outbreak conditions;
- Limiting staff to work in only one long-term care home (effective April 22);
- Redeploying staff from hospitals and home and community care to long-term care homes to respond to outbreaks, in addition to on-going recruitment; and
- Increasing testing in long-term care homes and other congregate living centres such as homeless shelters, retirement homes and prisons.
Additionally, it has been reported that some long-term care homes have begun to transfer residents to local hospitals, thereby utilizing unoccupied hospital beds.[25] This may allow long-term care homes to better isolate their remaining residents and more effectively attempt to control the COVID-19 outbreak.
6. Key Questions for MPPs
To date, the measures to increase the available capacity of hospital beds and limit the spread of COVID-19 in Ontario have allowed Ontario hospitals to accommodate the surge of COVID-19 patients. However, going forward, the spread of the virus and the impact on hospital capacity remains uncertain and will be influenced by the actions taken by the Province to lift the containment measures and resume normal operations in the economy and the health sector. To support MPPs’ review of the Province’s actions, the FAO has identified the following key questions that MPPs may wish to ask the government. For each question, the FAO provides additional information to provide context.
What are the conditions required to lift the containment measures?
Experts have suggested that the criteria for easing containment should be based on a combination of:[26]
- Reducing the number of new cases: experts have suggested that 14 days of sustained decreases in the number of new cases would confirm that the virus is coming under control. In addition, the number of new infections per day must be manageable given the capacity of health authorities (see below).
- The capacity of hospitals to treat COVID-19 and non-COVID-19 cases: even with a decreasing rate of new cases, hospitals must have the capacity to treat existing COVID-19 cases and conduct normal procedures (i.e., elective surgeries) before measures can be lifted.
- The capacity of public health agencies to test and conduct contact tracing: the rate of new cases must be within the capacity of public health agencies to investigate, isolate and trace the contacts of new cases.
Since the growth rate of new cases in Ontario is declining and other countries have published their plans to lift lockdown measures, MPPs may wish to ask the government what will be the appropriate conditions to start relaxing the COVID-19 pandemic containment measures?
How will the containment measures be lifted?
Countries that are starting to ease the lockdown have indicated that measures will be slowly eased rather than lifted entirely to ensure the virus remains supressed. The following describes how some countries are easing their lockdown measures:[27]
- Staggered opening of select businesses and public venues: countries are allowing some stores and other venues to slowly reopen. The selection of places that could reopen depends on their importance to society and the extent that people can maintain physical distancing in these locations (see Figure 6‑1). Places that could be reopened include hardware and other large stores, parks and trails. Smaller and tighter venues such as bars, restaurants, coffee shops, stadiums and theatres could remain closed for longer since people are not able to maintain physical distance. Some countries have indicated that schools will reopen.
- Maintain physical distancing rules, limit size of gatherings and promote personal hygiene measures: countries have indicated that the public will continue to be expected to maintain physical distancing, wear facemasks in public and carefully wash their hands, and be prohibited from gathering in large groups.
- Protect at risk groups: at risk groups, such as the elderly or those with compromised immune systems, may be asked to remain in isolation until the infection risk is further lowered.
- Change in lifestyle: to promote physical distancing, schools and workplaces may operate on separate or staggered schedules. The occupancy limits of venues may need to be decreased and public transit vehicle capacity may need to be reduced to allow people to maintain physical distancing.
MPPs may wish to ask the government how the containment measures will be relaxed and under what timeframe?
Figure 6‑1 Estimated Physical Distance by Location Compared to Two Metre Physical Distancing Requirement
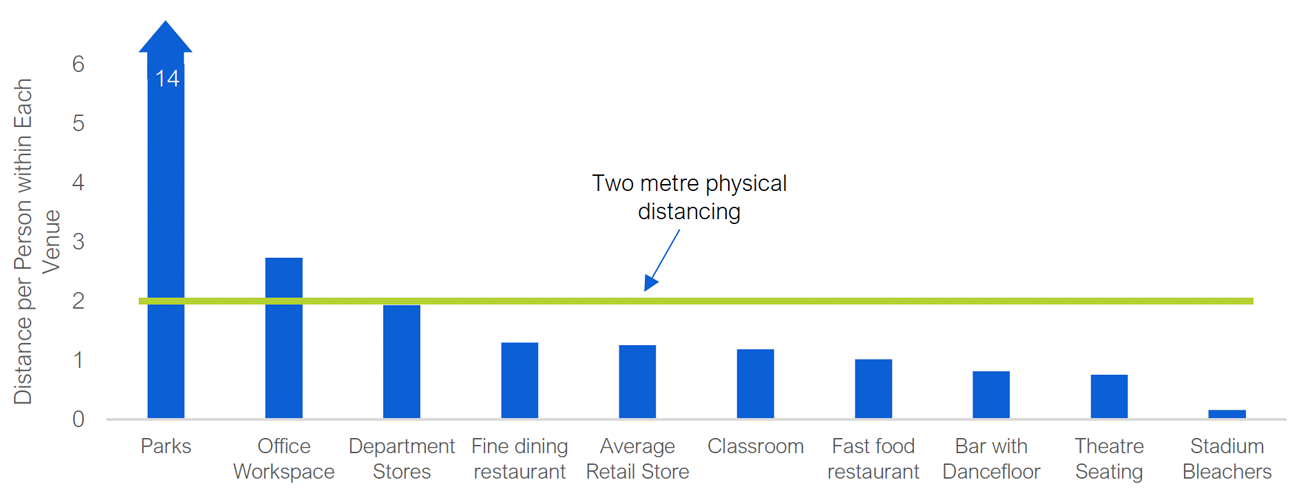
Note: Estimates are based on regulatory occupancy limits, average daily visitor counts or industry rules-of-thumb. These calculations assume that venues do not change occupancy limits to enable physical distancing. Distance per person represents the square root of the average or maximum space per person for each venue, measured in square metres.
Source: FAO estimates.
What preparations is the government making to ensure that COVID-19 continues to be contained?
Since fully eradicating the virus is unlikely without a vaccine, the government will need to undertake measures to ensure that the virus continues to be contained. Based on the examples of other countries, the two key requirements to contain COVID-19 while avoiding a full lockdown are mass testing capacities and an effective strategy to identify, isolate and trace the contacts of COVID-19 infected individuals.
Mass Testing
As of April 24, Ontario is conducting approximately 12,300 tests per day or 84 tests per 100,000 population. The Province currently limits tests to symptomatic hospital patients, all long-term care home residents, and workers in health care, long-term care and first-responders.[28]
The Province has set a target of 14,000 test per day (95 tests per 100,000 population) by April 29,[29] but this remains below the targets of other countries. By comparison, Germany is developing capacity to test roughly 200,000 per day[30] (241 per 100,000 population), the United Kingdom is targeting 100,000 per day (151 per 100,000 population), [31] and France is targeting approximately 70,000 per day (107 per 100,000).[32] Higher testing capacity in Ontario would allow public health officials to expand the testing guidelines to capture the broader population which would help identify and contain the virus.
MPPs may wish to ask the government for an update on its testing strategy and how testing fits into its broader COVID-19 containment strategy.
Surveillance and Contact Tracing
Local health units are responsible for risk assessment, surveillance, case-finding, contact tracing, immunization, and infection control. The total budget of local health units in Ontario was $923 million in 2018, slightly lower than its peak of $936 million in 2015.[33] In the March 2020 Ontario Economic and Fiscal Update, the Province increased public health funding by $85 million in 2020-21[34] and reversed a planned funding cut of $114 million.
To contain COVID-19, the Province will need to ensure that local health units have the capacity to undertake effective surveillance and contact tracing. To date, local health units have been unable to investigate all COVID-19 cases reported in the Province. As of April 22, there were 12,245 reported cases in Ontario and the origins of only 40 per cent of those cases have been determined.[35]
Outside of Canada, South Korea combined mass testing with an aggressive strategy to trace the contacts of infected cases, employing strategies such as interviews, closed-circuit television systems, smartphone GPS data, and publicizing the movement histories of COVID-19 patients. While effective, South Korea’s strategy has also been criticized for breaching individual privacy.[36]
In other countries, public health agencies are planning to significantly expand contact tracing teams to contain the virus. In the United States, experts are calling for 100,000 contact tracers to be enlisted, an increase from the 2,000 on staff currently.[37] Similarly, the United Kingdom is recruiting 18,000 more contact tracers to help ease its lockdown.[38]
MPPs may wish to ask how the government plans to expand the surveillance and contact tracing abilities of public health agencies (e.g., how many new public health staff will be required to trace COVID-19 cases) and how much new funding will be required.
How will Ontario’s health care system return to normal and how much additional funding will be required?
During the outbreak, Ontario hospitals experienced a significant fall in the number of patients as a result of hospitals cancelling elective surgeries and fewer people presenting themselves to hospitals, even when medically necessary.[39]
Elective procedures are often not optional. Rather, elective procedures are not immediately required or, in the judgement of the health professional, riskier to conduct during a crisis than after the crisis.[40] These surgeries include some cancer-related procedures, operations to address blood vessel problems,[41] some cardiac procedures, gall bladder and hernia operations, hip replacements,[42] and cataract surgery and cosmetic surgeries.[43]
In addition, emergency room wait times and waitlists have fallen significantly since the start of the outbreak.[44] While some doctors have indicated lower hospital demand may be partially due to social isolation measures, doctors have also indicated that some people who do require medical attention, due to minor heart attacks or strokes for example, may be avoiding medically necessary hospital visits.[45]
Figure 6-2 Emergency Room Wait Times and Waitlist for Select Ontario Hospitals
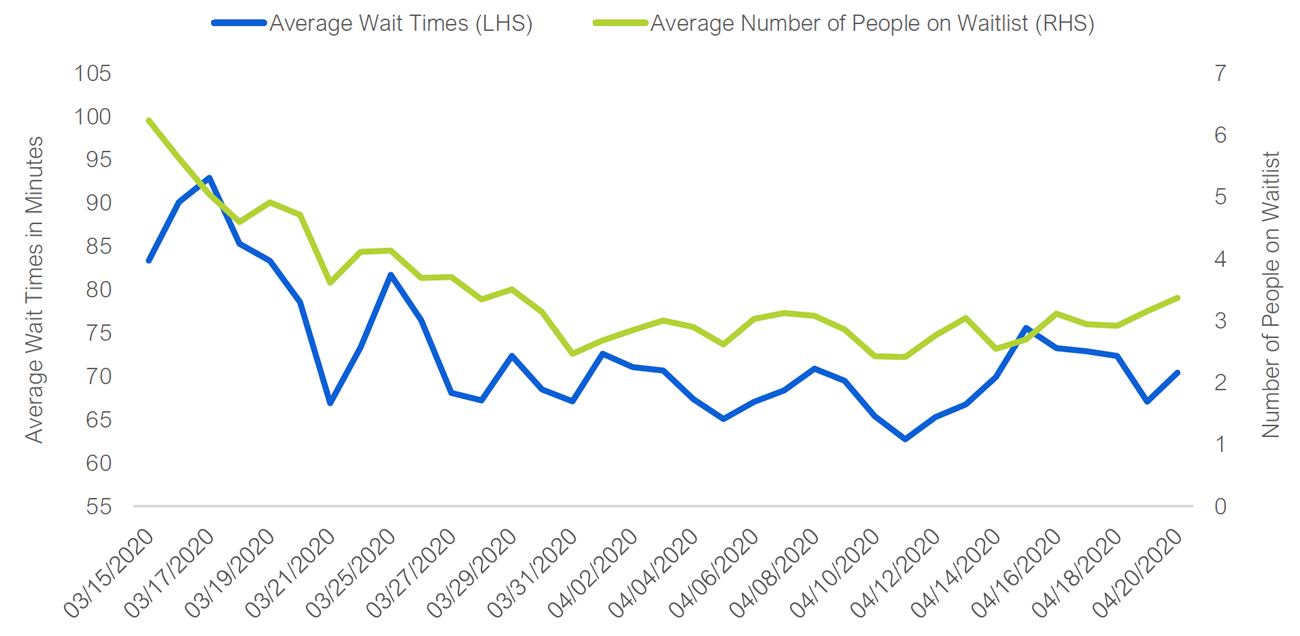
Note: Figures represent a two-day moving average of the wait times and waiting list for select Ontario hospitals only. Wait times represent the weighted average times for St. Catharines General Hospital, Greater Niagara General Hospital, Welland County, Douglas Memorial, Port Colborne, Hamilton General Hospital, Juravinski Hospital and Cancer Centre, St. Joseph’s Healthcare Hamilton, Charlton Campus, West Lincoln Memorial Hospital, Markham Stouffville, Sault Area Hospital, Cambridge Memorial Hospital, Grand River Hospital. Wait list represents the average for St. Catharines, Greater Niagara, Welland, Douglas Memorial, Port Colborne. Waitlist represents the number of patients who have not had an initial assessment by a nurse practitioner or doctor. Wait time refers to the time between being assessed by a triage nurse and seeing a doctor or nurse practitioner.
Sources: Collected from hospitals’ websites. For example, Niagara Health wait times can be found here.
As a result of cancelling elective surgeries and fewer people presenting themselves to hospitals, the occupancy rate for total hospital beds decreased from 96 per cent prior to the outbreak to 69 per cent by April 13, 2020, leaving 11,200 total hospital beds unoccupied.[46] As a result, the FAO estimates that, from March 15, 2020 to April 22, 2020, up to 52,700 procedures have been cancelled or avoided and, every week that the COVID-19 outbreak continues, up to 12,200 more procedures are delayed.[47]
While lower demand for hospital services creates immediate availability of hospital resources for COVID-19 patients, it also will lead to significant demand pressure for hospitals in the longer-term. Since most of the delayed procedures are medically required, the longer procedures are postponed, the worse health outcomes Ontarians could have[48] and the harder it will be for hospitals to eventually clear the backlog of delayed procedures. Furthermore, as previously discussed, the timing of relaxing the COVID-19 lockdown measures will depend on a number of factors, including the capacity of hospitals to conduct normal procedures.
MPPs may wish to ask the government how it plans to address the waitlist for elective surgery created by the COVID-19 pandemic and how much additional funding will be allocated to the health sector to clear the backlog of elective surgeries and return hospitals to a normal state of operations.
7. Appendices
Appendix A: International Comparison of Hospital Capacity and Occupancy
As a share of the population, Ontario has 2.4 total hospital beds per 1,000 residents, which is the eighth lowest jurisdiction among 42 OECD countries. Some of the countries with the lowest beds per 1,000 residents include the United Kingdom (2.5), United States (2.8) and Ireland (3.0). The countries with the highest number of beds per 1,000 residents are Japan (13.1), South Korea (12.3), Russia (8.1) and Germany (8.0).
The number of beds per 1,000 residents is partially linked to demography. Countries with a high rate of beds typically have older populations. For instance, in 2018, the share of people 65 and older was 28 per cent in Japan and 22 per cent in Germany compared to 17 per cent in Ontario and 16 per cent in the United States.[49]
Figure 7‑1 Comparison of Number of Hospital Beds per 1,000 Population Across OECD Countries
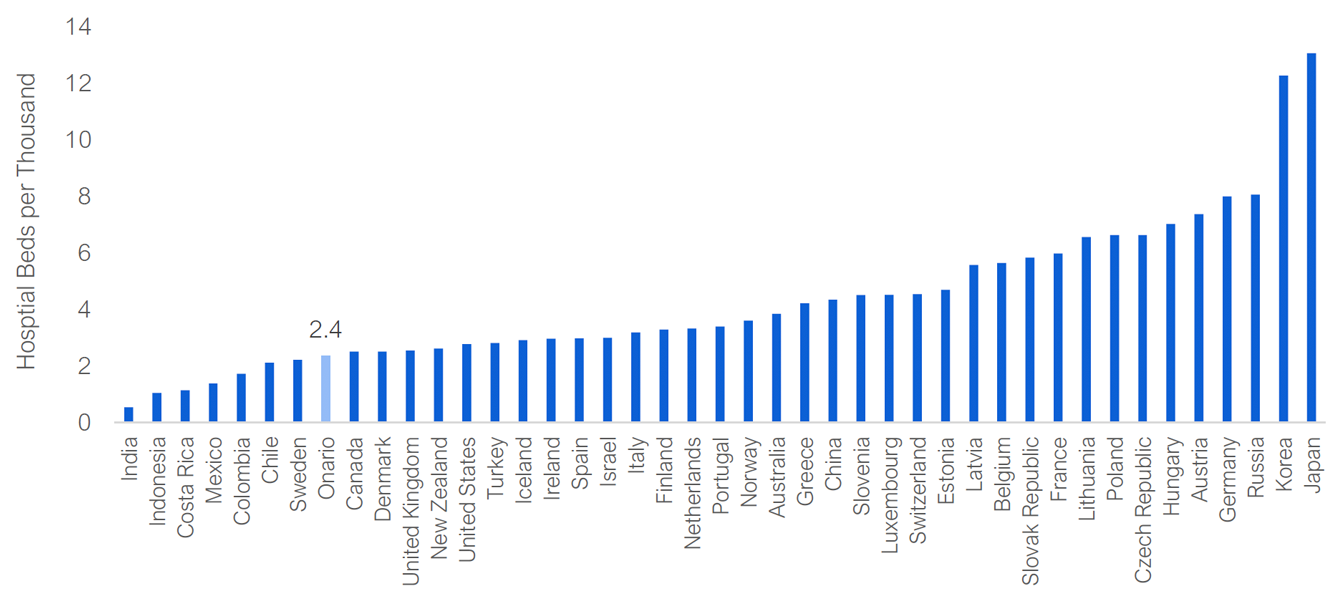
Source: OECD and Ministry of Health.
Ontario’s average total hospital bed occupancy rate, at 96 per cent in 2018-19, is the highest among OECD countries. The next highest occupancy rates in the OECD are Ireland at 95 per cent, Israel at 93 per cent and Canada at 92 per cent.
Figure 7‑2 Comparison of Occupancy Rate of Hospital Beds Across Select OECD Countries
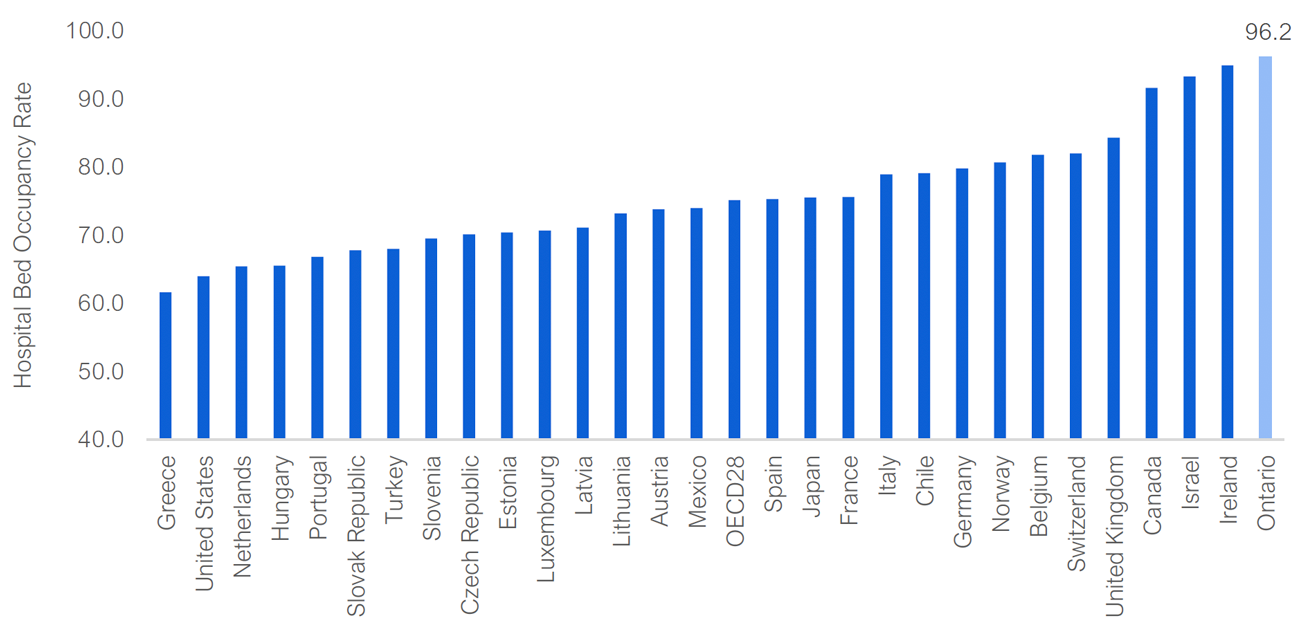
Note: Ontario’s occupancy rate is for 2018-19 while occupancy rates for OECD countries are for 2017 or most recent data.
Source: OECD and Ministry of Health.
| Bed Type | Beds |
|---|---|
| Total Beds | 34,707 |
| Mental Health | 4,630 |
| Special Rehabiliation | 552 |
| General Rehabilitation | 2,051 |
| Chronic Care Beds | 5,115 |
| Acute Care Beds | 22,358 |
| Critical Care Beds | 2,012 |
| Critical Care Beds without Ventilation | 693 |
| Critical Care Beds with Ventilation | 1,319 |
| Days | Number of People Infected |
|---|---|
| 1 | 1 |
| 5 | 2.5 |
| 10 | 6.25 |
| 15 | 15 |
| 20 | 39 |
| 25 | 97 |
| 30 | 244 |
This chart shows the number of expected new cases over the outbreak under two scenarios: without protective measures and with protective measures. In the “without protective measures” scenario, the peak number of infections is high and the duration of the outbreak is short. Since the government aims to slow and lower the peak, the “with protective measures” scenario shows a relatively lower peak and the outbreak spans a longer period of time.
In addition, the chart illustrates the government’s measures to incease hospital capacity. Prior to the outbreak, hospital capacity is below the peaks for both scenarios. At the same time the government is trying to “flatten the curve” of the outbreak, it is also taking steps to increase hospital capacity. As a result, hospital capacity increases to above the peak of the “with protective measures” scenario but still remains below the peak of the “without protective measures” scenario.
| Day | New cases per day | Growth rate of cases |
|---|---|---|
| 17-03-2020 | 25 | |
| 18-03-2020 | 44 | |
| 19-03-2020 | 60 | 19% |
| 20-03-2020 | 59 | 21% |
| 21-03-2020 | 48 | 18% |
| 22-03-2020 | 78 | 17% |
| 23-03-2020 | 85 | 16% |
| 24-03-2020 | 100 | 17% |
| 25-03-2020 | 170 | 20% |
| 26-03-2020 | 135 | 19% |
| 27-03-2020 | 151 | 19% |
| 28-03-2020 | 211 | 16% |
| 29-03-2020 | 351 | 20% |
| 30-03-2020 | 260 | 20% |
| 31-03-2020 | 426 | 21% |
| 01-04-2020 | 401 | 18% |
| 02-04-2020 | 462 | 18% |
| 03-04-2020 | 375 | 15% |
| 04-04-2020 | 408 | 13% |
| 05-04-2020 | 309 | 10% |
| 06-04-2020 | 379 | 9% |
| 07-04-2020 | 550 | 9% |
| 08-04-2020 | 483 | 10% |
| 09-04-2020 | 478 | 10% |
| 10-04-2020 | 411 | 8% |
| 11-04-2020 | 401 | 7% |
| 12-04-2020 | 421 | 6% |
| 13-04-2020 | 483 | 6% |
| 14-04-2020 | 494 | 6% |
| 15-04-2020 | 514 | 6% |
| 16-04-2020 | 564 | 6% |
| 17-04-2020 | 485 | 6% |
| 18-04-2020 | 568 | 6% |
| 19-04-2020 | 606 | 5% |
| 20-04-2020 | 551 | 5% |
| 21-04-2020 | 510 | 5% |
| 22-04-2020 | 634 | 5% |
| 23-04-2020 | 640 | 5% |
| Date | Active | Resolved | Fatal |
|---|---|---|---|
| 2020-03-16 | 183 | 5 | 1 |
| 2020-03-17 | 208 | 5 | 1 |
| 2020-03-18 | 251 | 5 | 2 |
| 2020-03-19 | 311 | 5 | 2 |
| 2020-03-20 | 369 | 6 | 2 |
| 2020-03-21 | 412 | 8 | 5 |
| 2020-03-22 | 489 | 8 | 6 |
| 2020-03-23 | 572 | 8 | 8 |
| 2020-03-24 | 667 | 8 | 13 |
| 2020-03-25 | 835 | 8 | 15 |
| 2020-03-26 | 967 | 8 | 18 |
| 2020-03-27 | 1,117 | 8 | 19 |
| 2020-03-28 | 1,324 | 8 | 23 |
| 2020-03-29 | 1,252 | 431 | 23 |
| 2020-03-30 | 1,399 | 534 | 33 |
| 2020-03-31 | 1,681 | 674 | 37 |
| 2020-04-01 | 1,909 | 831 | 53 |
| 2020-04-02 | 2,165 | 1,023 | 67 |
| 2020-04-03 | 2,317 | 1,219 | 94 |
| 2020-04-04 | 2,470 | 1,449 | 119 |
| 2020-04-05 | 2,591 | 1,624 | 132 |
| 2020-04-06 | 2,771 | 1,802 | 153 |
| 2020-04-07 | 3,028 | 2,074 | 174 |
| 2020-04-08 | 3,254 | 2,305 | 200 |
| 2020-04-09 | 3,441 | 2,574 | 222 |
| 2020-04-10 | 3,537 | 2,858 | 253 |
| 2020-04-11 | 3,654 | 3,121 | 274 |
| 2020-04-12 | 3,822 | 3,357 | 291 |
| 2020-04-13 | 4,051 | 3,568 | 334 |
| 2020-04-14 | 4,160 | 3,902 | 385 |
| 2020-04-15 | 4,344 | 4,194 | 423 |
| 2020-04-16 | 4,491 | 4,556 | 478 |
| 2020-04-17 | 4,621 | 4,875 | 514 |
| 2020-04-18 | 4,816 | 5,209 | 553 |
| 2020-04-19 | 5,085 | 5,515 | 584 |
| 2020-04-20 | 5,307 | 5,806 | 622 |
| 2020-04-21 | 5,365 | 6,221 | 659 |
| 2020-04-22 | 5,486 | 6,680 | 713 |
| 2020-04-23 | 5,669 | 7,087 | 763 |
| Date | Hospital not in Critical Care | Critical Care – Ventilator | Critical Care – No Ventilator |
|---|---|---|---|
| 2020-03-28 | 76 | 61 | 31 |
| 2020-03-29 | 116 | 82 | 17 |
| 2020-03-30 | 145 | 97 | 28 |
| 2020-03-31 | 177 | 111 | 32 |
| 2020-04-01 | 238 | 112 | 55 |
| 2020-04-02 | 268 | 140 | 54 |
| 2020-04-03 | 310 | 152 | 44 |
| 2020-04-04 | 323 | 154 | 46 |
| 2020-04-05 | 373 | 160 | 56 |
| 2020-04-06 | 381 | 187 | 46 |
| 2020-04-07 | 359 | 195 | 51 |
| 2020-04-08 | 368 | 214 | 50 |
| 2020-04-09 | 413 | 217 | 43 |
| 2020-04-10 | 434 | 215 | 42 |
| 2020-04-11 | 477 | 196 | 65 |
| 2020-04-12 | 497 | 203 | 60 |
| 2020-04-13 | 514 | 199 | 56 |
| 2020-04-14 | 541 | 188 | 66 |
| 2020-04-15 | 559 | 200 | 48 |
| 2020-04-16 | 584 | 200 | 45 |
| 2020-04-17 | 578 | 197 | 53 |
| 2020-04-18 | 562 | 196 | 51 |
| 2020-04-19 | 555 | 193 | 54 |
| 2020-04-20 | 609 | 194 | 56 |
| 2020-04-21 | 635 | 192 | 51 |
| 2020-04-22 | 654 | 185 | 48 |
| 2020-04-23 | 667 | 193 | 50 |
| Date | Confirmed COVID | Other Critical Care Patients | Available Beds |
|---|---|---|---|
| 28-Mar | 92 | 1,442 | 478 |
| 29-Mar | 99 | 1,413 | 500 |
| 30-Mar | 125 | 1,434 | 453 |
| 31-Mar | 143 | 1,470 | 399 |
| 01-Apr | 162 | 1,440 | 410 |
| 04-Apr | 200 | 1,109 | 703 |
| 05-Apr | 216 | 1,034 | 1,414 |
| 06-Apr | 233 | 1,056 | 1,375 |
| 08-Apr | 264 | 1,034 | 1,366 |
| 09-Apr | 260 | 1,061 | 2,183 |
| 10-Apr | 257 | 1,051 | 2,196 |
| 11-Apr | 261 | 1,033 | 2,210 |
| 12-Apr | 263 | 1,030 | 2,211 |
| 13-Apr | 255 | 1,070 | 2,179 |
| 15-Apr | 248 | 1,070 | 2,186 |
| 16-Apr | 245 | 1,076 | 2,183 |
| 18-Apr | 247 | 1,043 | 2,222 |
| 22-Apr | 233 | 1,163 | 2,116 |
| 23-Apr | 243 | 1,162 | 2,107 |
| Date | Occupied by COVID-19 Patients | Occupied by Other Patients | Available Capacity |
|---|---|---|---|
| 28-Mar | 5% | 35% | 60% |
| 29-Mar | 5% | 29% | 67% |
| 30-Mar | 6% | 33% | 60% |
| 31-Mar | 7% | 33% | 60% |
| 01-Apr | 8% | 36% | 56% |
| 04-Apr | 8% | 21% | 71% |
| 05-Apr | 8% | 19% | 73% |
| 06-Apr | 9% | 21% | 70% |
| 08-Apr | 11% | 21% | 68% |
| 09-Apr | 8% | 15% | 77% |
| 10-Apr | 8% | 14% | 78% |
| 11-Apr | 7% | 13% | 80% |
| 12-Apr | 7% | 14% | 79% |
| 13-Apr | 7% | 13% | 80% |
| 15-Apr | 7% | 14% | 79% |
| 16-Apr | 7% | 14% | 79% |
| 18-Apr | 7% | 13% | 80% |
| 22-Apr | 7% | 15% | 78% |
| 23-Apr | 7% | 15% | 78% |
| Days Following State of Emergency | Spain | Italy | Ontario | South Korea |
|---|---|---|---|---|
| 1 | 13.6 | 15.2 | 1.3 | 1.2 |
| 2 | 16.6 | 16.8 | 1.5 | 1.6 |
| 3 | 21.2 | 20.6 | 1.8 | 1.9 |
| 4 | 25.0 | 25.0 | 2.2 | 2.4 |
| 5 | 29.6 | 29.2 | 2.6 | 3.4 |
| 6 | 38.3 | 35.0 | 2.9 | 4.5 |
| 7 | 43.5 | 40.9 | 3.5 | 6.1 |
| 8 | 54.1 | 46.3 | 4.0 | 7.3 |
| 9 | 61.3 | 52.1 | 4.7 | 8.4 |
| 10 | 74.9 | 59.0 | 5.9 | 10.1 |
| 11 | 85.0 | 67.8 | 6.8 | 10.9 |
| 12 | 105.5 | 77.7 | 7.8 | 11.8 |
| 13 | 123.1 | 88.6 | 9.3 | 12.8 |
| 14 | 140.0 | 97.8 | 11.7 | 13.7 |
| 15 | 156.0 | 105.7 | 13.5 | 14.2 |
| 16 | 170.7 | 114.4 | 16.4 | 14.5 |
| 17 | 187.4 | 123.0 | 19.2 | 14.6 |
| 18 | 204.4 | 133.2 | 22.3 | 15.1 |
| 19 | 221.8 | 143.0 | 24.9 | 15.3 |
| 20 | 238.7 | 152.9 | 27.7 | 15.5 |
| 21 | 253.9 | 161.5 | 29.8 | 15.7 |
| 22 | 268.8 | 168.2 | 32.4 | 15.9 |
| 23 | 280.5 | 174.9 | 36.2 | 16.0 |
| 24 | 291.2 | 182.8 | 39.5 | 16.2 |
| 25 | 302.4 | 190.5 | 42.8 | 16.3 |
| 26 | 315.8 | 198.1 | 45.6 | 16.6 |
| 27 | 326.4 | 206.1 | 48.4 | 16.8 |
| 28 | 337.2 | 213.2 | 51.3 | 17.1 |
| 29 | 347.3 | 219.2 | 54.6 | 17.4 |
| 30 | 355.4 | 224.2 | 58.0 | 17.4 |
| 31 | 362.4 | 230.5 | 61.5 | 17.6 |
| 32 | 370.8 | 237.5 | 65.4 | 17.8 |
| 33 | 384.9 | 244.0 | 68.7 | 18.0 |
| 34 | 394.0 | 251.8 | 72.6 | 18.1 |
| 35 | 406.6 | 258.5 | 76.7 | 18.4 |
| 36 | 414.2 | 263.8 | 80.5 | 18.6 |
| 37 | 423.3 | 268.6 | 84.0 | 18.8 |
| 38 | 426.5 | 273.1 | 88.4 | 19.0 |
| 39 | 435.0 | 279.3 | 92.8 | 19.2 |
| Date | Estimated COVID patients delayed lockdown | Actual COVID patients | Available capacity with critical care expansion |
|---|---|---|---|
| 28-Mar | 119 | 99 | 570 |
| 29-Mar | 137 | 125 | 599 |
| 30-Mar | 158 | 143 | 578 |
| 31-Mar | 184 | 162 | 542 |
| 01-Apr | 214 | 167 | 572 |
| 02-Apr | 243 | 194 | 572 |
| 03-Apr | 285 | 196 | 572 |
| 04-Apr | 334 | 200 | 903 |
| 05-Apr | 392 | 216 | 1,630 |
| 06-Apr | 461 | 233 | 1,608 |
| 07-Apr | 532 | 246 | 1,608 |
| 08-Apr | 604 | 264 | 1,630 |
| 09-Apr | 673 | 260 | 2,443 |
| 10-Apr | 737 | 257 | 2,453 |
| 11-Apr | 798 | 261 | 2,471 |
| 12-Apr | 856 | 263 | 2,474 |
| 13-Apr | 910 | 255 | 2,434 |
| 14-Apr | 959 | 254 | 2,434 |
| 15-Apr | 1,002 | 248 | 2,434 |
| 16-Apr | 1,039 | 245 | 2,428 |
| 17-Apr | 1,070 | 250 | 2,428 |
| 18-Apr | 1,093 | 247 | 2,469 |
| 19-Apr | 1,107 | 247 | 2,469 |
| 20-Apr | 1,114 | 250 | 2,469 |
| 21-Apr | 1,113 | 243 | 2,469 |
| 22-Apr | 1,109 | 233 | 2,349 |
| 23-Apr | 1,101 | 243 | 2,350 |
| Date | Fatal LTCH cases |
|---|---|
| 31-Mar-20 | 12 |
| 01-Apr-20 | 19 |
| 02-Apr-20 | 24 |
| 03-Apr-20 | 54 |
| 04-Apr-20 | 56 |
| 05-Apr-20 | 63 |
| 06-Apr-20 | 69 |
| 07-Apr-20 | 78 |
| 08-Apr-20 | 88 |
| 09-Apr-20 | 99 |
| 10-Apr-20 | 109 |
| 11-Apr-20 | 115 |
| 12-Apr-20 | 120 |
| 13-Apr-20 | 136 |
| 14-Apr-20 | 145 |
| 15-Apr-20 | 163 |
| 16-Apr-20 | 217 |
| 17-Apr-20 | 234 |
| 18-Apr-20 | 241 |
| 19-Apr-20 | 250 |
| 20-Apr-20 | 274 |
| 21-Apr-20 | 296 |
| 22-Apr-20 | 359 |
| 23-Apr-20 | 464 |
| Maximum Distance per Person | |
|---|---|
| Physical distancing requirement | 2 |
| Parks | 13.6 |
| Office Workspace | 2.7 |
| Department Stores | 1.9 |
| Fine dining restaurant | 1.3 |
| Average Retail Store | 1.2 |
| Classroom | 1.2 |
| Fast food restaurant | 1.0 |
| Bar with Dancefloor | 0.8 |
| Theatre Seating | 0.7 |
| Stadium Bleachers | 0.2 |
| Average Wait Times | Average Number of People on Waitlist | |
|---|---|---|
| 03/15/2020 | 83.4 | 6.2 |
| 03/16/2020 | 90.1 | 5.6 |
| 03/17/2020 | 92.9 | 5.0 |
| 03/18/2020 | 85.3 | 4.6 |
| 03/19/2020 | 83.3 | 4.9 |
| 03/20/2020 | 78.5 | 4.7 |
| 03/21/2020 | 66.9 | 3.6 |
| 03/22/2020 | 73.3 | 4.1 |
| 03/25/2020 | 81.7 | 4.1 |
| 03/26/2020 | 76.5 | 3.7 |
| 03/27/2020 | 68.1 | 3.7 |
| 03/28/2020 | 67.2 | 3.3 |
| 03/29/2020 | 72.3 | 3.5 |
| 03/30/2020 | 68.5 | 3.1 |
| 03/31/2020 | 67.1 | 2.5 |
| 04/01/2020 | 72.6 | 2.7 |
| 04/02/2020 | 71.1 | 2.8 |
| 04/03/2020 | 70.7 | 3.0 |
| 04/04/2020 | 67.4 | 2.9 |
| 04/05/2020 | 65.1 | 2.6 |
| 04/06/2020 | 67.1 | 3.0 |
| 04/07/2020 | 68.4 | 3.1 |
| 04/08/2020 | 70.9 | 3.1 |
| 04/09/2020 | 69.5 | 2.9 |
| 04/10/2020 | 65.4 | 2.4 |
| 04/11/2020 | 62.7 | 2.4 |
| 04/12/2020 | 65.3 | 2.8 |
| 04/13/2020 | 66.8 | 3.0 |
| 04/14/2020 | 69.9 | 2.5 |
| 04/15/2020 | 75.6 | 2.7 |
| 04/16/2020 | 73.2 | 3.1 |
| 04/17/2020 | 72.9 | 2.9 |
| 04/18/2020 | 72.4 | 2.9 |
| 04/19/2020 | 67.1 | 3.2 |
| 04/20/2020 | 70.4 | 3.4 |
| 04/21/2020 | 74.5 | 2.2 |
| Beds Per Thousand | |
|---|---|
| India | 0.5 |
| Indonesia | 1.0 |
| Costa Rica | 1.1 |
| Mexico | 1.4 |
| Colombia | 1.7 |
| Chile | 2.1 |
| Sweden | 2.2 |
| Onario | 2.4 |
| Canada | 2.5 |
| Denmark | 2.5 |
| United Kingdom | 2.5 |
| New Zealand | 2.6 |
| United States | 2.8 |
| Turkey | 2.8 |
| Iceland | 2.9 |
| Ireland | 3.0 |
| Spain | 3.0 |
| Israel | 3.0 |
| Italy | 3.2 |
| Finland | 3.3 |
| Netherlands | 3.3 |
| Portugal | 3.4 |
| Norway | 3.6 |
| Australia | 3.8 |
| Greece | 4.2 |
| China | 4.3 |
| Slovenia | 4.5 |
| Luxembourg | 4.5 |
| Switzerland | 4.5 |
| Estonia | 4.7 |
| Latvia | 5.6 |
| Belgium | 5.6 |
| Slovak Republic | 5.8 |
| France | 6.0 |
| Lithuania | 6.6 |
| Poland | 6.6 |
| Czech Republic | 6.6 |
| Hungary | 7.0 |
| Austria | 7.4 |
| Germany | 8.0 |
| Russia | 8.1 |
| Korea | 12.3 |
| Japan | 13.1 |
| Hospital Bed Occupancy Rate | |
|---|---|
| Greece | 61.6 |
| United States | 64.0 |
| Netherlands | 65.4 |
| Hungary | 65.5 |
| Portugal | 66.8 |
| Slovak Republic | 67.8 |
| Turkey | 68.0 |
| Slovenia | 69.5 |
| Czech Republic | 70.1 |
| Estonia | 70.4 |
| Luxembourg | 70.7 |
| Latvia | 71.1 |
| Lithuania | 73.2 |
| Austria | 73.8 |
| Mexico | 74.0 |
| OECD28 | 75.2 |
| Spain | 75.3 |
| Japan | 75.5 |
| France | 75.6 |
| Italy | 78.9 |
| Chile | 79.1 |
| Germany | 79.8 |
| Norway | 80.7 |
| Belgium | 81.8 |
| Switzerland | 82.0 |
| United Kingdom | 84.3 |
| Canada | 91.6 |
| Israel | 93.3 |
| Ireland | 94.9 |
| Ontario | 96.2 |
Footnotes
[1] In addition, 1,319 of the critical care beds were equipped with mechanical ventilators. The Province also maintained a stockpile of over 200 ventilators for periods of capacity pressure.
[2] Due to the lack of beds compared to patients, some hospitals have relied on placing patients in emergency rooms, unconventional spaces (such as hallways) or stretchers. On average, hospitals reported that 1,057 patients received care in these unconventional settings each day in 2018-19.
[3] On average, each infected person spreads the virus to 2.5 other people every five days.
[4] The government of Canada warned that without measures to limit the spread of COVID-19, the virus was expected to infect between 30 per cent to 70 per cent of all Canadians. In Ontario, this would represent between 4 to 10 million infections and result in 40,000 to 100,000 fatalities.
[5] Acute care beds include critical care beds, and critical care beds include beds with ventilators.
[6] However, the Province would still have had sufficient critical care beds as a result of the expansion of critical care capacity.
[7] See chapter 5 for more details.
[8] The Province is the major source of revenue for hospitals, accounting for approximately 85 to 100 per cent of operating revenue. See FAO, “Ontario Health Sector: Expense Trends and Medium-Term Outlook Analysis”, 2017, p. 45.
[9] Also referred to as intensive care unit (ICU) beds.
[11] Based on information provided by the Ministry of Health.
[13] Public Health Ontario, COVID-19 in Ontario Epidemiologic Summary.
[14] World Health Organization, Coronavirus Disease 2019 Situation Report – 46, March 6, 2020 and The Novel Coronavirus, 2019-nCoV, is Highly Contagious and More Infectious Than Initially Estimated, Steven Sanche, Yen Ting Lin, Chonggang Xu, Ethan Romero-Severson, Nick Hengartner, Ruian Ke, February 11, 2020.
[15] https://www.theglobeandmail.com/canada/article-between-30-and-70-per-cent-of-canadians-could-be-infected-with/.
[16] https://news.ontario.ca/opo/en/2020/03/ontario-closing-at-risk-workplaces-to-protect-health-and-safety.html.
[17] In the 2019 Ontario Budget, the Province announced that it would reduce the number of public health units from 35 to 10 and reduce the budget for public health units by $200 million by 2021-22.
[18] Based on the Province’s integrated Public Health Information System (iPHIS) database.
[19] According to a study by Bommer & Vollmert the detection rate of COVID-19 cases in Canada as of March 31 was approximately 5 per cent. See: https://reason.com/wp-content/uploads/2020/04/Bommer-Vollmer-2020-COVID-19-detection-April-2nd.pdf.
[20] On April 15, the Province changed the way it reports testing to show the total number of tests rather than the number of patients tested.
[21] Cases can also be classified as resolved if they are reported as recovered in the integrated Public Health Information System database.
[22] https://globalnews.ca/news/6847727/kitchener-forest-heights-long-term-care-coronavirus-residents-hospital/.
[23] Critical Care Services Ontario COVID-19 daily reports.
[24] For South Korea, the FAO considers the country raising its virus alert level to the highest level on February 23rd as the comparable action to declaring a state of emergency. https://www.nytimes.com/2020/02/23/world/asia/china-coronavirus.html.
[25] https://globalnews.ca/news/6847727/kitchener-forest-heights-long-term-care-coronavirus-residents-hospital/.
[26] American Enterprise Institute, National coronavirus response: A road map to reopening, 2020 and World Health Organization, Strategic preparedness and response plan for the new coronavirus, April 14, 2020.
[27] The following examples are based on a review of Denmark, Germany, Italy, Spain, and the United Kingdom.
[32] https://www.euronews.com/2020/04/21/covid-19-number-of-infected-in-france-not-enough-to-prevent-second-wave-warn-scientists.
[33] Includes provincial and municipal funding. Financial Information Return, Ministry of Municipal Affairs and Housing.
[34] It is unclear what portion of this $85 million will be directed to Public Health Ontario versus local public health agencies.
[35] Based on the total number of cases by exposure type. Of the 12,245 cases, the origins of 4,929 cases remain pending investigation. https://files.ontario.ca/moh-covid-19-report-en-2020-04-22.pdf.
[37] https://www.centerforhealthsecurity.org/our-work/pubs_archive/pubs-pdfs/2020/200410-national-plan-to-contact-tracing.pdf and https://www.politico.com/news/2020/04/21/tracking-coronavirus-workforce-does-not-exist-197622.
[38] Matt Hancock, Secretary of State for Health and Social Care, April 23 Daily Briefing.
[40] See: https://www.huffingtonpost.ca/entry/elective-surgery-cancelled-coronavirus-canadians_ca_5e72351ec5b6eab779404903 and https://nationalpost.com/health/kind-of-scared-preparing-for-possible-covid-19-wave-hospitals-delay-surgeries-clear-out-wards.
[41] https://www.huffingtonpost.ca/entry/elective-surgery-cancelled-coronavirus-canadians_ca_5e72351ec5b6eab779404903.
[42] https://nationalpost.com/health/kind-of-scared-preparing-for-possible-covid-19-wave-hospitals-delay-surgeries-clear-out-wards.
[43] https://www.ctvnews.ca/health/coronavirus/canadian-hospitals-take-drastic-measures-amid-covid-19-crisis-1.4855849.
[44] The FAO collected emergency room wait times and waitlists from hospitals’ websites. Due to limited data, figures represent the wait times and waiting list for select Ontario hospitals only.
[45] https://nationalpost.com/news/eerily-quiet-ers-before-covid-19-surge-could-mean-problems-down-the-road-doctors-say.
[46] https://news.ontario.ca/opo/en/2020/04/ontario-significantly-expands-hospital-capacity-to-prepare-for-any-covid-19-outbreak-scenario.html?utm_source=digest&utm_medium=email&utm_campaign=p.
[47] The number of cancelled and avoided procedures is estimated based on the number of days elapsed since March 15, the average length of stay for an elective surgery (estimated to be 4.8 days for acute care), and the number of beds that have been freed-up as of April 22.
[48] For example, researchers have warned that the cancellation of procedures to diagnose and treat cancer could result in a cancer epidemic in the future. https://www.irishexaminer.com/breakingnews/ireland/covid-focus-could-lead-to-cancer-epidemic–researchers-995267.html.
[49] OECD Labour Force Statistics, 2019.