

Click here for all Ontario Service Fees reports.
Key Points
- This report provides information on the Province’s service fees, including service fee rate changes in 2019-20, service fee revenue sources and growth rates, the most used services by number of transactions and the usage of ServiceOntario’s online service delivery.
- For 2019-20, the Province changed 293 service fee rates: 235 fee increases, two fee decreases, five new fees and 51 eliminated fees.
- More than half of the fee rate increases exceeded the rate of inflation and were largely court fees under the Ministry of the Attorney General.
- The Province raised $7.1 billion in service fee revenue in 2018-19. The largest sources of service fee revenue were vehicle and driver registration fees ($2.0 billion), international college student tuition fees ($1.4 billion), domestic college student tuition fees ($0.9 billion) and hospital fees ($0.9 billion).
- From 2015-16 to 2018-19, the Province’s service fee revenue grew by an average of 8.9 per cent each year.
- The strong growth rate was led by colleges fee revenue, which averaged annual growth of 18.0 per cent,[1] and vehicle and driver registration fee revenue, which averaged annual growth of 8.4 per cent.
- For 2019-20, service fee revenue is projected to grow by only 1.4 per cent, led by an anticipated slow down in the growth rates of colleges fee revenue and vehicle and driver registration fee revenue.
- In April 2019, the Province announced that it will move 10 million ServiceOntario transactions away from in-person delivery to online delivery over the next five years.
- This is an ambitious goal given that online transactions for fee-based services increased by only 0.8 million over the last three years (an increase of 26 per cent). An additional 10 million online transactions over the next five years would represent an increase of up to 266 per cent.[2]
Introduction and Background
The government of Ontario (the Province) levies over 1,200 service, licence and permit fees (hereafter referred to as service fees). A comprehensive list of the 1,200 service fees is available on the FAO’s website at https://fao-on.org/en/Blog/Publications/service-fees-2020 and includes fees charged by the Province’s ministries, agencies and, starting with this year’s report, hospitals, colleges and school boards. In total, service fees charged by the Province are projected to raise $7.2 billion in revenue in 2019-20.
This report provides:
- Information on service fee rate changes for 2019-20;
- A review of service fee revenue sources and growth rates;
- A list of the most used services by number of transactions; and
- An analysis of the usage and rates charged for services that are delivered online.
Service Fee Rate Changes in 2019-20
Based on information provided to the FAO, the Province changed 293 service fee rates in 2019-20.[3] This year’s changes include 235 rate increases, two rate decreases, five new fees and 51 eliminated fees. The complete list of service fee rate changes is available on the FAO’s website at https://fao-on.org/en/Blog/Publications/service-fees-2020.
| Ministry/Agency | Rate Increases | Rate Decreases | New Fees | Eliminated Fees | Total Fee Changes |
|---|---|---|---|---|---|
| Agriculture, Food and Rural Affairs | 0 | 0 | 0 | 1 | 1 |
| Attorney General | 85 | 0 | 1 | 1 | 87 |
| Colleges and Universities | 0 | 2 | 0 | 0 | 2 |
| Economic Development, Job Creation and Trade | 1 | 0 | 0 | 0 | 1 |
| Education | 1 | 0 | 0 | 0 | 1 |
| Environment, Conservation and Parks | 5 | 0 | 0 | 0 | 5 |
| Financial Services Regulatory Authority | 8 | 0 | 1 | 46 | 55 |
| Government and Consumer Services | 18 | 0 | 2 | 0 | 20 |
| Health | 4 | 0 | 0 | 0 | 4 |
| Municipal Affairs and Housing | 24 | 0 | 0 | 0 | 24 |
| Natural Resources and Forestry | 34 | 0 | 0 | 0 | 34 |
| Solicitor General | 8 | 0 | 0 | 0 | 8 |
| Transportation | 42 | 0 | 0 | 3 | 45 |
| Ontario Science Centre | 0 | 0 | 1 | 0 | 1 |
| ORNGE | 4 | 0 | 0 | 0 | 4 |
| Royal Ontario Museum | 1 | 0 | 0 | 0 | 1 |
| Total | 235 | 2 | 5 | 51 | 293 |
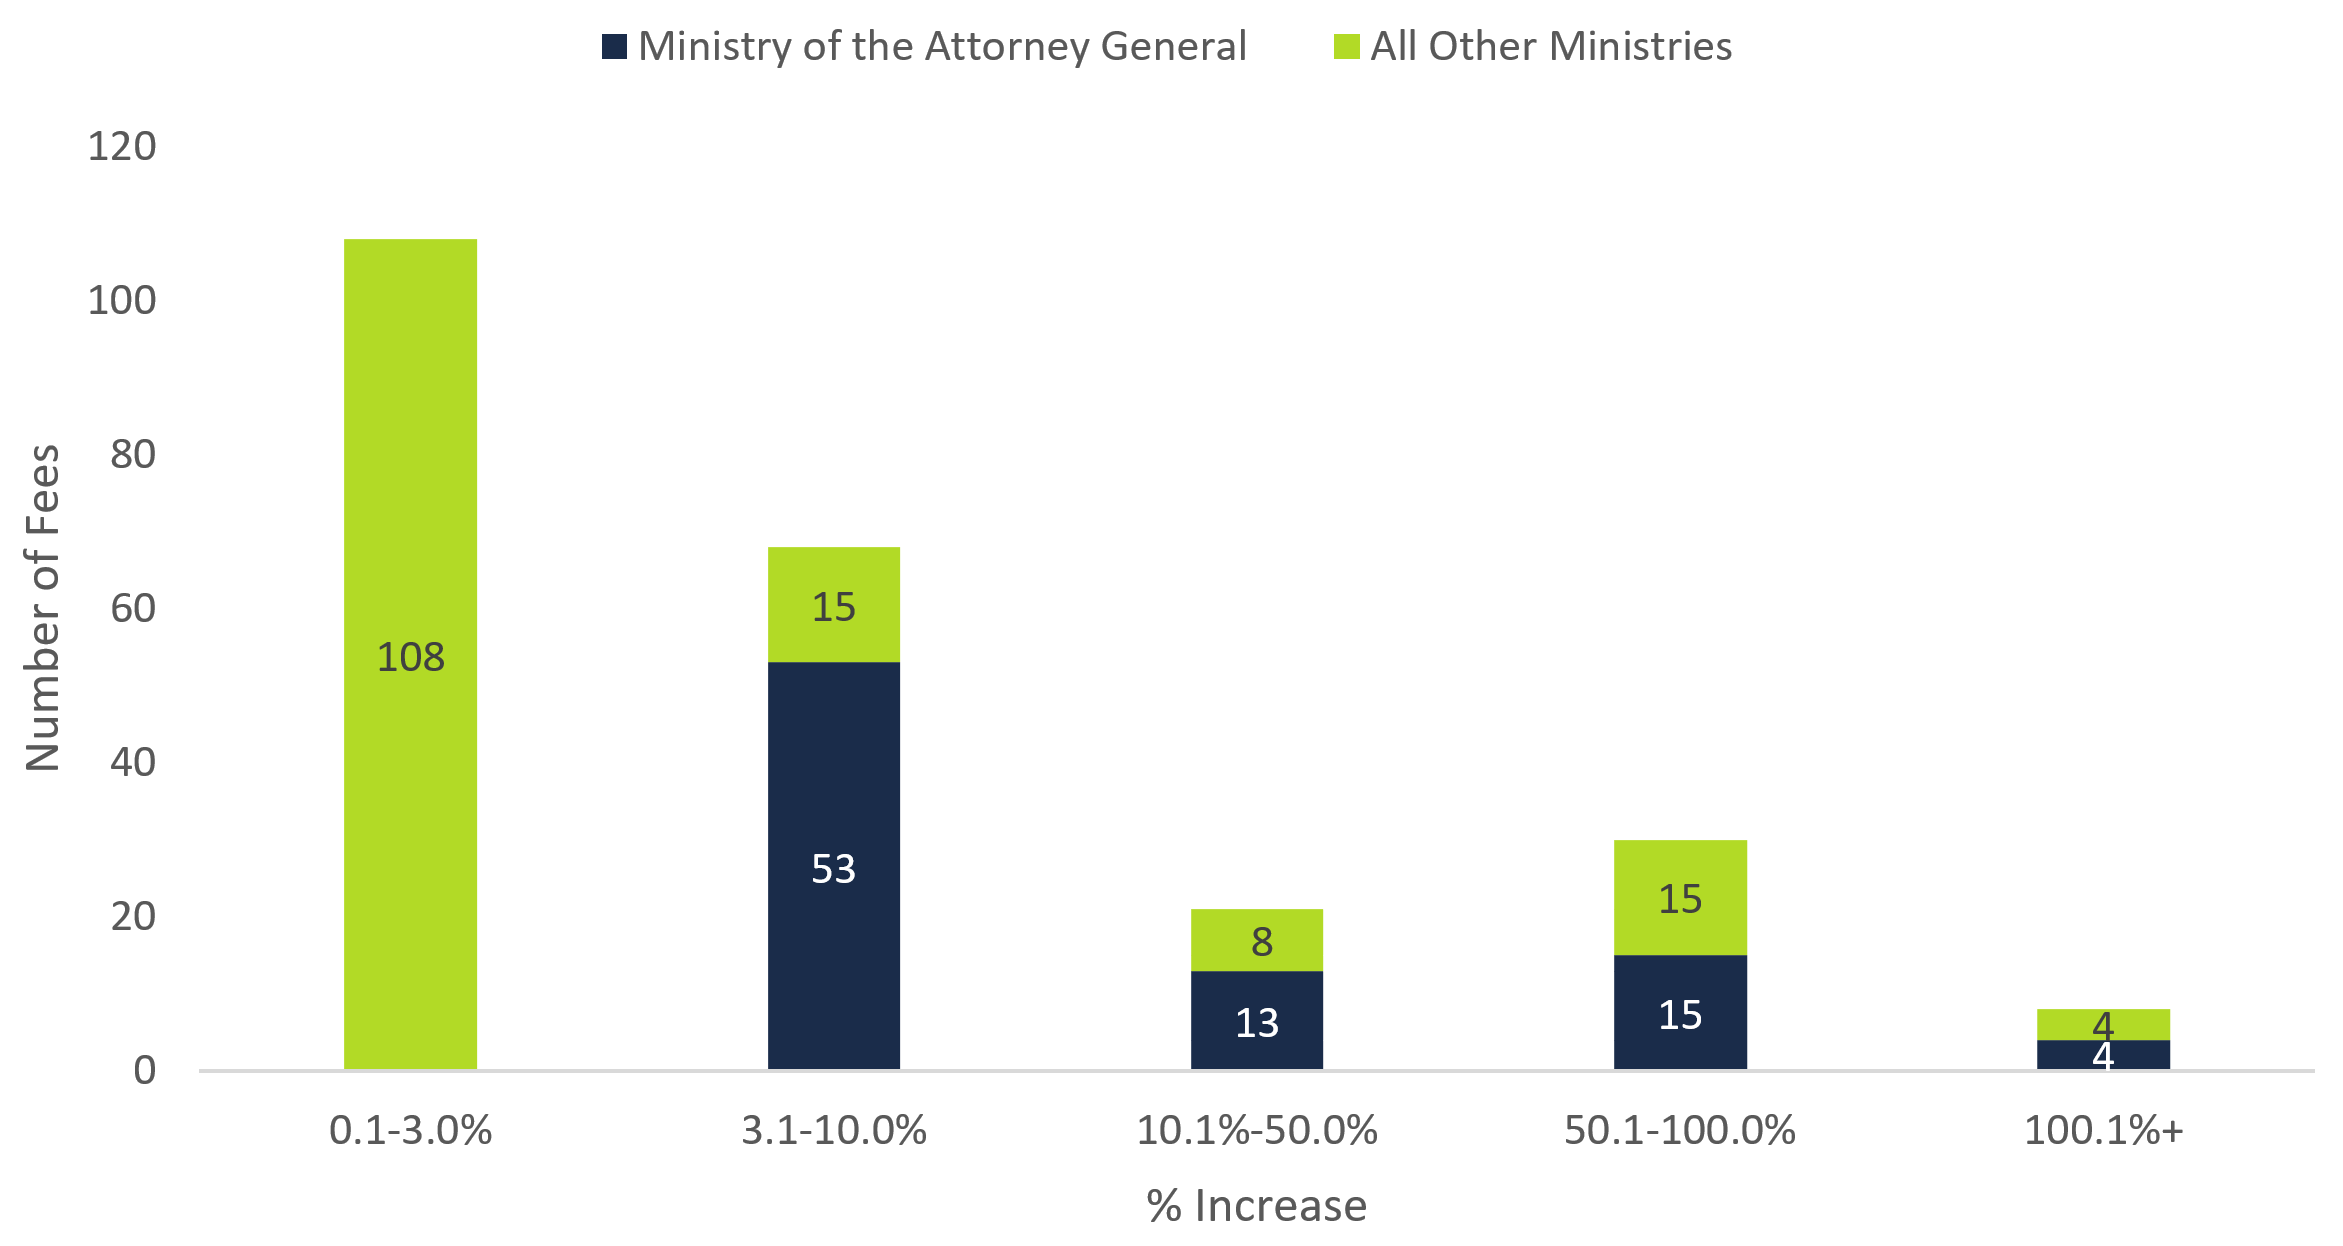
Overall, the 235 fee rate increases in 2019-20 were more than double the number of rate increases in 2018-19. For 2019-20, more than half of the fee rate increases exceeded the rate of inflation. Notably, 68 service fee rates increased by 3 to 10 per cent, 21 service fee rates increased by 10 to 50 per cent, 30 service fee rates increased by 50 to 100 per cent, and eight service fee rates increased by over 100 per cent.
Figure 1 Distribution of service fee rate increases, 2019-20
Source: FAO analysis of information provided by the Province.
Accessible version
| 0.1%-3.0% | 3.1%-10.0% | 10.1%-50.0% | 50.1%-100.0% | 100.1%+ | |
|---|---|---|---|---|---|
| Ministry of the Attorney General | 0 | 53 | 13 | 15 | 4 |
| All Other Ministries | 108 | 15 | 8 | 15 | 4 |
The Ministry of the Attorney General’s (MAG) 85 service fee rate increases accounts for two-thirds of the service fee rate increases that exceeded the rate of inflation. Notable MAG service fee rate increases include:
- Forwarding documents for small claims court (230 per cent increase);
- Filing a notice of objection in an application under the Repair and Storage Liens Act (112 per cent increase);
- Filing a notice of motion for small claims court (100 per cent increase);
- Filing a trial record for civil court (100 per cent increase); and
- Perfecting an appeal for civil court (50 per cent increase).
Across other ministries, the vast majority of service fee rate increases are inflation-related adjustments. However, other service fees with notable increases include:
- Ontario Provincial Police fees for services such as criminal background checks, fingerprints and technical traffic collision reports, which increased between 39 per cent and 145 per cent;
- Private school inspection fees, which increased by 16 per cent; and
- The general admission fee to the Royal Ontario Museum, which increased by six per cent for seniors, nine per cent for students and youth, and 15 per cent for adults.
Most of the eliminated fees relate to the replacement of the Financial Services Commission of Ontario (FSCO) and the Deposit Insurance Corporation of Ontario (DICO) with the Financial Services Regulatory Authority (FSRA). The transition to the FSRA resulted in the elimination of 46 application fees but also included eight fee increases (between 59 per cent and 63 per cent) for mortgage brokers, administrators and agents.
Sources of Service Fee Revenue
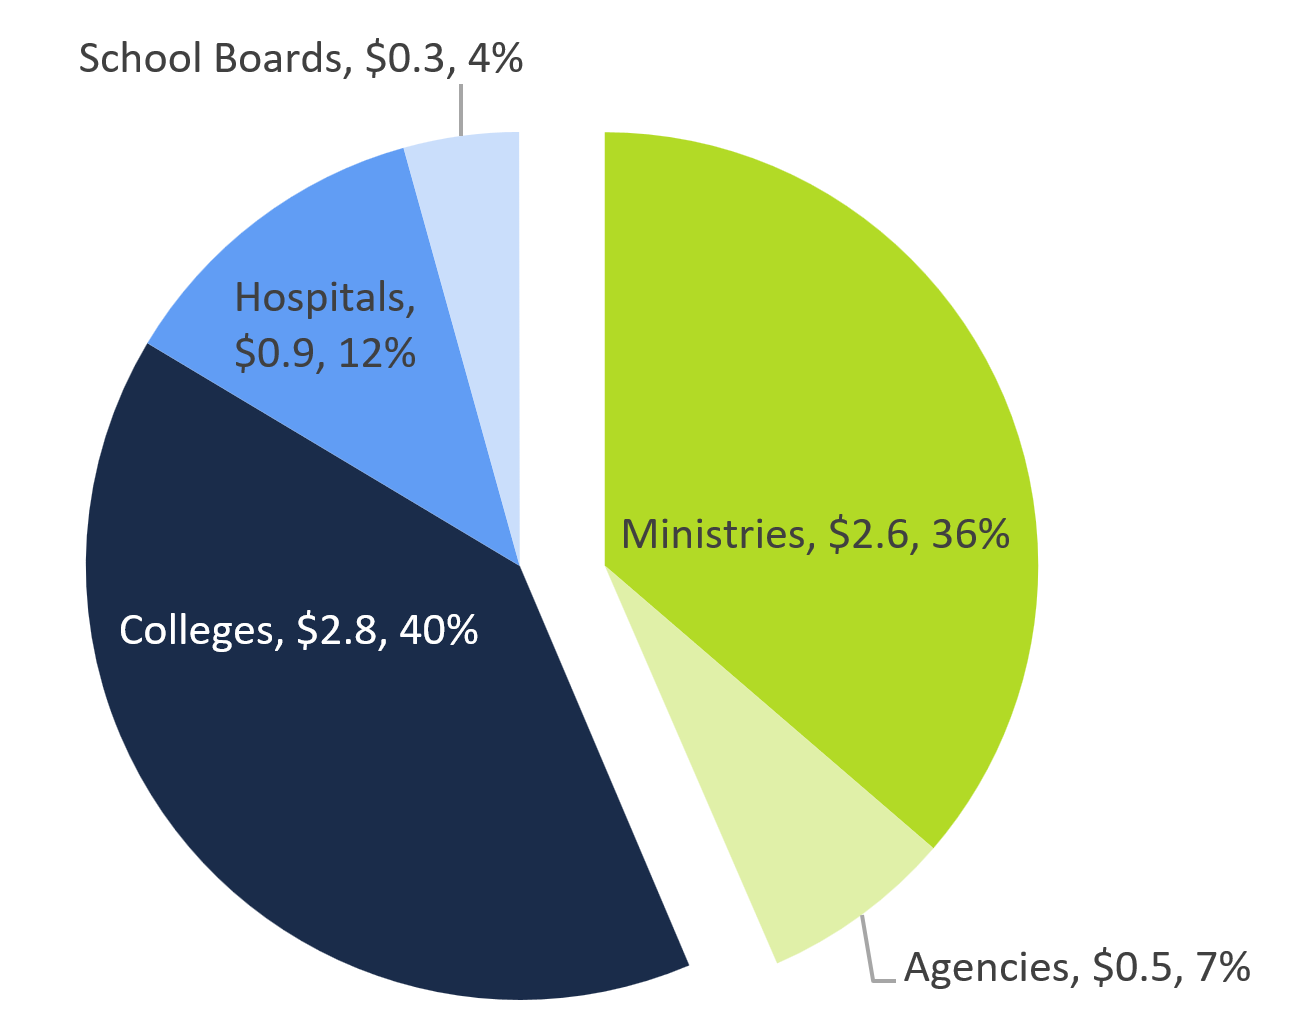
In 2018-19, the Province generated $7.1 billion in service fee revenue. Of this revenue, the Province’s ministries and agencies accounted for $3.1 billion (44 per cent) and hospitals, colleges and school boards accounted for the remaining $4.0 billion (56 per cent).[4]
Figure 2 Sources of service fee revenue, 2018-19 ($ billions)
Source: 2018-19 Public Accounts of Ontario and Treasury Board Secretariat.
Accessible version
| Revenue Source | Revenue | |
|---|---|---|
| $ (billions) | % | |
| Ministries | 2.6 | 36 |
| Agencies | 0.5 | 7 |
| Colleges | 2.8 | 40 |
| Hospitals | 0.9 | 12 |
| School Boards | 0.3 | 4 |
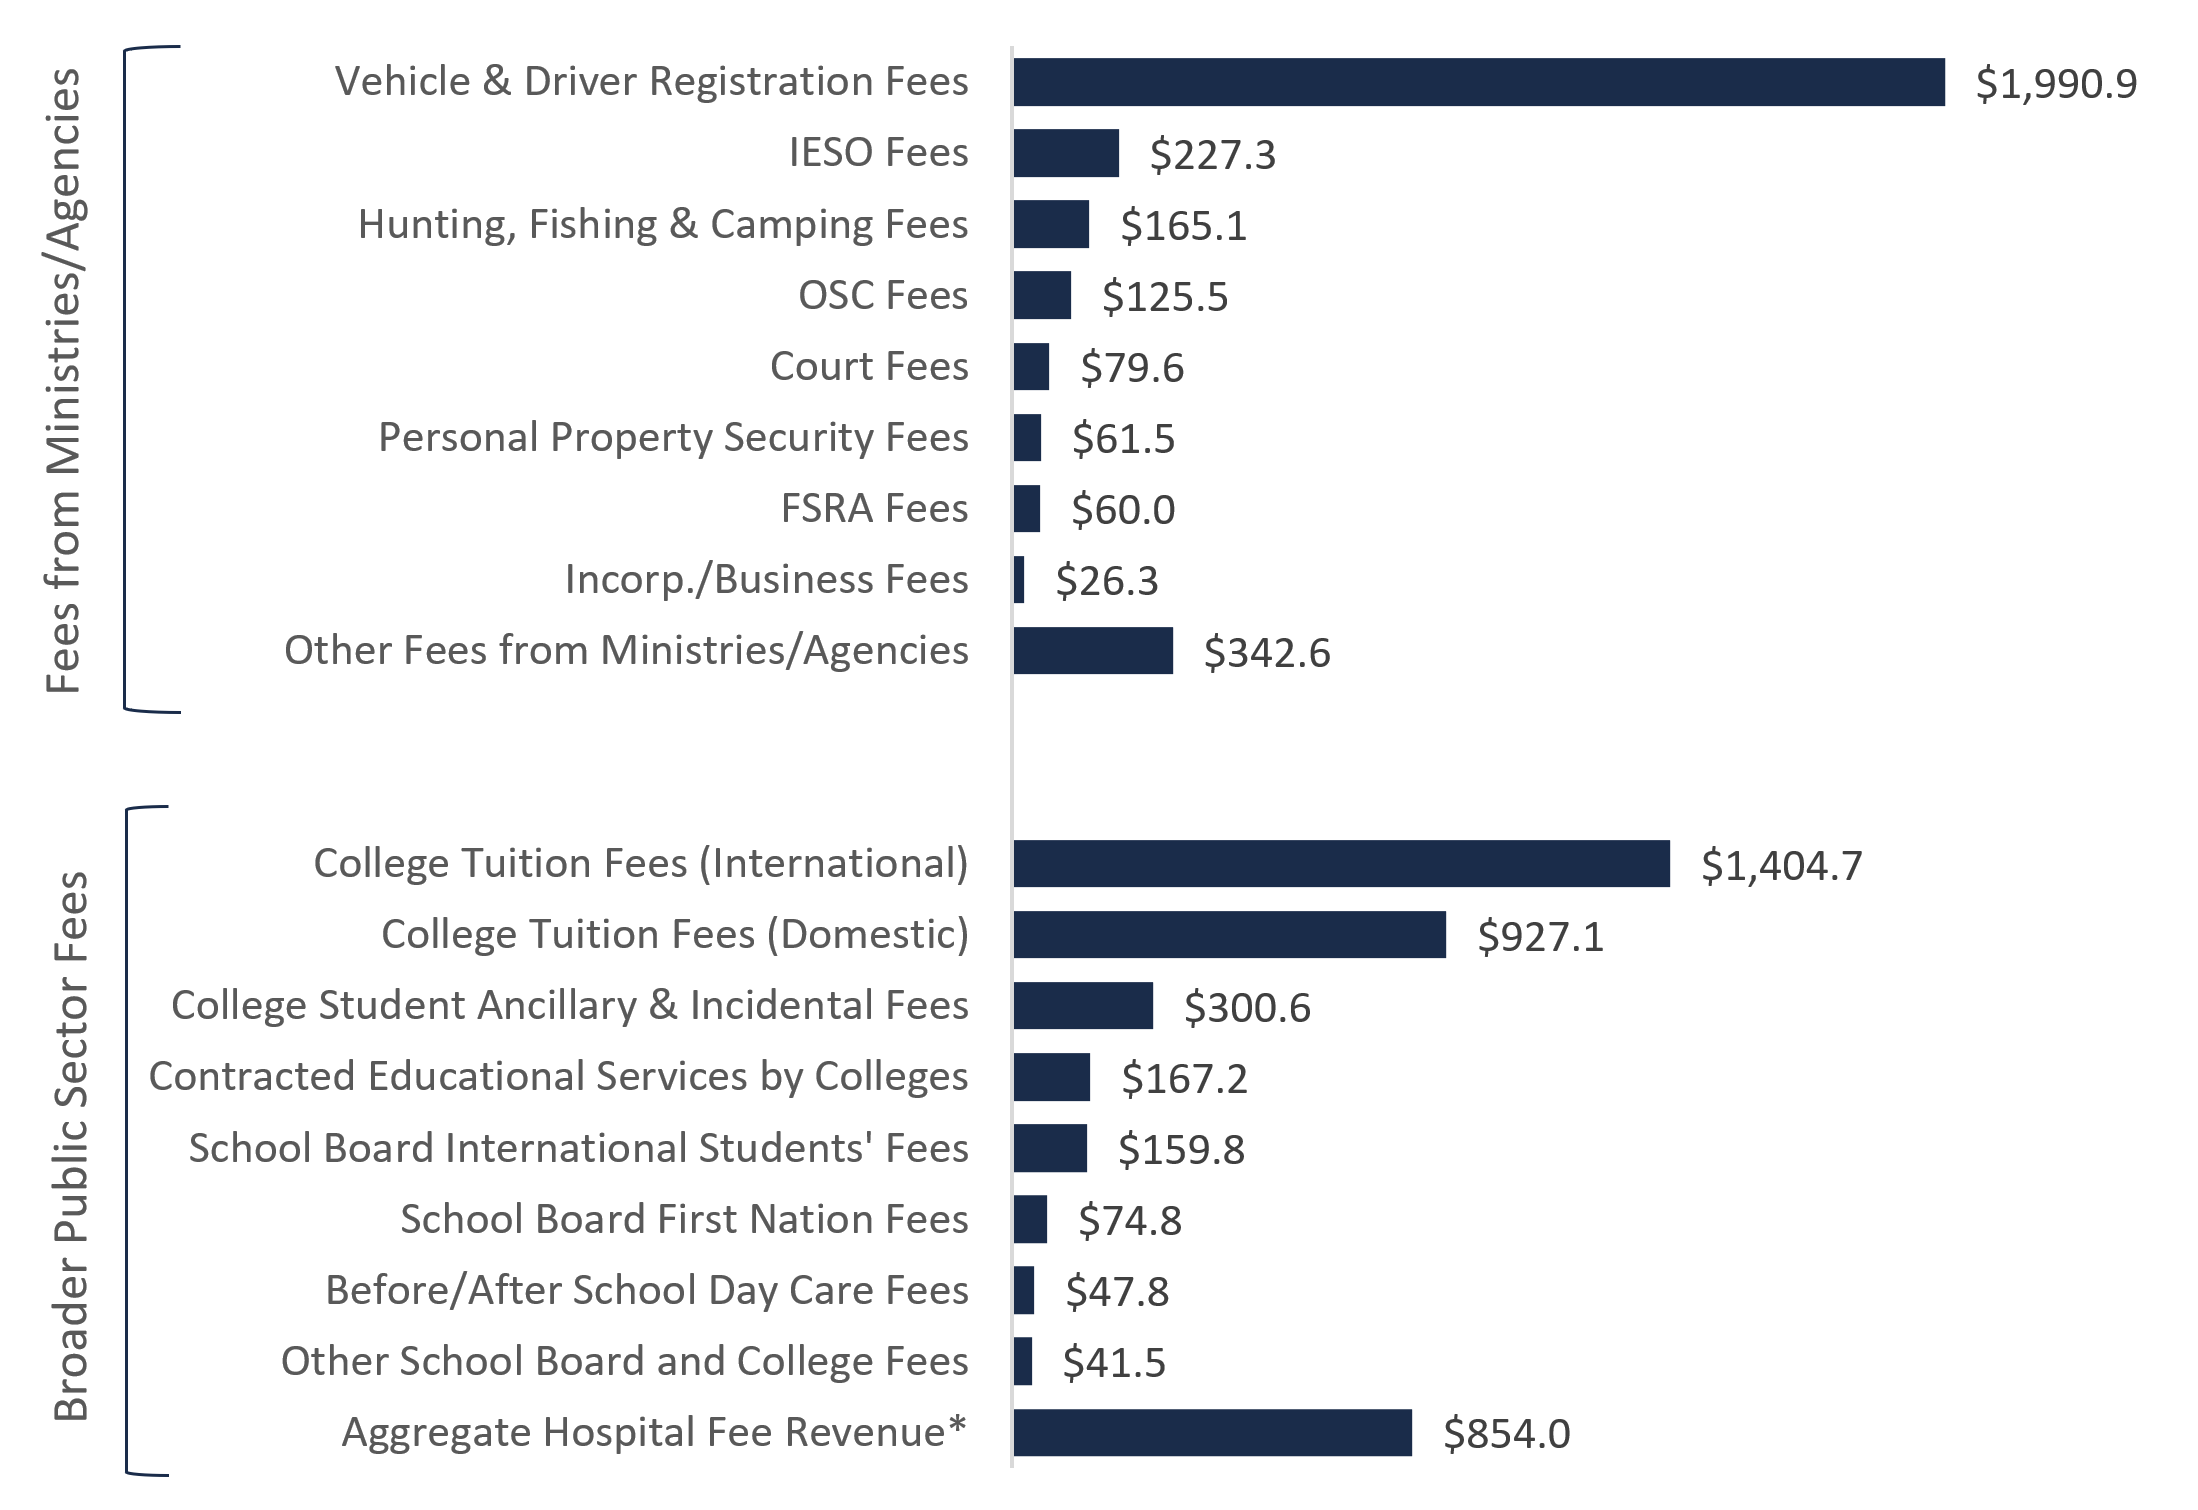
Of the $3.1 billion in ministry and agency service fee revenue that was raised in 2018-19, the largest service fee revenue category was vehicle and driver registration fees at $2.0 billion. This was followed by Independent Electricity System Operator fees ($227.3 million), hunting, fishing, and camping fees ($165.1 million), Ontario Securities Commission fees ($125.5 million), court fees ($79.6 million), personal property security fees ($61.5 million), Financial Services Regulatory Authority fees ($60.0 million), and incorporation/business fees ($26.3 million).
Among colleges and school boards, the largest service fee revenue categories in 2018-19 were international and domestic college tuition fees, which recorded revenues of $1.4 billion and $0.9 billion, respectively. The next largest fee categories were college student ancillary and incidental fees ($300.6 million), college contracted educational services ($167.2 million), school board international students’ fees ($159.8 million), school board First Nations fees ($74.8 million) and before/after school day care fees ($47.8 million).
Finally, hospitals generated $854 million in total service fee revenue in 2018-19, however, the Ministry of Health was unable to provide itemized information on fee rates and revenue.[5]
Figure 3 Sources of service fee revenue, 2018-19 ($ millions)
* Note: Represents the revenue from all hospital service fees as the Ministry of Health was unable to provide to the FAO an itemized list of service fees charged by hospitals.
Source: 2018-19 Public Accounts of Ontario and FAO analysis of information provided by the Province.
Description accessible
| Fee Category | $ (millions) | |
|---|---|---|
| Fees from Ministries and Agencies | Vehicle and Driver Registration Fees | 1,990.9 |
| IESO Fees | 227.3 | |
| Hunting, Fishing & Camping Fees | 165.1 | |
| OSC Fees | 125.5 | |
| Court Fees | 79.6 | |
| Personal Property Security Fees | 61.5 | |
| FSRA Fees | 60.0 | |
| Incorp./Business Fees | 26.3 | |
| Other Fees from Ministries/Agencies | 342.6 | |
| Broder Public Sector Fees | College Tuition Fees (International) | 1,404.7 |
| College Tuition Fees (Domestic) | 927.1 | |
| College Student Ancillary & Incidental Fees | 300.6 | |
| Contracted Educational Service by Colleges | 167.2 | |
| School Board International Students’ Fees | 159.8 | |
| School Board First Nation Fees | 74.8 | |
| Before/After School Day Care Fees | 47.8 | |
| Other School Board and College Fees | 41.5 | |
| Other School Board Aggregate Hospital Fee Revenue* | 854.0 |
Growth in Service Fee Revenue
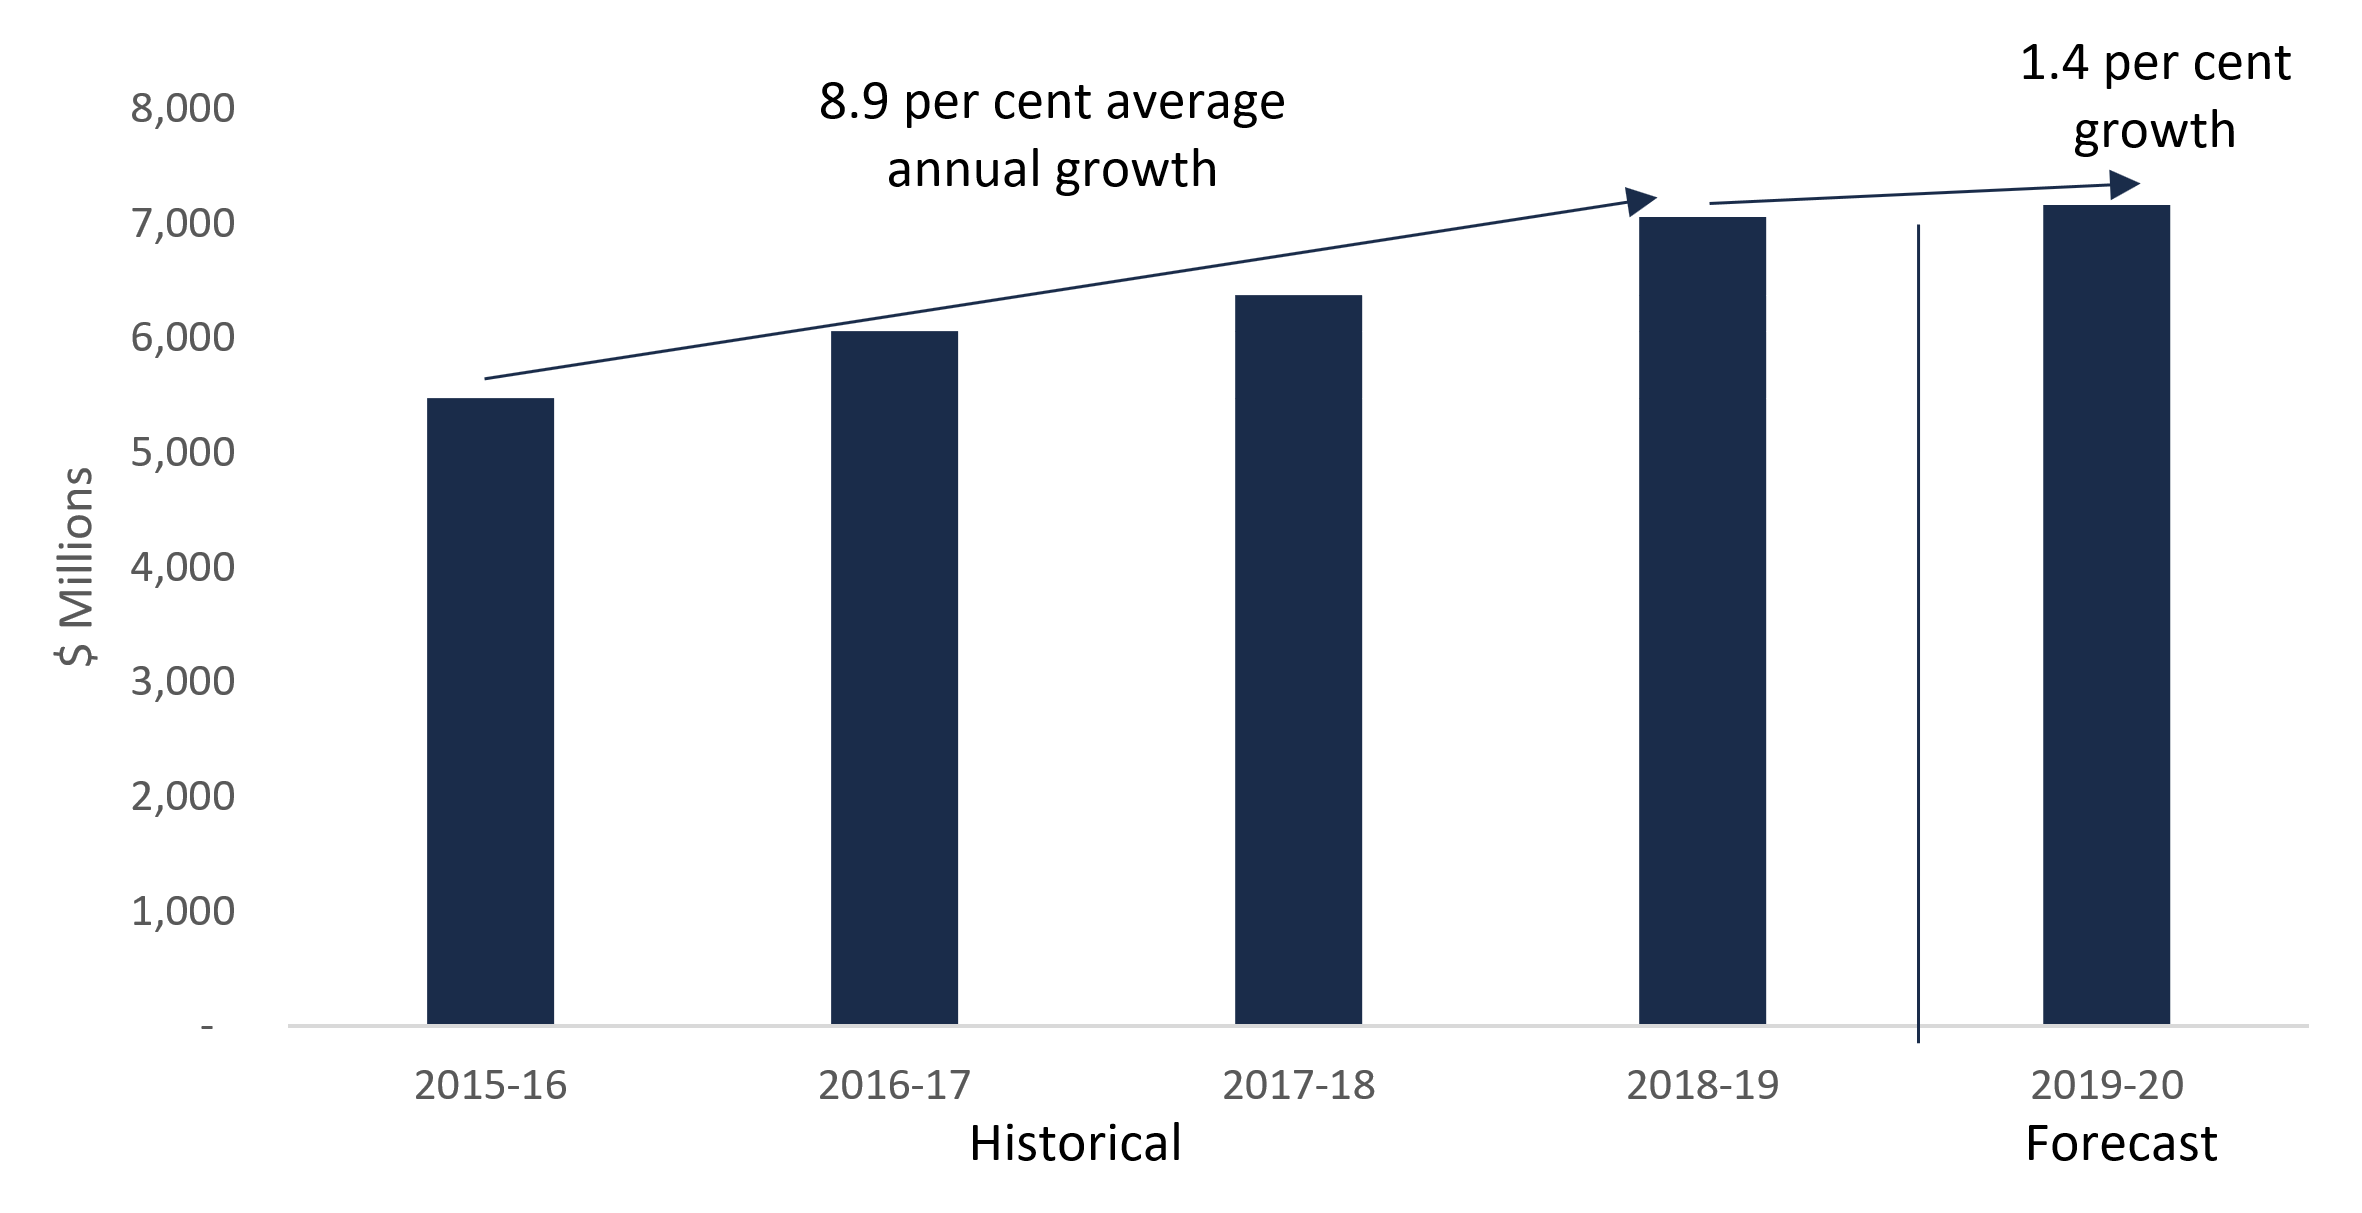
In 2019-20, the Province expects to generate $7.2 billion in service fee revenue, up from $7.1 billion in 2018-19. This represents a 1.4 per cent increase in fee revenue, which is lower than the 8.9 per cent average annual increase the Province experienced between 2015-16 and 2018-19.
Figure 4 Service fee revenue growth, 2015-16 to 2019-20
Source: 2019 Ontario Economic Outlook and Fiscal Review and FAO analysis of information provided by the Province.
Accessible version
| Historical | Forecast | ||||
|---|---|---|---|---|---|
| 2015-16 | 2016-17 | 2017-18 | 2018-19 | 2019-20 | |
| Revenue ($ Millions) |
5,472 | 6,059 | 6,377 | 7,057 | 7,158 |
The strong fee revenue increase from 2015-16 to 2018-19 was driven by significant growth in revenue from colleges fees and the Ministry of Transportation’s vehicle and driver registration fees. Colleges fee revenue increased from $1.7 billion in 2015-16 to $2.8 billion in 2018-19, an average annual growth rate of 18.0 per cent.[6] Revenue from vehicle and driver registration fees increased by an average annual growth rate of 8.4 per cent from 2015-16 to 2018-19, rising from $1.6 billion in 2015-16 to $2.0 billion in 2018-19. All other service fee revenue increased by an average annual growth rate of 0.8 per cent over the same time period.
For 2019-20, projected service fee revenue growth of 1.4 per cent reflects slower growth in colleges and vehicle and driver registration fee revenue. Vehicle and driver registration fee revenue is projected to increase by 0.4 per cent, while colleges service fee revenue is projected to decline by 1.6 per cent, in part due to a ten per cent reduction in domestic tuition rates for the 2019-20 school year.[7]
Top Service Fees by Number of Transactions
The FAO’s list of the Province’s over 1,200 service fees includes information on number of transactions for each service fee.[8] The ten service fees with the highest transaction volume in 2018-19 (i.e., the most commonly paid fees) remained largely unchanged from 2017-18.[9] Six were Ministry of Transportation fees, one was a Metrolinx fee, two were Ministry of Government and Consumer Services fees and one was a Ministry of Natural Resources and Forestry fee.
| Ministry/Agency | Fee | Rate ($) | Transactions (millions) |
Revenue ($ millions) |
|---|---|---|---|---|
| Transportation | Highway 407 East Tolls | 4.24* | 12.2 | 51.6 |
| Transportation | Passenger Car Validation – Southern Ontario | 120.00 | 7.1 | 849.1 |
| Metrolinx | PRESTO Farecard Overdraft Fee | 0.25 | 3.3 | 0.8 |
| Transportation | Permit Issue – Motor Vehicle/Dealer | 32.00 | 3.2 | 103.7 |
| Natural Resources and Forestry | Fishing and Hunting Licences and Permits | 8.57 to 449.86 | 2.1 | 62.6 |
| Transportation | Driver’s Licence Original and Renewal | 90.00 | 1.5 | 130.7 |
| Transportation | Vehicle Number Plate/Permit Issue (Motor Vehicle/Dealer) | 27.00 to 59.00 | 1.3 | 36.4 |
| Government and Consumer Services | Register Financing Statements/Renewal | 8.00 to 40.00 | 1.3 | 50.1 |
| Government and Consumer Services | Search for a Lien | 8.00 | 1.3 | 10.3 |
| Transportation | Vehicle Abstracts (history and search) | 12.00 | 1.1 | 13.8 |
In 2018-19, the Ministry of Transportation collected Highway 407 East toll revenue from 12.2 million trips. There were also 7.1 million transactions related to the passenger car validation fee charged to drivers in southern Ontario. The Ministry of Transportation had several other highly utilized fees, including: driver’s licences (1.5 million transactions), obtaining new or replacing vehicle number plates (1.3 million transactions), and vehicle history searches (1.1 million transactions). Metrolinx’s 25 cent fare overdraft fee for PRESTO cards was charged 3.3 million times (up from 2.3 million in 2017-18).[10] Within the Ministry of Government and Consumer Services, searching for a lien and registering/renewing a lien under the Personal Property Security Act each had 1.3 million transactions. The Ministry of Natural Resources and Forestry processed over 2.1 million fishing and hunting licences and permits.
ServiceOntario Online Service Delivery
ServiceOntario is responsible for administering services under four main fee categories: driving fees, business fees, vital statistics fees and outdoors fees.[11] In April 2019, the Province announced that it will move 10 million ServiceOntario transactions away from in-person delivery to online delivery over the next five years, saving $33.5 million over this period.[12] Given this commitment, the FAO analyzed trends in online service use and the fee rates charged for services provided online and in-person.
Online Transaction Volume
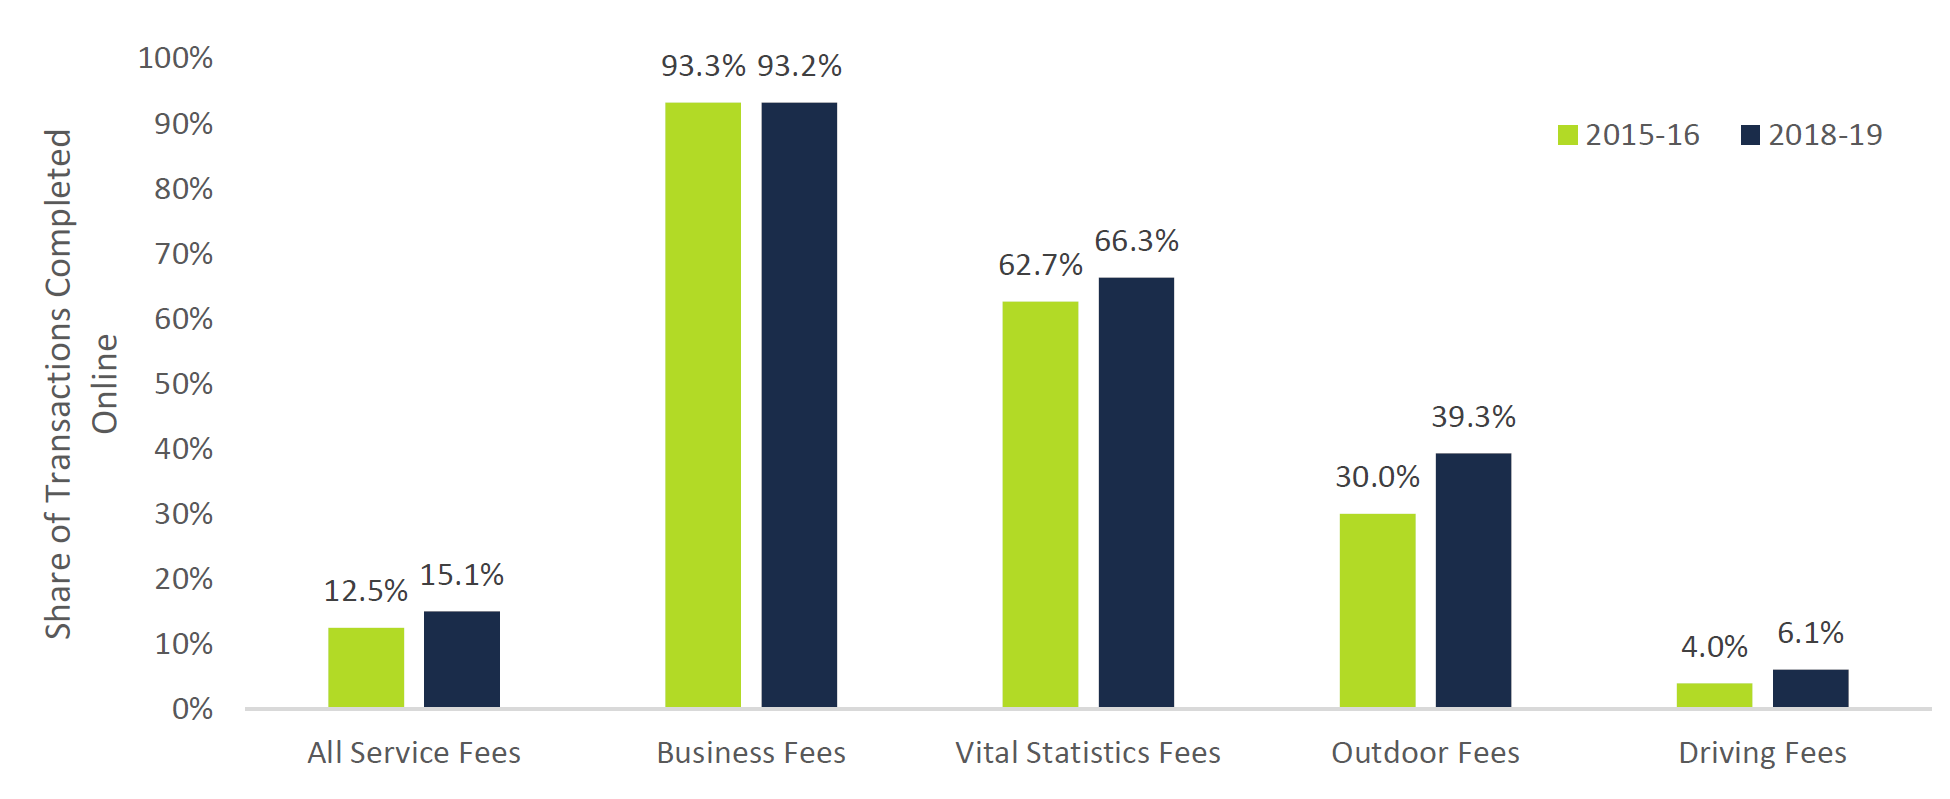
The FAO analyzed online transaction rates for ServiceOntario’s four main fee categories. In 2018-19, ServiceOntario delivered 25 million transactions, of which 3.8 million or 15 per cent were conducted online. Since 2015-16, the number of online transactions conducted by ServiceOntario has increased by 0.8 million or 26 per cent. By fee category:
- 93 per cent of the 1.2 million business fees transactions were conducted online, unchanged since 2015-16;
- 66 per cent of the 0.8 million vital statistics fees transactions were online, up from 63 per cent in 2015-16;
- 39 per cent of the 2.1 million outdoors fees[13] transactions were online, up from 30 per cent in 2015-16; and
- 6 per cent of the 20.9 million driving fees transactions were delivered online, up from 4 per cent in 2015-16.
Figure 5 Share of ServiceOntario service transactions completed online by category
Note: Online transactions for outdoors fees are delivered by the Ministry of Natural Resources and Forestry. Other transactions are delivered by phone or in-person through Service Ontario or licensed private providers.
Source: FAO analysis of information provided by the Province.
Accessible version
| 2015-16 | 2018-19 | |
|---|---|---|
| All Service Fees | 13.2% | 16.5% |
| Business Fees | 93.3% | 93.2% |
| Vital Statistics Fees | 62.7% | 66.3% |
| Outdoors Fees | 71.1% | 78.6% |
| Driving Fees | 4.0% | 6.1% |
Online Service Fee Rates
Online services are typically less expensive to deliver than in-person services.[14] Since service fees are charged to recover the costs of providing a service, the savings from online service delivery should be reflected in lower fee rates for online transactions. However, the fee rates for vital statistics, driving and outdoors services are the same whether delivered in-person or online. Only service fee rates for business fees differ by method of delivery, where business fee rates for online delivery are 25 per cent lower, on average, than in-person or mail transactions.
In 2013, the Auditor General of Ontario (AGO) noted that, “it costs less to process transactions online, but these savings are not passed on to clients” and recommended that the Province explore different fee structures.[15] Subsequently, the AGO reported that ServiceOntario had proposed to implement different fee structures for online service delivery but its request was not approved by the government.[16]
Expansion of Online Service Delivery
As noted above, in April 2019, the Province announced that it will move 10 million ServiceOntario transactions away from in-person delivery to online delivery over the next five years, saving $33.5 million over this period.[17] This is an ambitious goal given that, as previously discussed, online transactions for fee-based services increased by only 0.8 million over the last three years (an increase of 26 per cent). An additional 10 million online transactions over the next five years will require an increase of up to 266 per cent.[18]
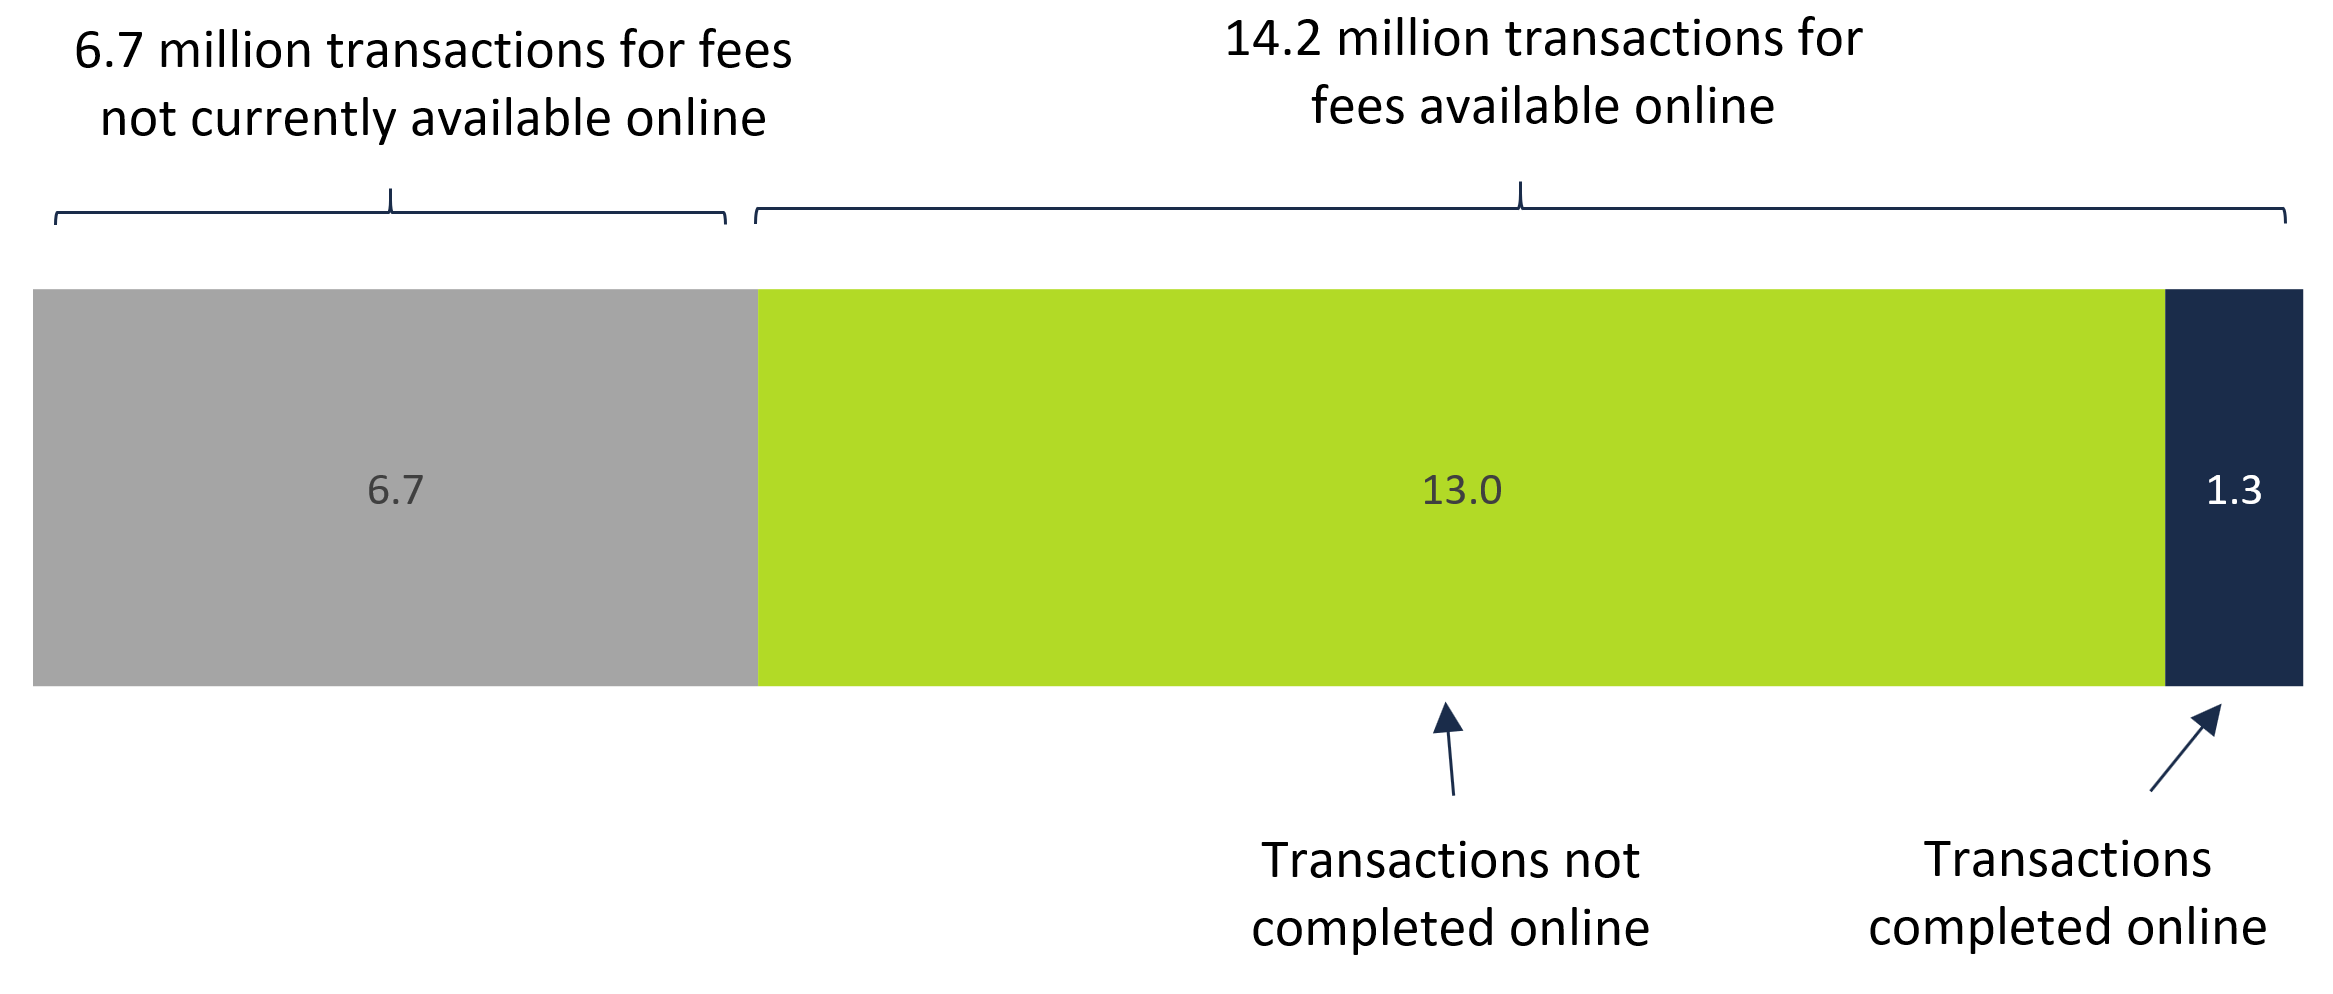
The ServiceOntario fee category with the lowest share of online transactions is driving fees. In 2018-19, only 6 per cent of 20.9 million transactions were completed online. Part of the reason for this low online usage rate is that 48 of ServiceOntario’s 75 driving fees (which represented 6.7 million transactions in 2018-19) are not available online.[19] These 48 services include obtaining permits, new license plates and commercial operator vehicle registrations.
However, even the 27 driving fees services that have online availability have a low online usage rate. In 2018-19, these 27 driving fees had 14.2 million transactions, of which only 1.3 million transactions (nine per cent) were conducted online.
Figure 6 Breakdown of 20.9 million driving fees transactions by method of delivery
Source: FAO analysis of information provided by the Province.
Accessible version
| Online Availability | Delivery Method | Transaction Volume (millions) |
|---|---|---|
| Transactions Available Online | Transactions Completed Online | 1.3 |
| Transactions Not Completed Online | 13.0 | |
| Transactions Not Available Online | Transactions Not Completed Online | 6.7 |
Factors that explain the low usage of online driving fees transactions, even for the services that are available online, include lack of awareness, privacy concerns and force of habit. Regulatory requirements are also an important factor.[20] For example, while online service is available for passenger vehicle validation (which represented 7.5 million transactions in 2018-19), individuals are still required to validate their car in person if it was part of a vehicle registration, limiting the overall use of online services. Similarly, individuals cannot renew their driver’s licence online if they need a new photo (required once every ten years, or, every second renewal), recently changed their address or have a licence that has been expired for over a year.
Footnotes
[1] Colleges service fee revenue growth was driven by strong growth in international student tuition fee revenue, which increased from $451 million in 2014-15 to $1.4 billion in 2018-19. This represents an average annual growth rate of 32.8 per cent.
[2] Assumes the 10 million increase in online transactions is entirely with fee-based services. Some of the increase in online transactions may be accounted for by an increase in free online services such as health card renewals and address changes.
[3] This total excludes service fee rate changes made by hospitals, colleges and school boards. The Province was unable to provide this information to the FAO.
[4] In addition to service fee revenue collected by ministries and provincial agencies, this year’s FAO report includes service fee revenue raised by the Province’s hospitals, colleges and school boards. In the 2017-18 Public Accounts of Ontario, the Province changed the accounting presentation of hospitals, colleges and school boards’ revenue and expense. Starting in 2017-18 the service fee revenue raised by these entities were included in the revenue statements of the Province. This results in a significant increase in the presentation of service fee revenue compared to the amounts presented in previous years’ FAO Ontario Service Fees reports.
[5] Examples of hospital service fees include patient fees for preferred accommodation, parking fees, television rental fees and other “out-of-pocket” payments.
[6] Colleges service fee revenue growth was driven by strong growth in international student tuition fee revenue, which increased from $451 million in 2014-15 to $1.4 billion in 2018-19. This represents an average annual growth rate of 32.8 per cent (Fiscal Sustainability of Ontario Colleges, PricewaterhouseCoopers on behalf of Colleges Ontario, 2017, p. 13. and information from the Province).
[7] In January 2019, the government announced a 10 per cent tuition rate reduction for domestic university and college students. This reduction was estimated to cost colleges $80 million in revenue. For more information, see https://globalnews.ca/news/4856924/ontario-tuition-cuts/.
[8] Available on the FAO’s website at https://fao-on.org/en/Blog/Publications/service-fees-2020.
[9] This list excludes hospital, college and school board service fees. The Province was unable to provide transaction data for these fees to the FAO.
[10] Metrolinx permits PRESTO users with insufficient funds on their card to take one trip. A $0.25 overdraft fee is charged when users reload their card.
[11] ServiceOntario also administers/processes fees related to land property records and personal property, and provides health card services which are not fee-based.
[12] Ontario Newsroom, ”Ontario Delivers Simpler, Faster, Better Services for Ontarians with New Digital Plan,” 30 April 2019. The Province’s online transactions commitment includes both fee-based services, such as those examined in this report, and free services, such as health card renewals and address changes.
[13] Online transactions for outdoors fees are delivered by the Ministry of Natural Resources and Forestry. Other transactions are delivered by phone or in-person through Service Ontario or licensed private providers.
[14] For example, the Auditor General of Ontario (AGO) reported in 2012-13 that a licence plate sticker renewal transaction had a direct cost of $2.91 when completed online, compared to a direct cost of $8.70 when completed in-person at a ServiceOntario centre. Auditor General of Ontario, 2013 Annual Report, “ServiceOntario,” p. 251.
[15] Auditor General of Ontario, 2013 Annual Report, “ServiceOntario,” p. 252.
[16] Auditor General of Ontario, 2015 Annual Report, “ServiceOntario,” p. 675.
[17] Ontario Newsroom, ”Ontario Delivers Simpler, Faster, Better Services for Ontarians with New Digital Plan,” 30 April 2019. The Province’s online transactions commitment includes both fee-based services, such as those examined in this report, and free services, such as health card renewals and address changes.
[18] Assumes the 10 million increase in online transactions is entirely with fee-based services. The exact increase in fee-based online transactions required to meet the 10 million commitment will depend on the increase in free services. Note that fee-based services represent the majority of ServiceOntario services.
[19] The Ministry of Transportation reports that there were no new driving fees available online in 2019-20.
[20] Auditor General of Ontario, 2015 Annual Report, “ServiceOntario”, p. 674. As part of the government’s April 2019 commitment to increase the usage of online service delivery, the Province announced regulatory changes that could improve the accessibility of online services for some vehicle and driver registration fees.