

1. Summary
At the request of Members of Provincial Parliament, this report reviews the Government of Ontario’s (the Province’s) Ministry of Education spending plan as outlined in the 2026 Ontario Budget.
Spending Plan Overview
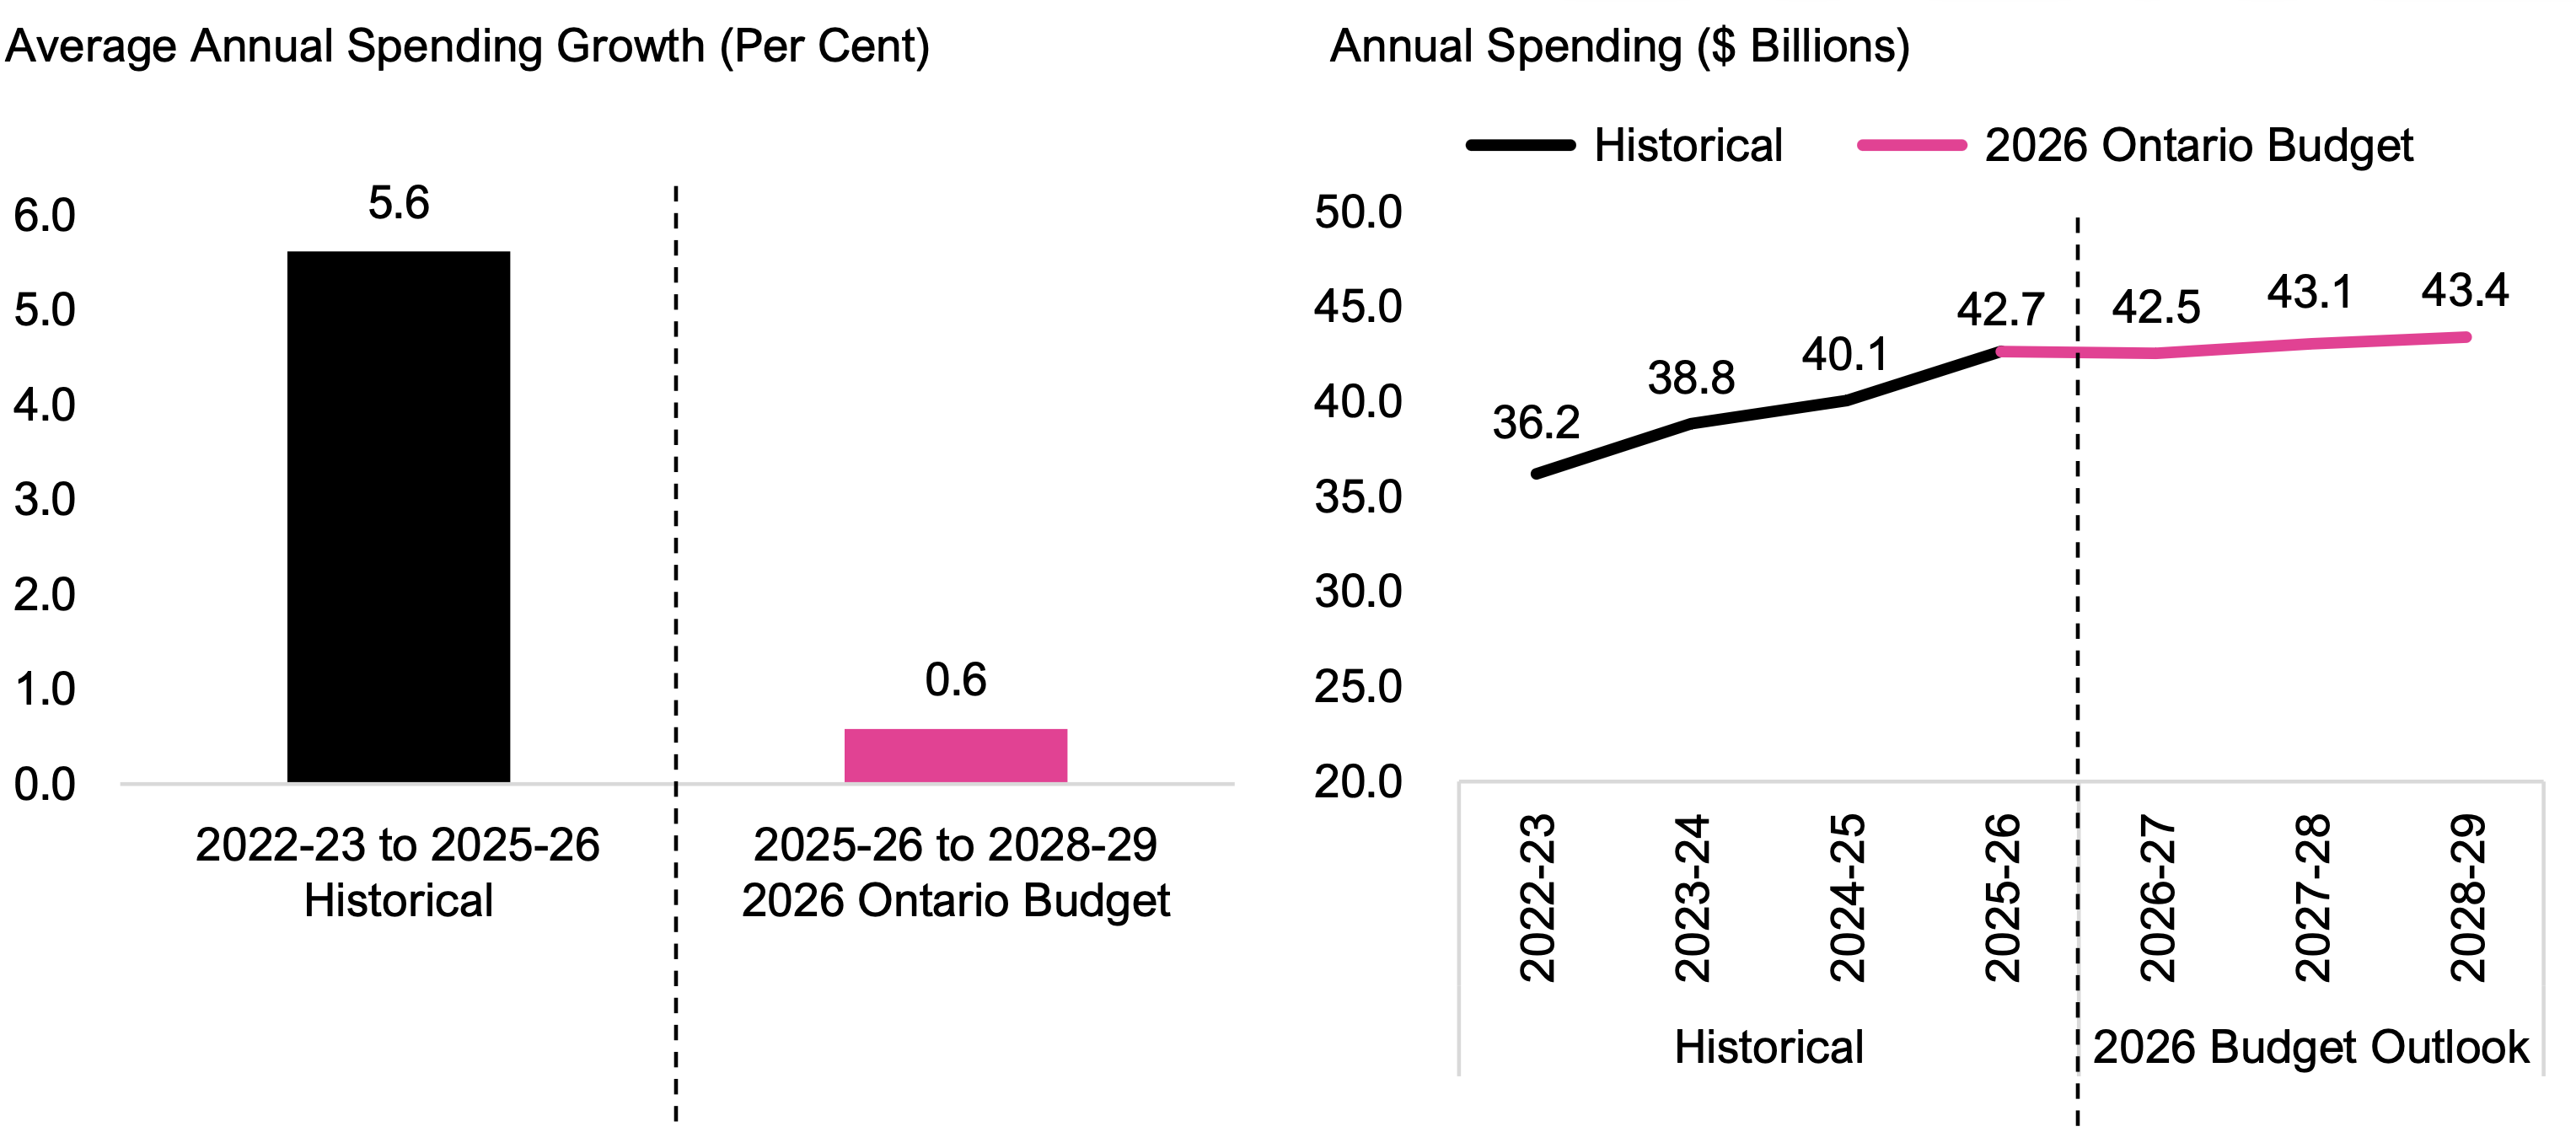
- In the 2026 Ontario Budget, the Province projects that Ministry of Education spending will increase from $42.7 billion in 2025-26 to $43.4 billion in 2028-29, representing an average annual growth rate of 0.6 per cent.
- This is a significantly slower pace than the 5.6 per cent average annual growth over the previous three years from 2022-23 to 2025-26.
- For context, over the 36-year period from 1990-91 to 2025-26, Ministry of Education spending grew at an average annual rate of 3.2 per cent. If the Province’s Ministry of Education spending plan in the 2026 budget is achieved, it would be the slowest three-year growth rate since 1995-96 to 1998-99.
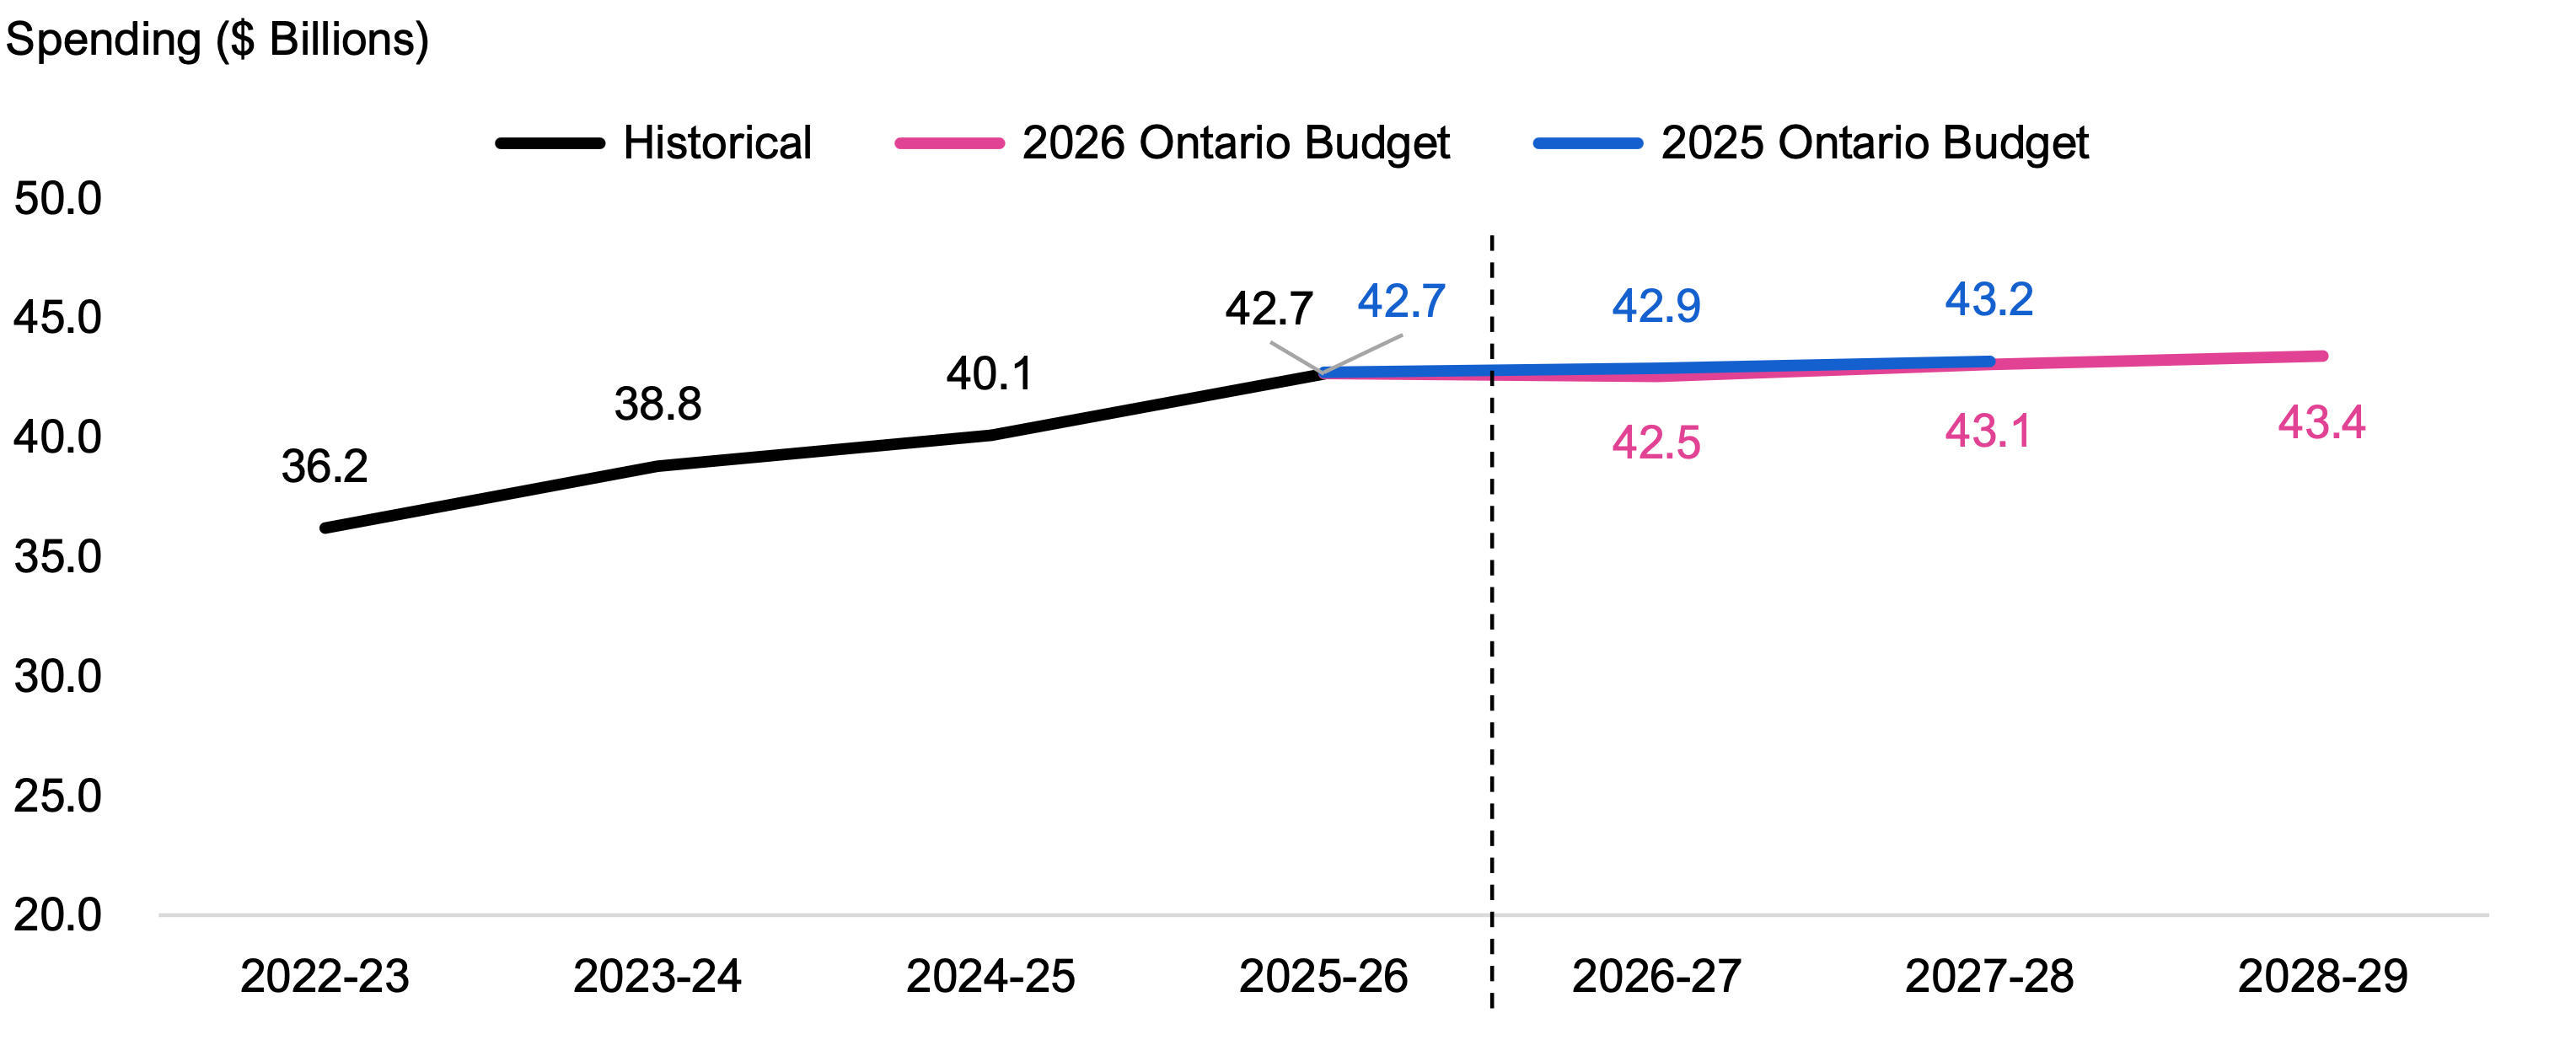
- Compared to the Ministry of Education spending plan in the 2025 Ontario Budget, the spending plan in the 2026 Ontario Budget has decreased by a total of $0.5 billion from 2025-26 to 2027-28. This includes spending reductions of $0.1 billion in 2025-26, $0.3 billion in 2026-27 and $0.1 billion in 2027-28.
- The FAO estimated Ministry of Education spending from 2026-27 to 2028-29 that would be required to maintain 2025-26 service levels. Also known as a cost driver projection, this scenario does not recommend how spending should change but serves as a benchmark to show whether the 2026 budget’s Ministry of Education spending plan is likely to maintain, improve or reduce the quality and accessibility of education services.
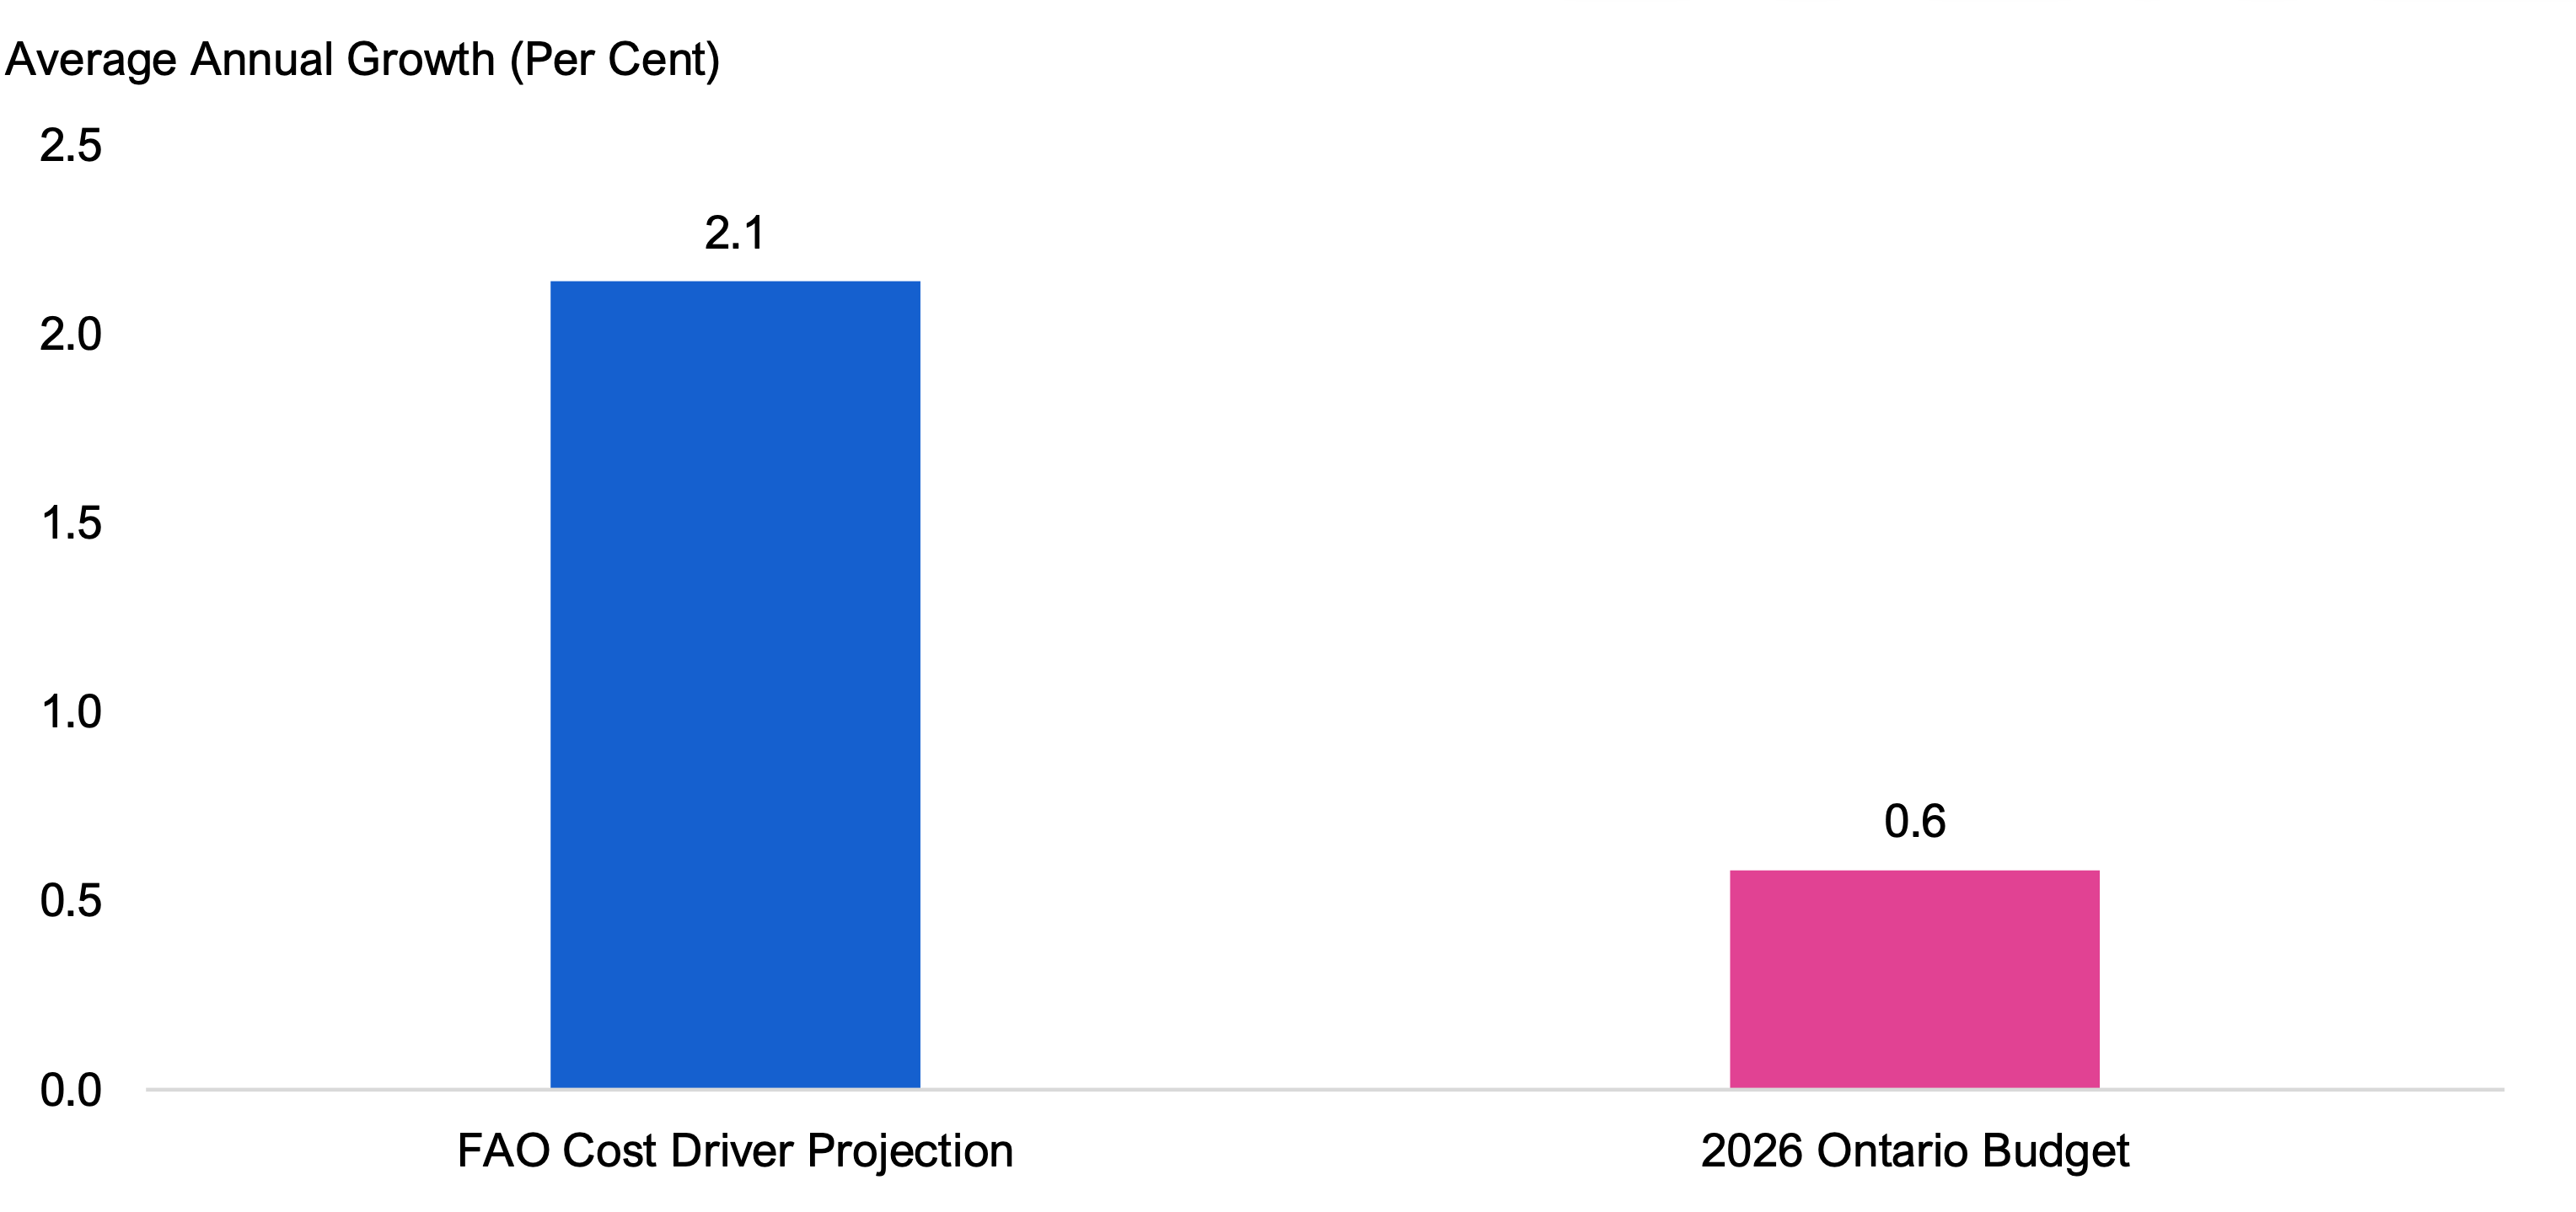
- Overall, the FAO estimates that Ministry of Education spending would need to grow by an average annual rate of 2.1 per cent over the next three years to maintain current service levels.
- The 2026 budget spending plan is below the FAO’s cost driver projection by $0.7 billion in 2026‑27, $1.2 billion in 2027-28 and $2.0 billion in 2028-29. This means that, to maintain current service levels, the Province will need to implement program efficiencies (i.e., provide the same level of services with less resources) and/or commit additional funding beyond what was planned in the 2026 Ontario Budget.
Spending Plan Analysis
Provincial School Board Operating Funding
- The Ministry of Education provides operating funding to school boards based on its estimate of required spending on teachers, transportation, facilities and other services.
- On an inflation-adjusted basis (i.e., real 2026-27 dollars), provincial operating funding to school boards was $15,140 per student in 2025-26, the second lowest level over the last 10 years, after 2024-25. Based on the 2026 budget spending plan, the FAO estimates that real provincial operating funding to school boards will decrease to $15,074 per student in 2026-27, $14,850 per student in 2027‑28 and $14,775 per student in 2028-29.
Licensed Child Care Funding
- The Ministry of Education administers and funds licensed child care programs in Ontario. The largest program is the federal-provincial Canada-wide Early Learning and Child Care (CWELCC) program, followed by other provincial subsidies for licensed child care, the Ontario Child Care Tax Credit, EarlyON child and family centres, and First Nations licensed child care.
- In 2025-26, there were an estimated 570,406 licensed child care spaces[1] in Ontario for children aged zero to 12, an increase of 87,265 spaces (18.1 per cent) since 2019-20. Between 2019-20 and 2025‑26, licensed child care spaces as a share of the Ontario population aged 12 and under increased from 24.3 per cent to 28.1 per cent.
- In 2022, the Province announced a five-year agreement with the federal government to lower child care fees to an average of $10 per day by September 2025 and create 86,000 new child care spaces for children under the age of six, for a total of 375,111 CWELCC spaces by the end of 2026. In December 2025, the Province and the federal government extended the agreement through 2026-27, with a revised commitment to maintain average fees at $19 per day through December 2026. Subsequently, in June 2026, the federal government extended funding for the program to 2027-28, without a further commitment to change average daily fees.
- The FAO estimates that the CWELCC program will cost $5.2 billion in 2026-27, rising to $5.5 billion in 2027-28 and $5.6 billion in 2028-29. This estimate assumes that average fees are maintained at $19 per day and that the target to enroll 375,111 licensed child care spaces in the CWELCC program is achieved in 2026.
- Based on estimated provincial funding levels and committed federal funding, the FAO estimates a CWELCC program funding shortfall of $0.3 billion in 2026-27, $0.6 billion in 2027-28 and $4.8 billion in 2028-29.
- Alternatively, if average fees are lowered to $10 per day starting in April 2027, the FAO estimates that the CWELCC program would cost $6.3 billion in 2027-28 and $6.4 billion in 2028-29. As a result, the FAO estimates that there would be a CWELCC program funding shortfall of $1.4 billion in 2027-28 and $5.6 billion in 2028-29.
Interprovincial Comparison
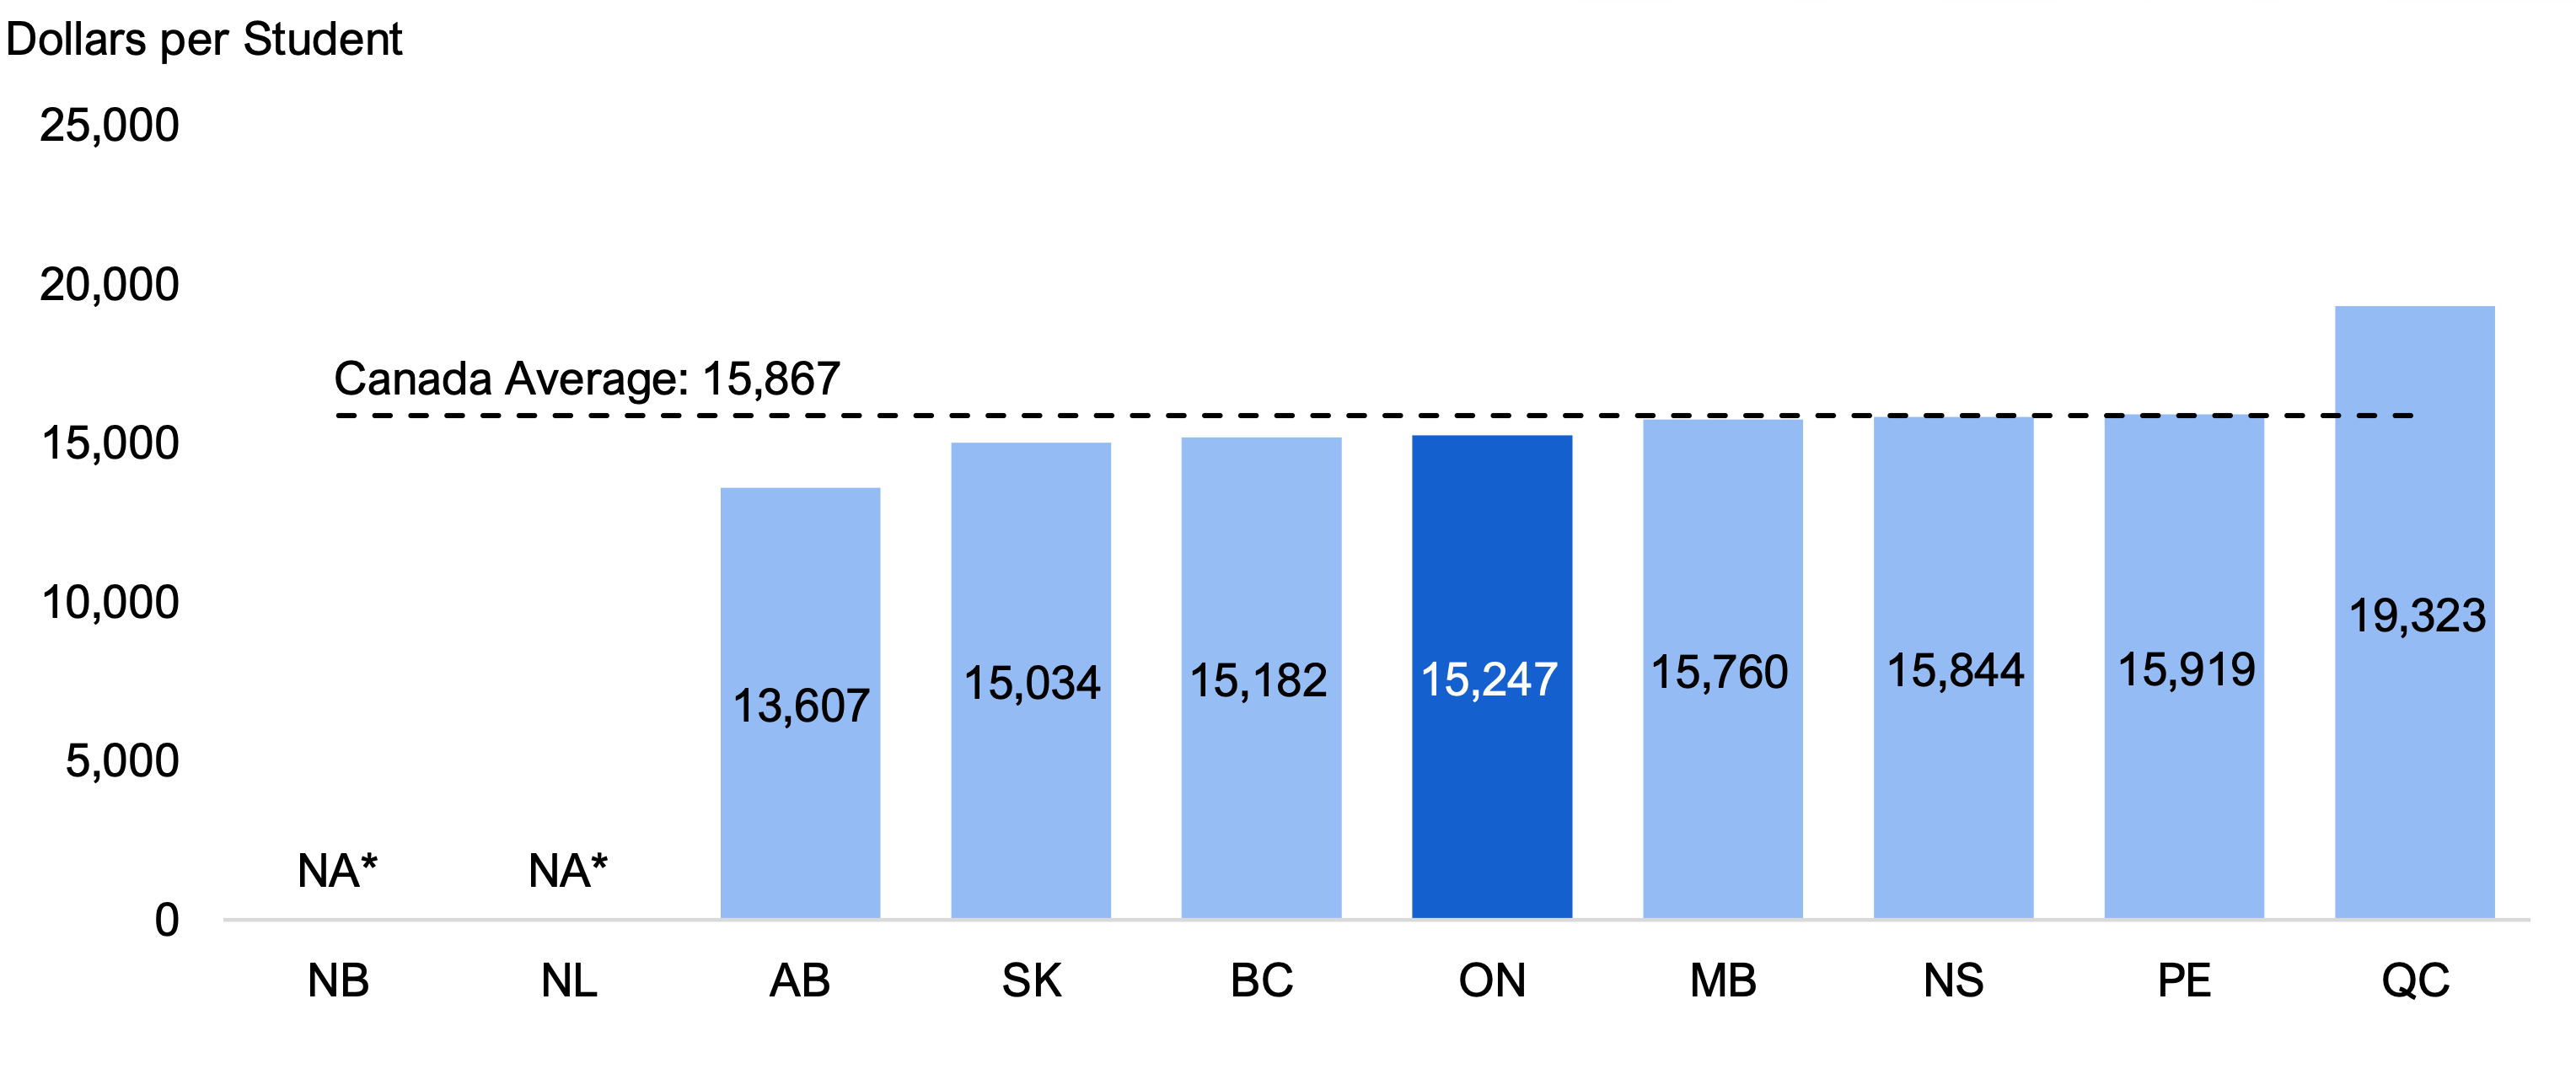
- In 2023-24, Ontario’s school board spending per student was $15,247, below the national average of $15,867. Compared to other large provinces, Ontario’s spending was higher than in British Columbia ($15,182) and Alberta ($13,607) but lower than in Quebec ($19,323).
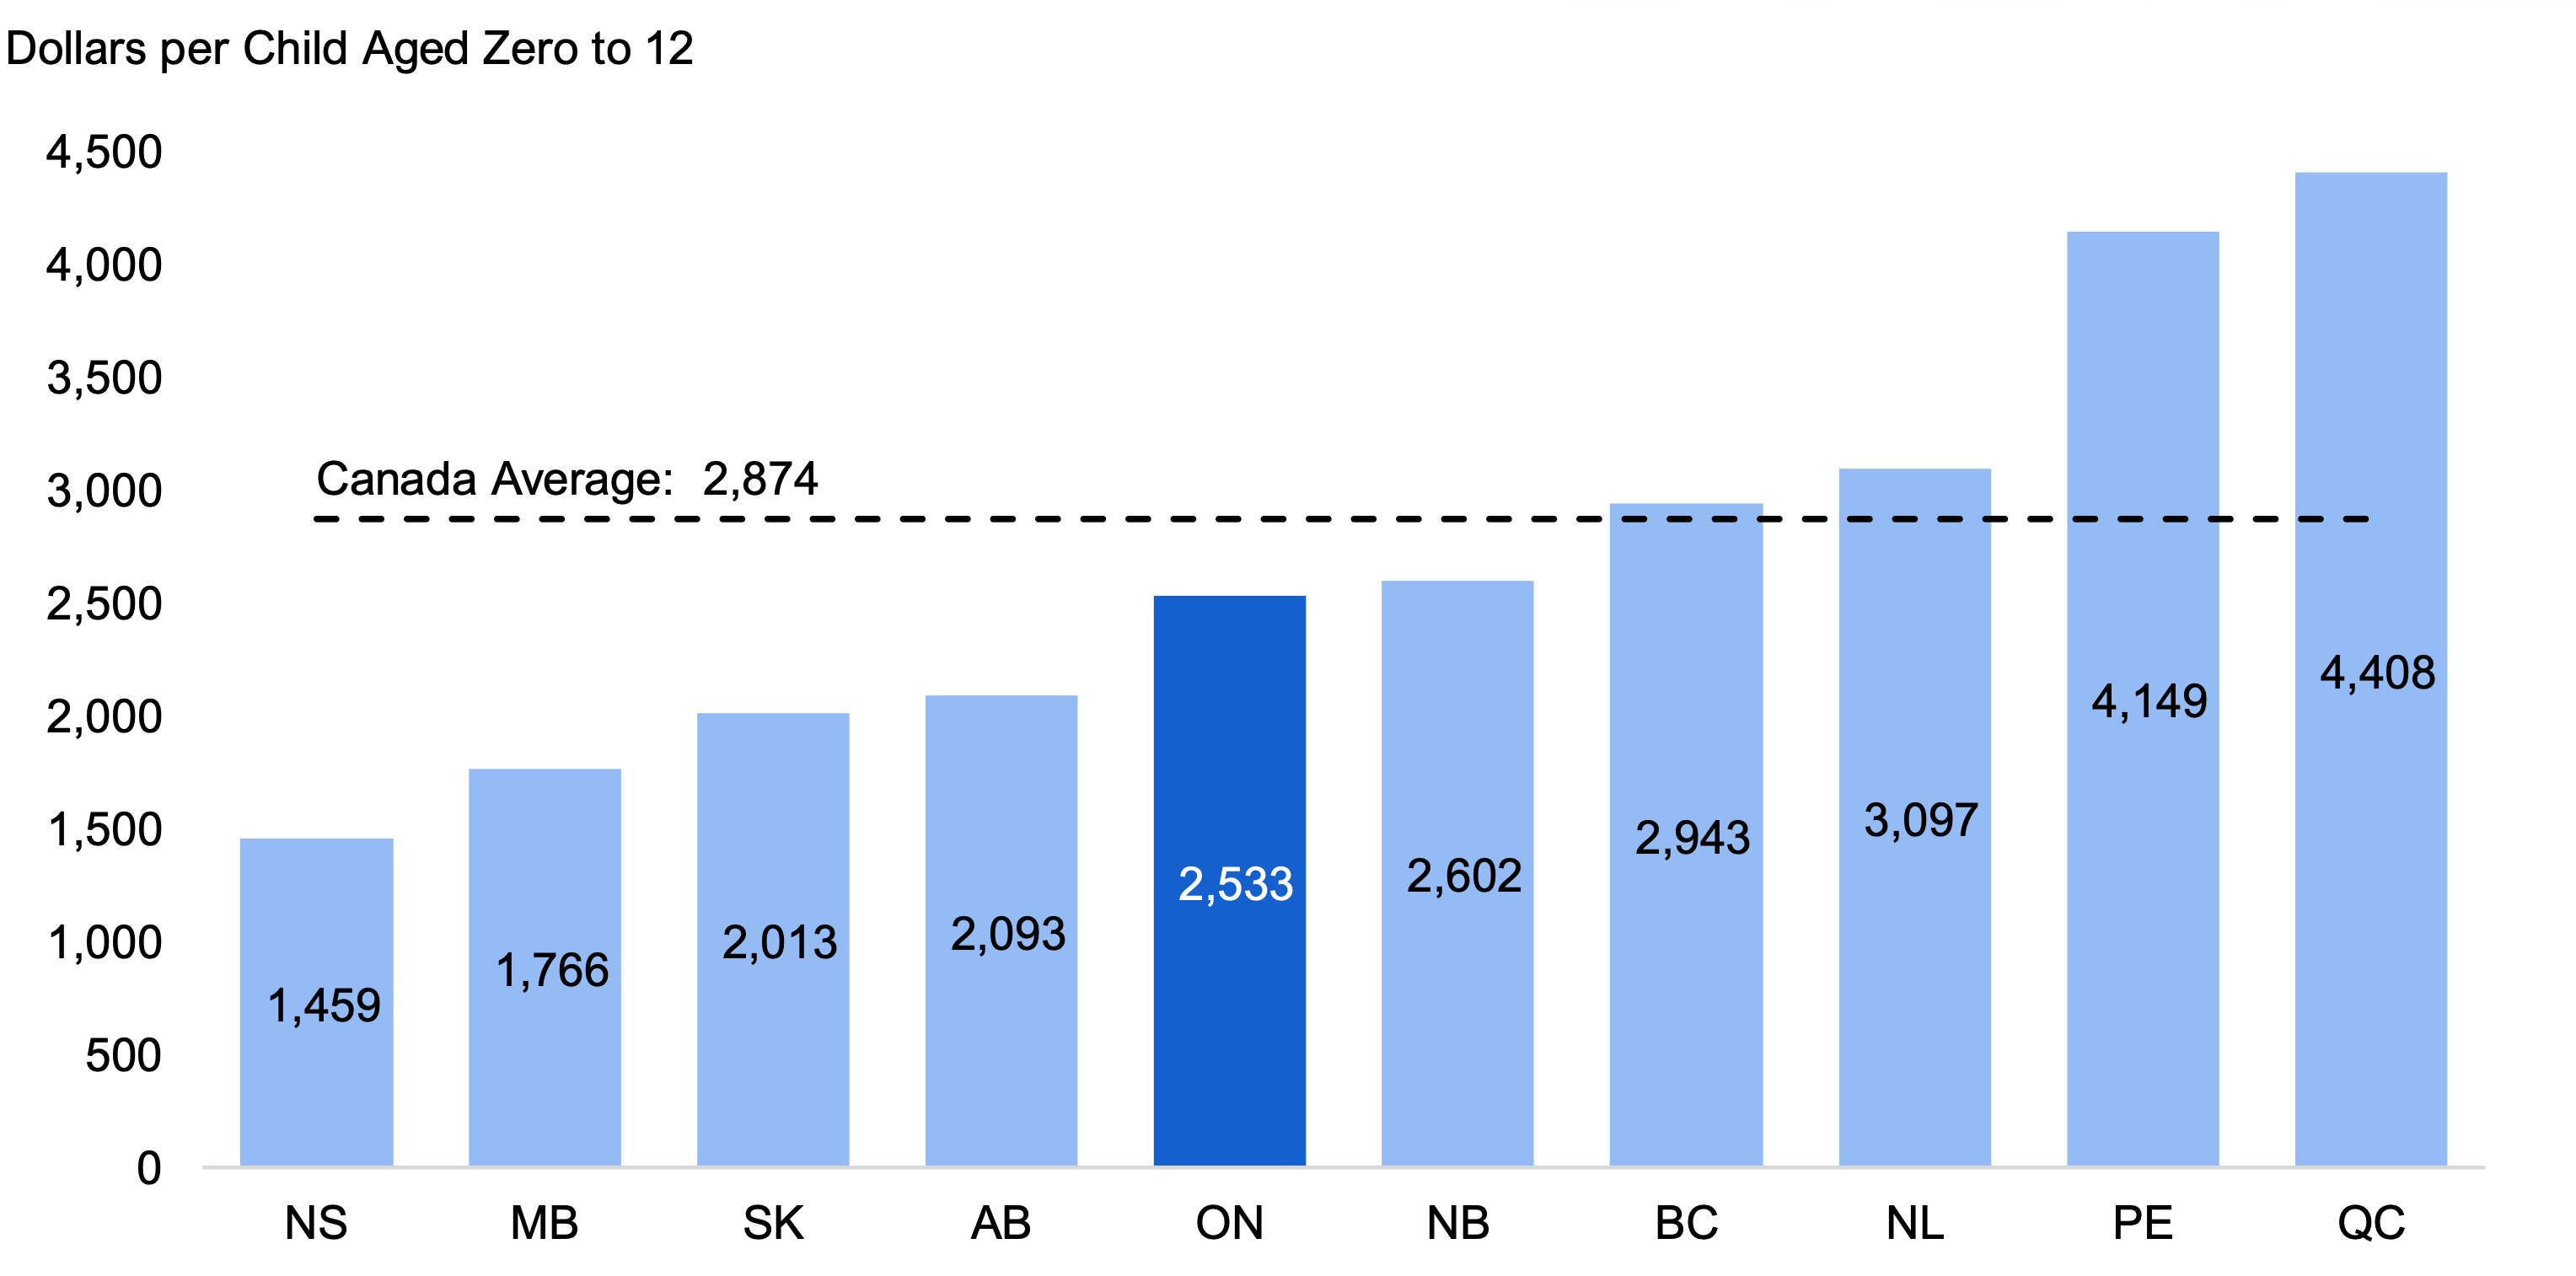
- In 2024-25, Ontario’s child care spending per child aged zero to 12 was $2,533, below the national average of $2,874. Ontario’s spending was higher than in Alberta ($2,093) but lower than in British Columbia ($2,943) and Quebec ($4,408).
2. Introduction
This report reviews the Government of Ontario’s (the Province’s) Ministry of Education spending plan as outlined in the 2026 Ontario Budget.
This analysis was undertaken in response to research requests from Members of Provincial Parliament and is part of a series that reviews the 2026 spending plans for five ministries: Children, Community and Social Services; Colleges, Universities, Research Excellence and Security; Education; Health; and Long-Term Care.
The report is organized as follows:
- Chapter 3 reviews the Province’s Ministry of Education spending plan in the 2026 Ontario Budget against historical ministry spending, the spending plan from the 2025 Ontario Budget, and estimated cost drivers. The cost driver analysis includes the FAO’s projection for Ministry of Education spending required to maintain current service levels.
- Chapter 4 estimates the impact of the Province’s spending plan on two program areas: school board operations and licensed child care.
- Chapter 5 provides an interprovincial comparison of school board spending per student and child care spending per child.
For additional information on the Ministry of Education’s spending plan, see the FAO’s 2026-27 Expenditure Estimates Dashboard, which allows users to review the ministry’s 2026-27 Expenditure Estimates to the standard account level of detail and compare 2026-27 requested spending against spending between 2021‑22 and 2025-26.
3. Spending Plan Overview
In the 2026 Ontario Budget, the Province projects that Ministry of Education spending will increase from $42.7 billion in 2025-26 to $43.4 billion in 2028-29, representing an average annual growth rate of 0.6 per cent. This is a significantly slower pace than the 5.6 per cent average annual growth over the previous three years from 2022-23 to 2025-26.
Figure 3.1 Ministry of Education spending plan in the 2026 Ontario Budget
Note: Historical values are not restated for program transfers or reclassifications, if any. 2025-26 historical value is an FAO estimate of unaudited spending and may contain differences from the final audited spending reported in the 2025-26 Public Accounts of Ontario.
Source: Ontario Public Accounts, the 2026 Ontario Budget and FAO analysis.
Accessible version
| 2022-23 to 2025-26 Historical | 2025-26 to 2028-29 2026 Ontario Budget |
|---|---|
| 5.6 | 0.6 |
| Historical | 2026 Ontario Budget | ||
|---|---|---|---|
| Historical | 2022-23 | 36.2 | |
| Historical | 2023-24 | 38.8 | |
| Historical | 2024-25 | 40.1 | |
| Historical | 2025-26 | 42.7 | |
| 2026 Budget Outlook | 2026-27 | 42.5 | |
| 2026 Budget Outlook | 2027-28 | 43.1 | |
| 2026 Budget Outlook | 2028-29 | 43.4 |
For context, over the 36-year period from 1990-91 to 2025-26, Ministry of Education spending grew at an average annual rate of 3.2 per cent.[2] The Province’s spending plan in the 2026 budget calls for significantly slower spending growth compared to the 36-year average and if achieved, would be the slowest three-year growth rate since 1995-96 to 1998-99.
2026 Spending Plan Compared to 2025 Spending Plan
Compared to the Ministry of Education spending plan in the 2025 Ontario Budget, the ministry’s spending plan in the 2026 Ontario Budget has decreased by a total of $0.5 billion from 2025-26 to 2027-28. This includes spending reductions of $0.1 billion in 2025-26, $0.3 billion in 2026-27 and $0.1 billion in 2027-28.
Figure 3.2 Ministry of Education spending plan in the 2025 and 2026 Ontario Budgets
Note: Historical values are not restated for program transfers or reclassifications, if any. 2025-26 historical value is an FAO estimate of unaudited spending and may contain differences from the final audited spending reported in the 2025-26 Public Accounts of Ontario.
Source: Ontario Public Accounts, 2025 Ontario Budget, 2026 Ontario Budget and FAO analysis.
Accessible version
| Historical | 2025 Ontario Budget | 2026 Ontario Budget | |
|---|---|---|---|
| 2022-23 | 36.2 | ||
| 2023-24 | 38.8 | ||
| 2024-25 | 40.1 | ||
| 2025-26 | 42.7 | 42.7 | |
| 2026-27 | 42.9 | 42.5 | |
| 2027-28 | 43.2 | 43.1 | |
| 2028-29 | 43.4 |
Spending Plan Compared to Cost Drivers
At the request of the Members of Provincial Parliament, the FAO estimated Ministry of Education spending over the next three years that would be required to maintain 2025-26 service levels. Also known as a cost driver projection, this scenario does not recommend how spending should change but serves as a benchmark to show whether the 2026 budget’s Ministry of Education spending plan is likely to maintain, improve or reduce the quality and accessibility of education services.
Overall, the FAO estimates that Ministry of Education spending would need to grow by an average annual rate of 2.1 per cent over the next three years to maintain current ministry service levels. The components of the FAO’s cost driver projection vary by program area:
- School board operations: The FAO estimates that spending would need to grow by an average annual rate of 2.6 per cent over the next three years to maintain service levels. This estimate is based on projected elementary and secondary school enrolment, and education sector inflation, which reflects the rising costs of compensation, classroom supplies and services.
- Child care: The FAO estimates that operating spending would need to grow by an average annual rate of 2.3 per cent over the next three years to maintain service levels. This estimate is based on projected growth in the child-aged population as well as inflation, which reflects the rising costs of compensation, supplies, facility costs and daily child care fees.
- Other ministry programs: Other programs include ministry operations, the Ontario Teachers’ Pension Plan (OTPP), school board capital and other education programs. The FAO estimates that spending would need to decrease by an average annual rate of 1.5 per cent over the next three years to maintain service levels. (In 2025-26, OTPP spending included one-time retroactive spending related to labour agreements.[3])
Figure 3.3 Comparing Ministry of Education spending growth, FAO cost driver projection vs. 2026 Ontario Budget, 2025-26 to 2028-29
Source: 2026 Ontario Budget and FAO analysis.
Accessible version
| FAO Cost Driver Projection | 2026 Ontario Budget |
|---|---|
| 2.1 | 0.6 |
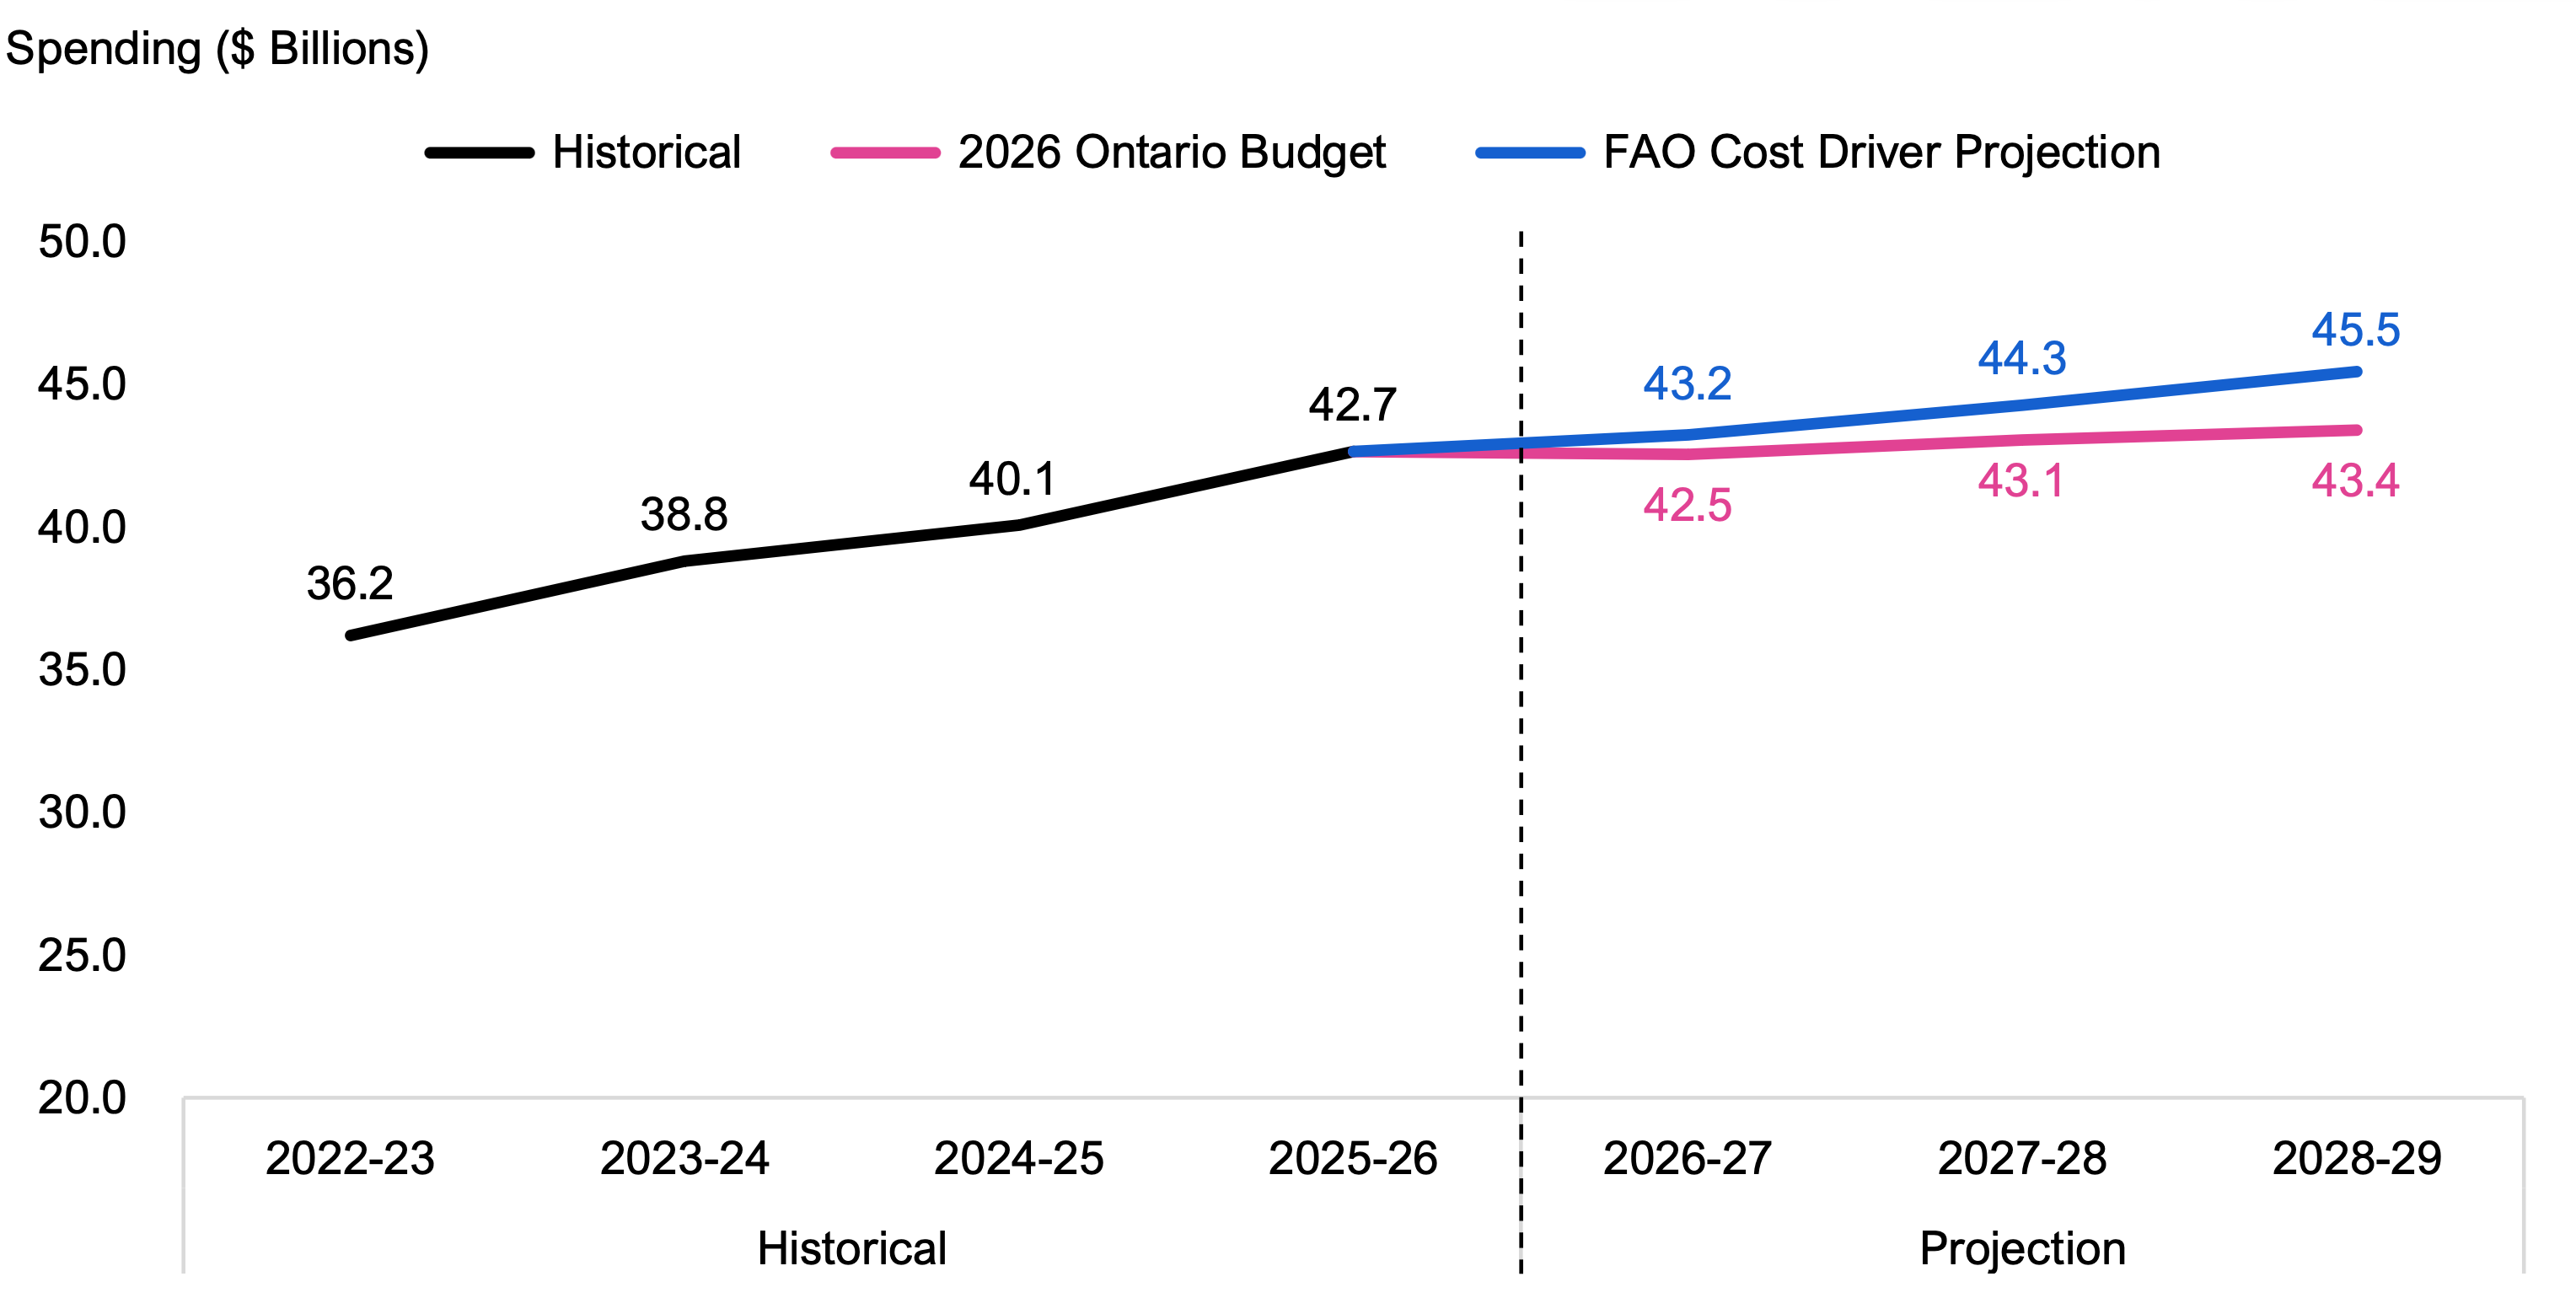
As noted above, in the 2026 budget, the Province projects that Ministry of Education spending will increase at an average annual rate of 0.6 per cent from 2025-26 to 2028-29. Compared to the FAO’s cost driver projection, this results in a funding shortfall of $0.7 billion in 2026-27, $1.2 billion in 2027-28 and $2.0 billion in 2028-29.
Figure 3.4 Comparing Ministry of Education spending projections, FAO cost driver projection vs. 2026 Ontario Budget
Note: Historical values are not restated for program transfers or reclassifications, if any. 2025-26 historical value is an FAO estimate of unaudited spending and may contain differences from the final audited spending reported in the 2025-26 Public Accounts of Ontario.
Source: Ontario Public Accounts, 2026 Ontario Budget and FAO analysis.
Accessible version
| Historical | FAO Cost Driver Projection | 2026 Ontario Budget | ||
|---|---|---|---|---|
| Historical | 2022-23 | 36.2 | ||
| Historical | 2023-24 | 38.8 | ||
| Historical | 2024-25 | 40.1 | ||
| Historical | 2025-26 | 42.7 | ||
| Projection | 2026-27 | 43.2 | 42.5 | |
| Projection | 2027-28 | 44.3 | 43.1 | |
| Projection | 2028-29 | 45.5 | 43.4 |
The funding shortfall means that, to maintain current service levels, the Province will need to implement program efficiencies (i.e., provide the same level of services with less resources) and/or commit additional funding beyond what was planned in the 2026 Ontario Budget.
4. Spending Plan Analysis
At the request of the Members of Provincial Parliament, this chapter reviews the FAO’s estimate of the potential impact of the Ministry of Education spending plan in the 2026 budget on two key program areas: school board operations and child care.
Provincial School Board Operating Funding
School boards’ operating expenditures are primarily funded from transfers from the Ministry of Education,[4] with a smaller share from other sources such as fundraising, investments and international student fees. School boards have flexibility to allocate funds according to local priorities, provided they balance their budgets and meet ministry reporting requirements.
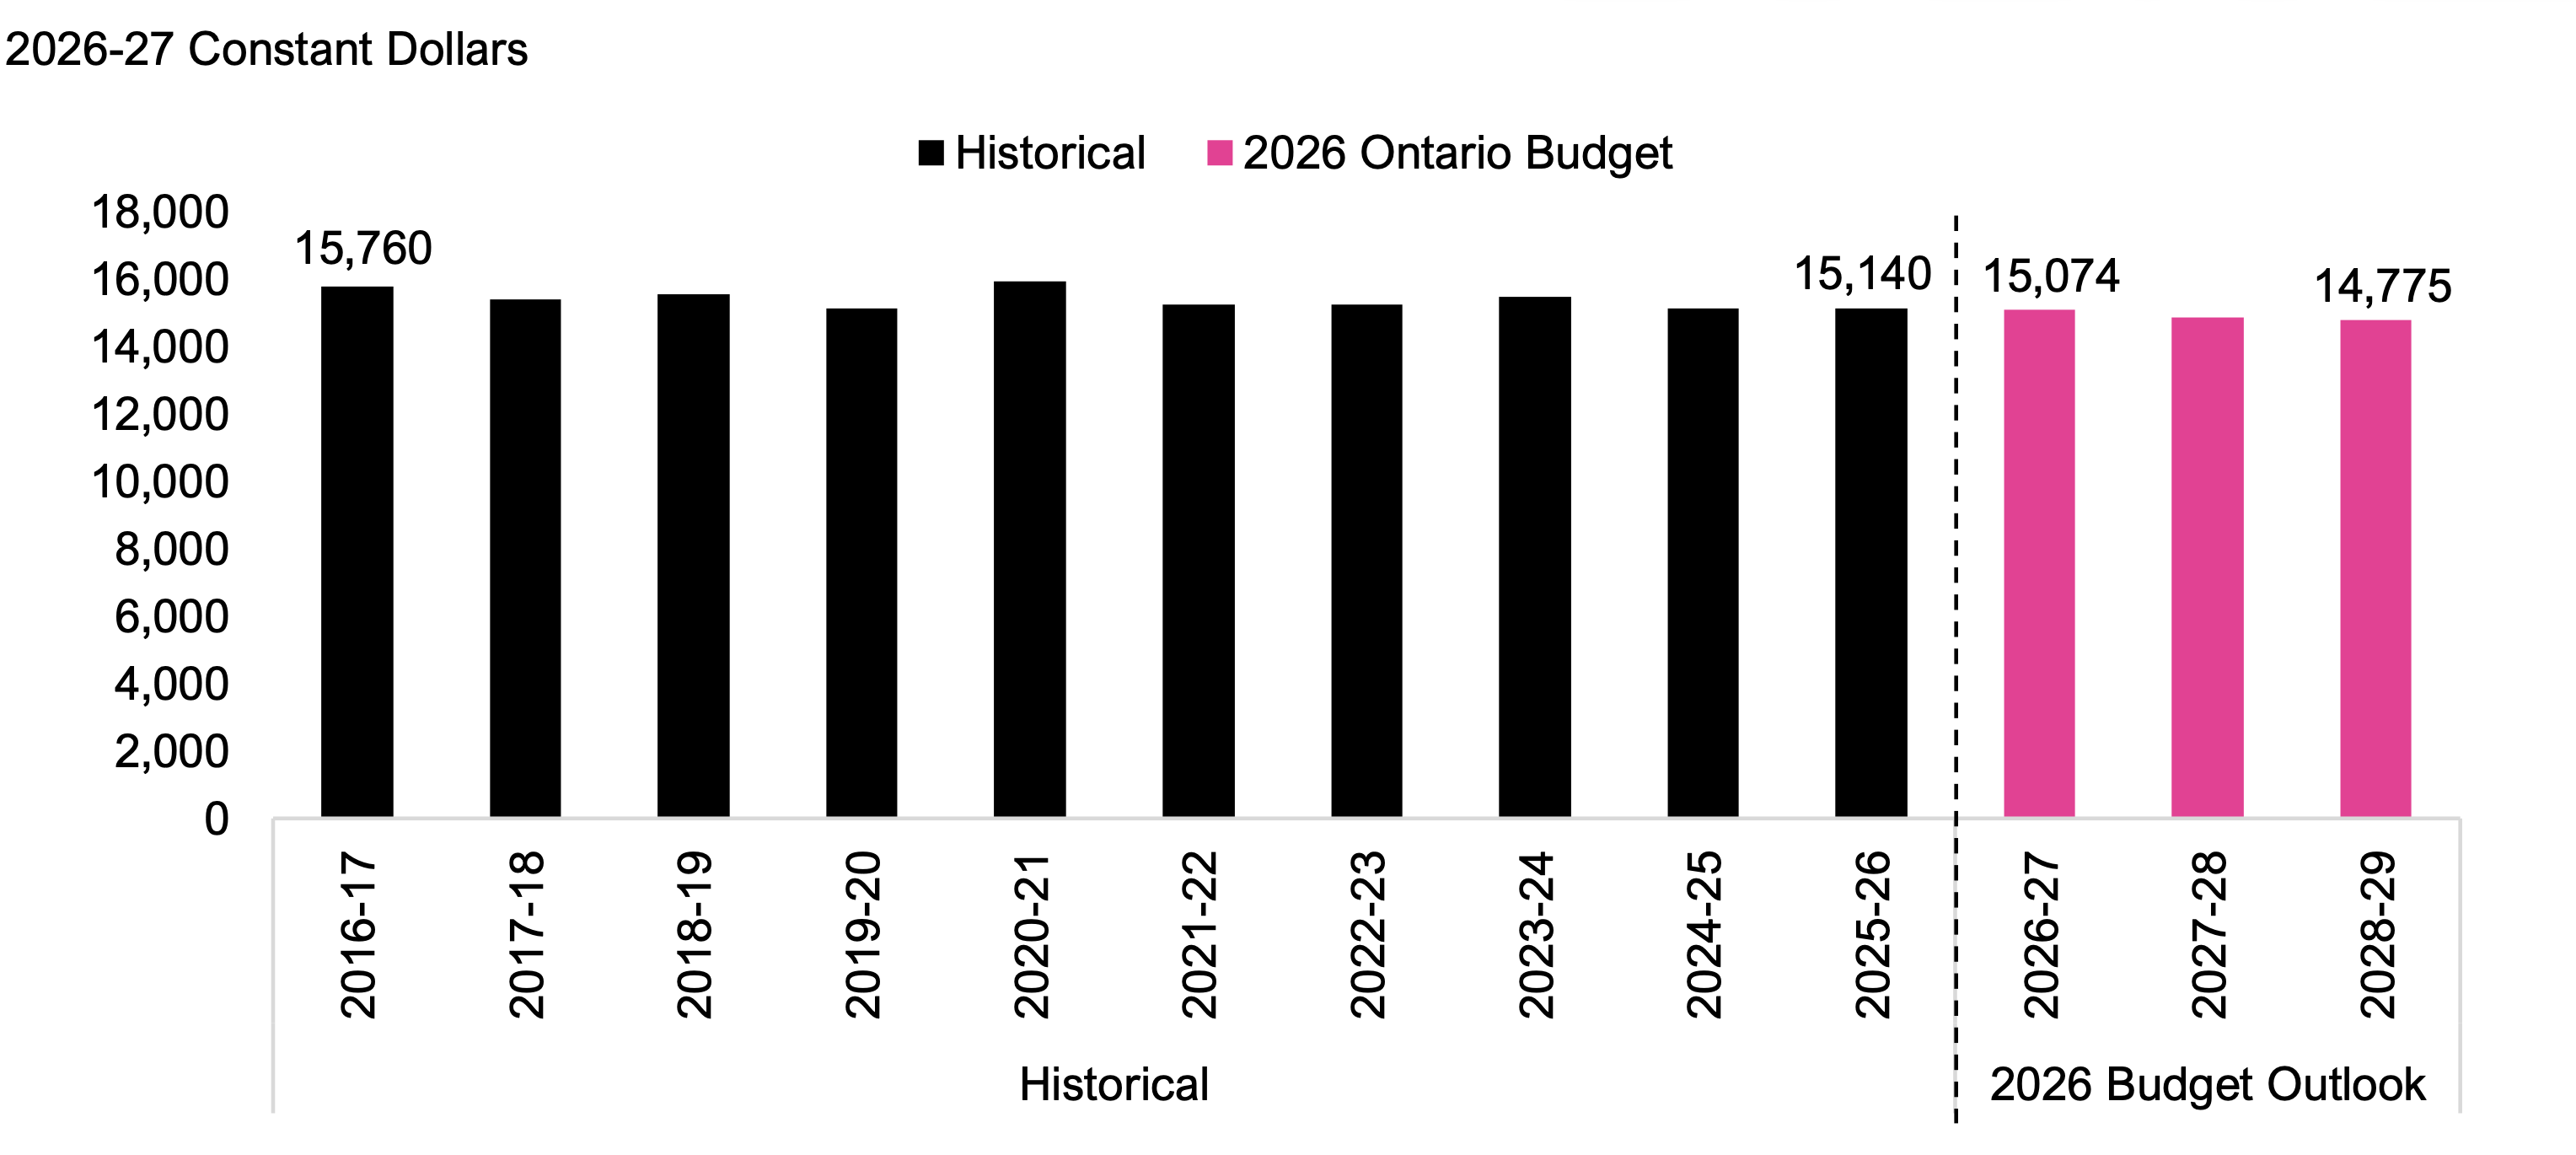
The Ministry of Education provides operating funding to school boards based on its estimate of required spending on teachers, transportation, facilities and other services.[5] On an inflation-adjusted basis (i.e., real 2026-27 dollars), per-student provincial operating funding to school boards was $15,140 in 2025-26, the second lowest level over the last 10 years, after 2024-25. Based on the Ministry of Education spending plan in the 2026 budget, the FAO estimates that real provincial operating funding to school boards will decline to $15,074 per student in 2026-27, $14,850 per student in 2027-28 and $14,775 per student in 2028-29.
Figure 4.1 Historical and projected real per-student provincial school board operating funding, 2016-17 to 2028-29
Source: FAO analysis of Ontario Public Accounts, 2026 Ontario Budget and information provided by the Province.
Accessible version
| Historical | 2026 Ontario Budget | ||
|---|---|---|---|
| Historical | 2016-17 | 15,760 | |
| Historical | 2017-18 | 15,389 | |
| Historical | 2018-19 | 5,543 | |
| Historical | 2019-20 | 15,142 | |
| Historical | 2020-21 | 15,931 | |
| Historical | 2021-22 | 15,248 | |
| Historical | 2022-23 | 15,227 | |
| Historical | 2023-24 | 15,483 | |
| Historical | 2024-25 | 15,128 | |
| Historical | 2025-26 | 15,140 | |
| 2026 Budget Outlook | 2026-27 | 15,074 | |
| 2026 Budget Outlook | 2027-28 | 14,850 | |
| 2026 Budget Outlook | 2028-29 | 14,775 |
Licensed Child Care Funding
The Ministry of Education administers and funds licensed child care programs in Ontario. The largest program is the federal-provincial Canada-wide Early Learning and Child Care (CWELCC) program, followed by other provincial subsidies for licensed child care, the Ontario Child Care Tax Credit, EarlyON child and family centres, and First Nations licensed child care.
Licensed child care spaces
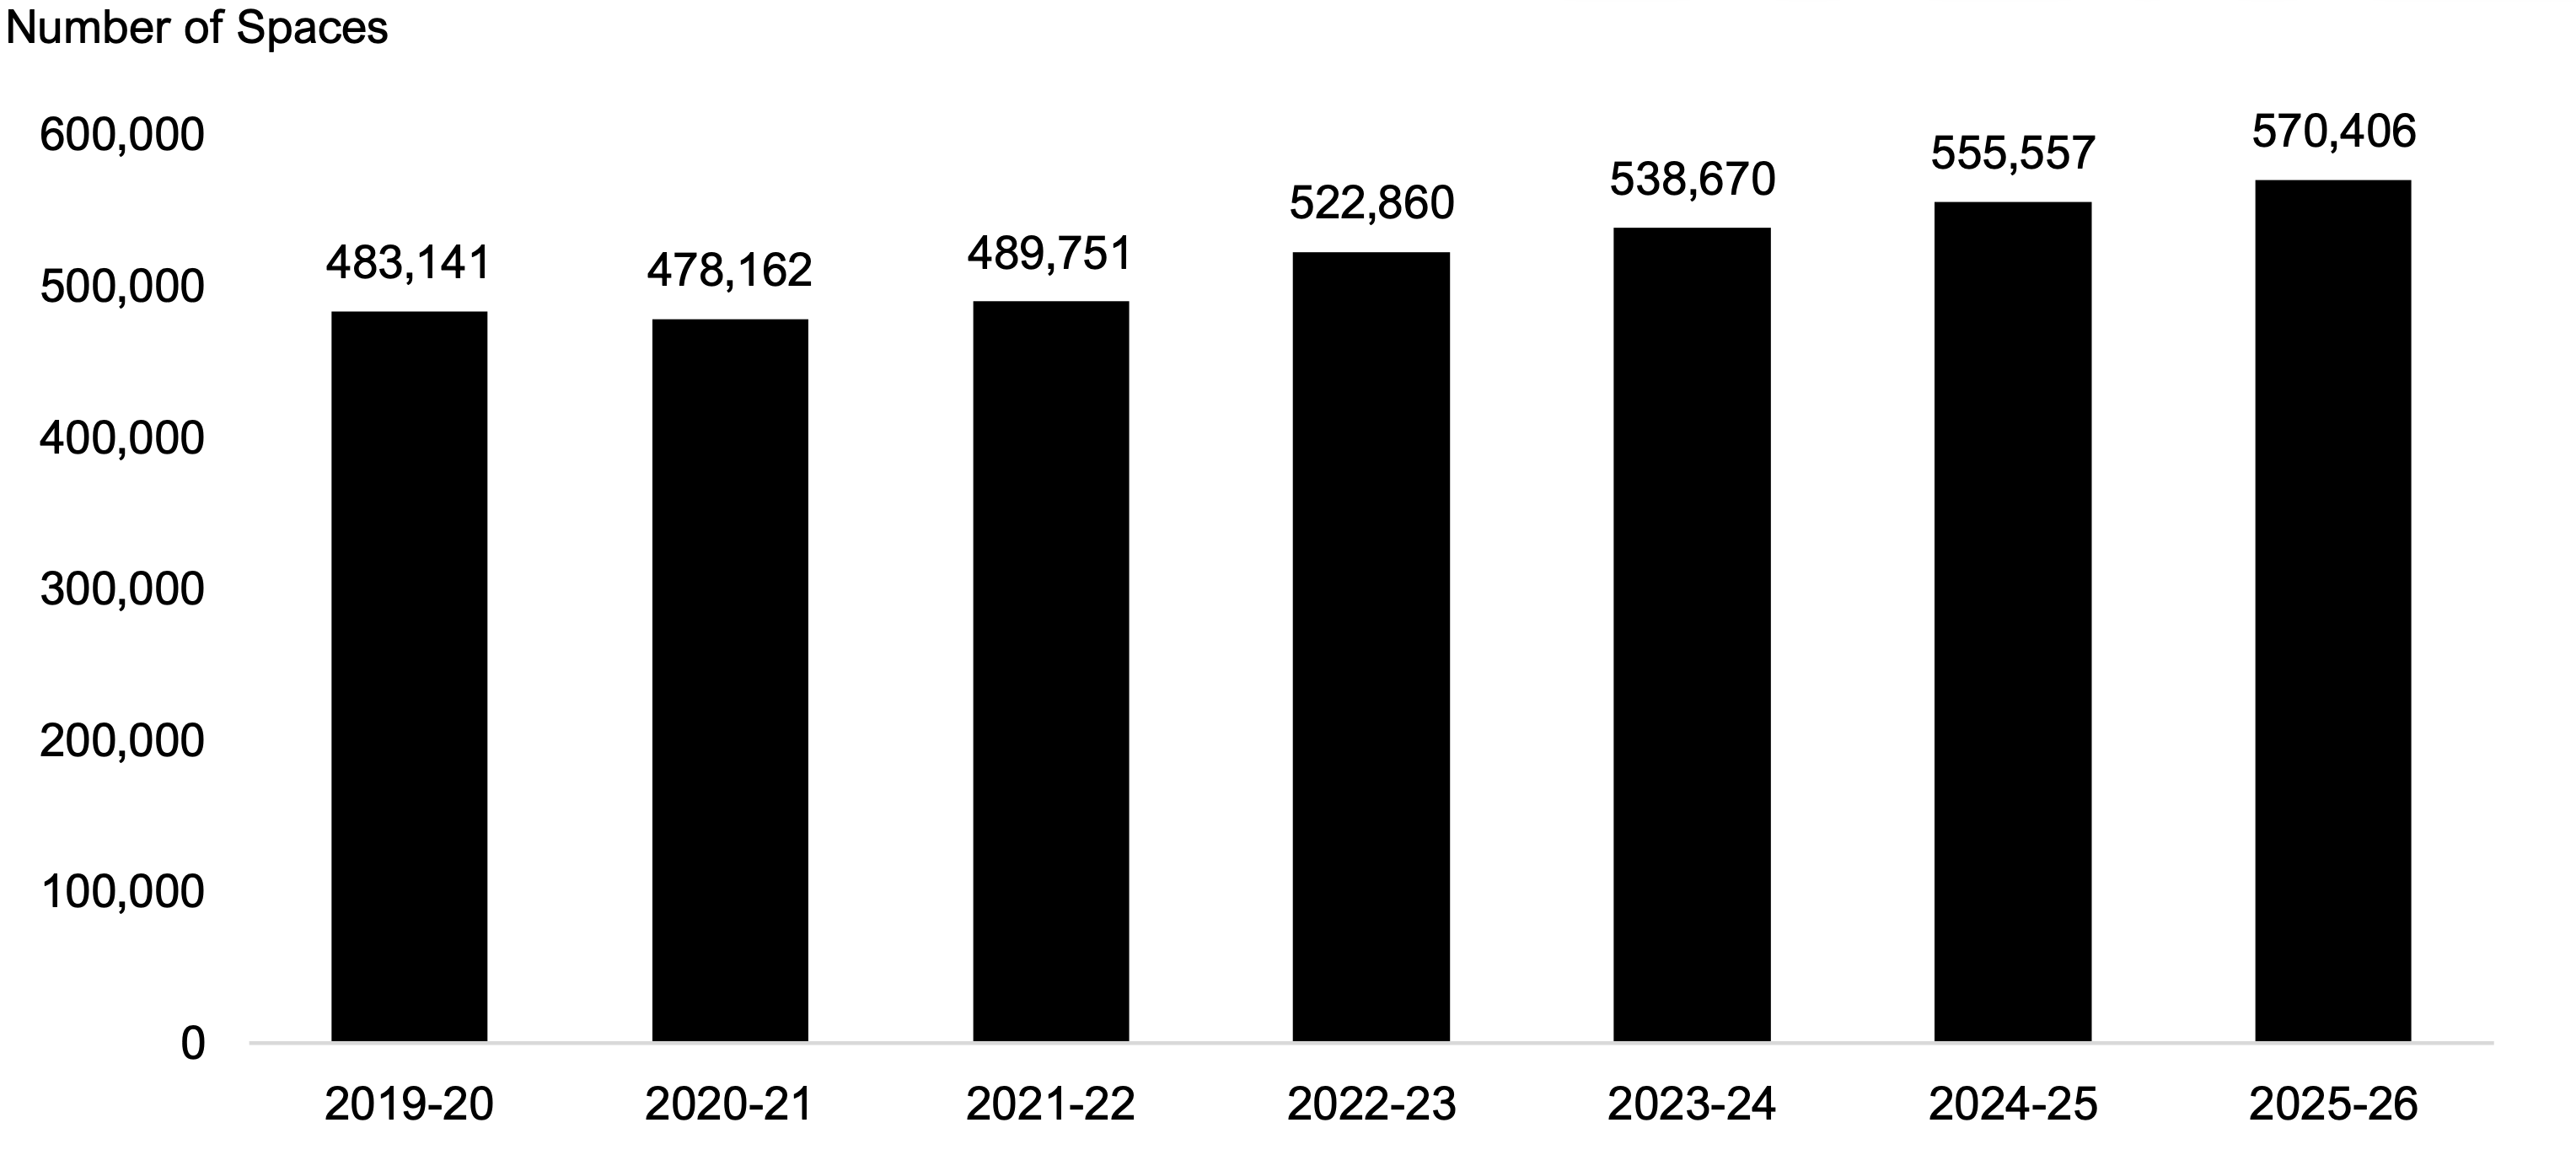
In 2025-26, there were an estimated 570,406 licensed child care spaces[6] in Ontario for children aged zero to 12. The total number of licensed child care spaces has increased by 87,265 spaces (18.1 per cent) since 2019-20.
Figure 4.2 Licensed child care spaces in Ontario, 2019-20 to 2025-26
Note: 2025-26 value reflects actual licensed child care spaces in centres and an FAO estimate of licensed home child care enrolment.
Source: FAO analysis of information provided by the Province.
Accessible version
| Number of Spaces | |
|---|---|
| 2019-20 | 483,141 |
| 2020-21 | 478,162 |
| 2021-22 | 489,751 |
| 2022-23 | 522,860 |
| 2023-24 | 538,670 |
| 2024-25 | 555,557 |
| 2025-26 | 570,406 |
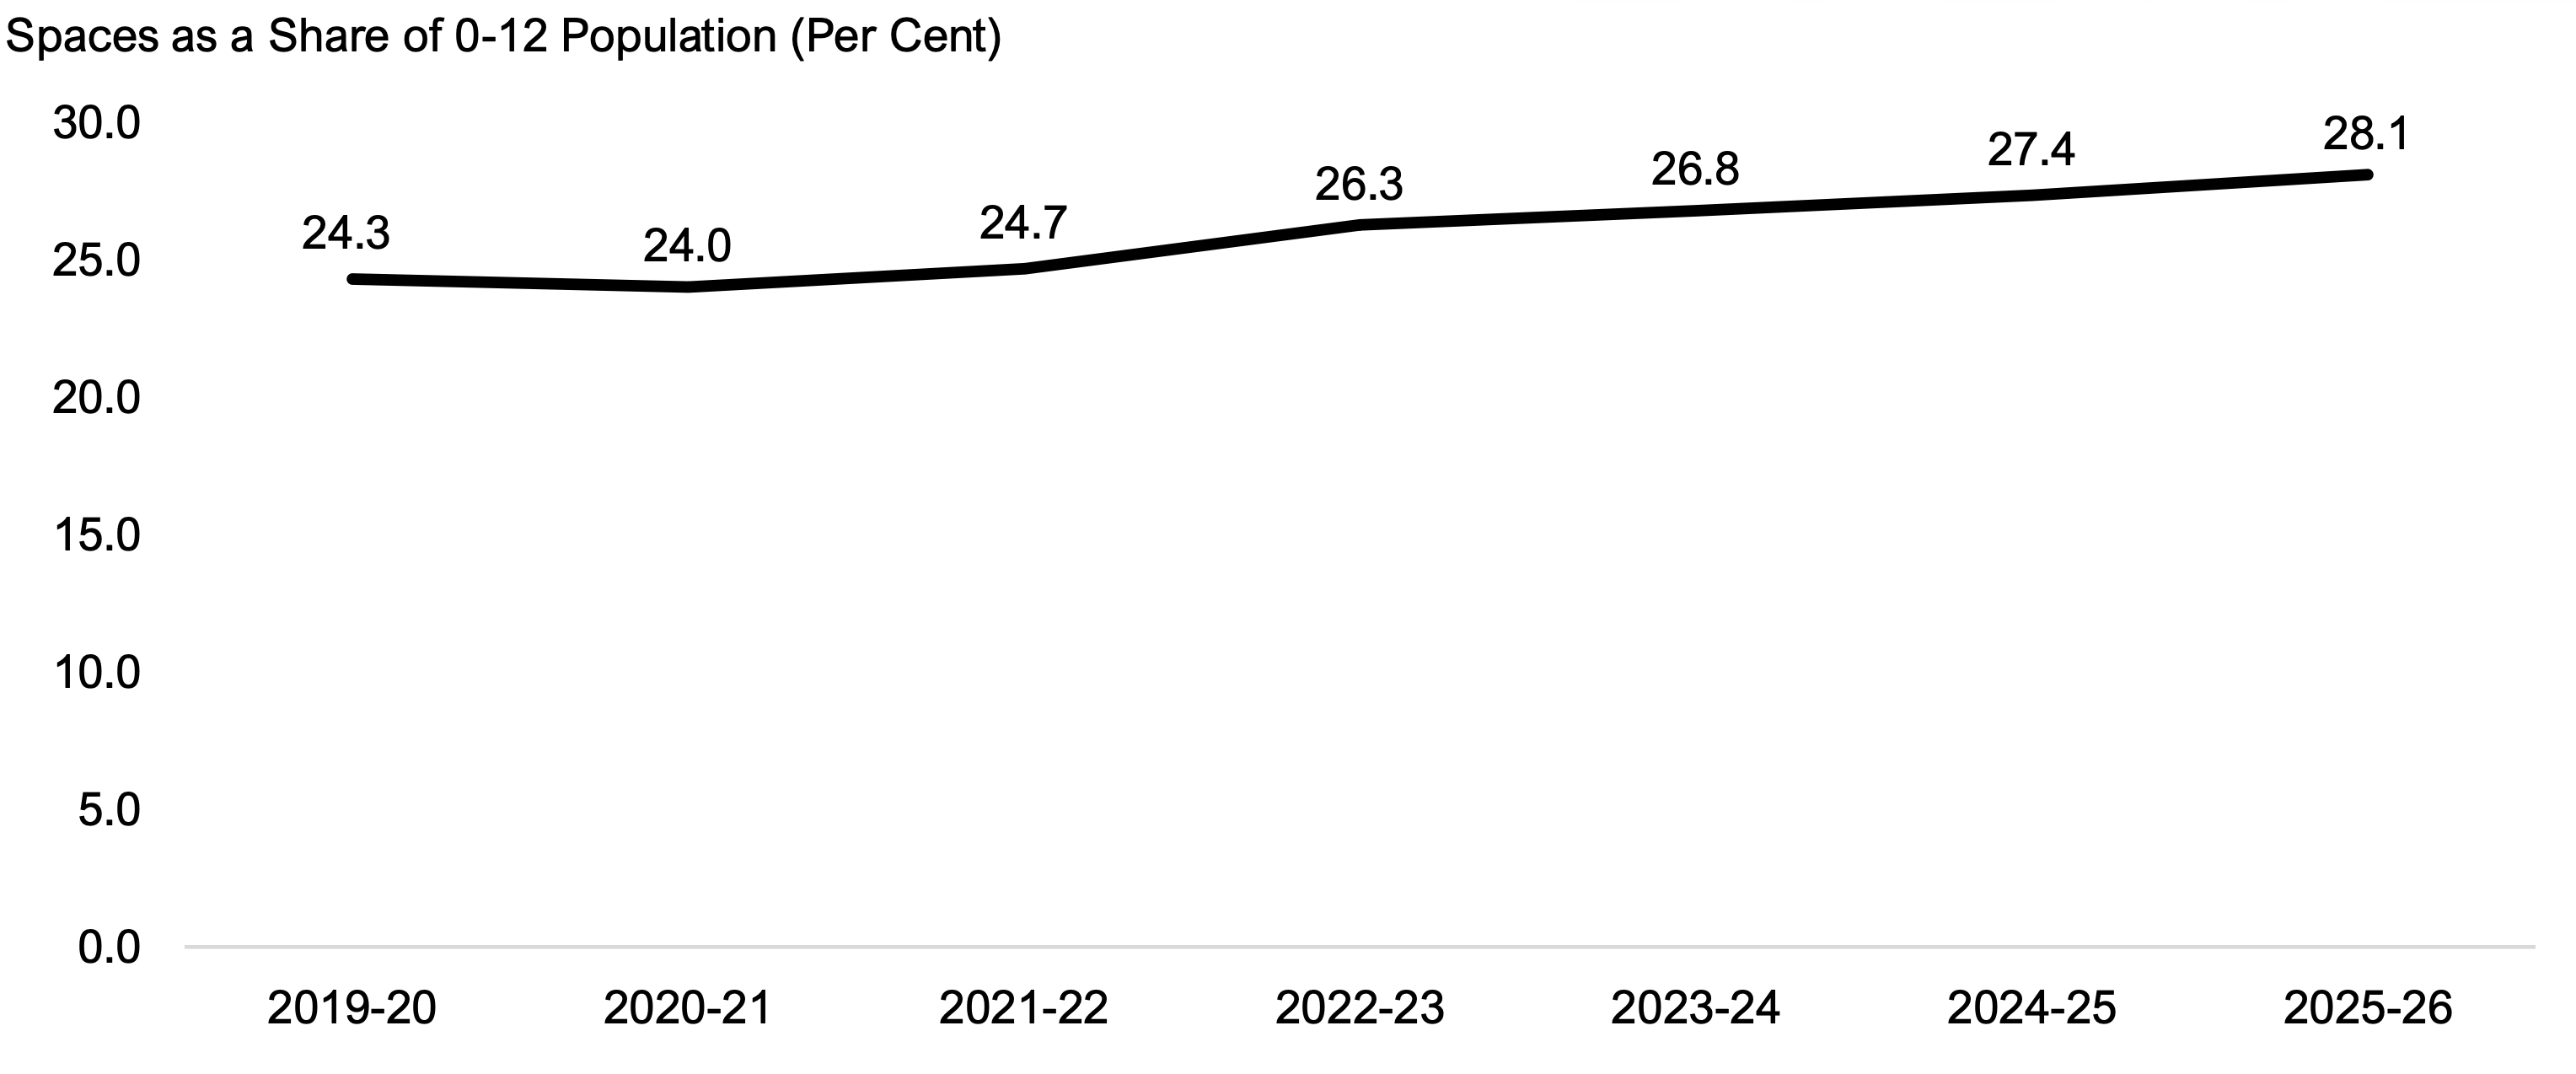
Between 2019-20 and 2025-26, licensed child care spaces as a share of the Ontario population aged 12 and under increased from 24.3 per cent to 28.1 per cent.
Figure 4.3 Licensed child care spaces as a share of the Ontario population aged 12 and under, 2019-20 to 2025-26
Note: 2025-26 value reflects actual licensed child care spaces in centres and an FAO estimate of licensed home child care enrolment.
Source: FAO analysis of information provided by the Province.
Accessible version
| Spaces as a Share of 0-12 Population (Per Cent) | |
|---|---|
| 2019-20 | 24.3 |
| 2020-21 | 24.0 |
| 2021-22 | 24.7 |
| 2022-23 | 26.3 |
| 2023-24 | 26.8 |
| 2024-25 | 27.4 |
| 2025-26 | 28.1 |
Canada-wide Early Learning and Child Care Program
In 2022, the Province announced a five-year agreement with the federal government to lower child care fees to an average of $10 per day by September 2025[7] and create 86,000 new child care spaces for children under the age of six, for a total of 375,111 CWELCC spaces by the end of 2026. In December 2025, the Province and the federal government extended the agreement through 2026-27, with a revised commitment to maintain average fees at $19 per day through December 2026. Subsequently, in June 2026, the federal government extended funding for the program to 2027-28, without a further commitment to change average daily fees.[8]
Assuming that average fees are maintained at $19 per day and that the target to enrol 375,111 licensed child care spaces in the CWELCC program is achieved in 2026, the FAO estimates that the CWELCC program will cost $5.2 billion in 2026-27, rising to $5.6 billion in 2028-29.
As a result, based on estimated provincial funding levels and committed federal funding, the FAO estimates a CWELCC program funding shortfall of $0.3 billion in 2026-27, $0.6 billion in 2027-28 and $4.8 billion in 2028‑29.
| Historical | FAO Estimate | ||||||
|---|---|---|---|---|---|---|---|
| 2022-23 | 2023-24 | 2024-25 | 2025-26 | 2026-27 | 2027-28 | 2028-29 | |
| CWELCC Child Care Spaces* | 301,740 | 314,682 | 325,398 | 340,049 | 375,111 | 375,111 | 375,111 |
| Average Daily Fee* ($) | 36 | 23 | 23 | 19 | 19 | 19 | 19 |
| Program Cost** ($ billion) | 1.3 | 2.1 | 2.9 | 4.8 | 5.2 | 5.5 | 5.6 |
| Provincial Funding*** ($ billion) | <0.1 | 0.1 | 0.1 | 0.8 | 0.8 | 0.8 | 0.8 |
| Committed Federal Funding**** ($ billion) | 1.3 | 2.0 | 2.8 | 4.0 | 4.1 | 4.1 | – |
| Funding Shortfall ($ billion) | – | – | – | – | 0.3 | 0.6 | 4.8 |
Alternatively, if average fees are lowered to $10 per day starting in April 2027, the FAO estimates that the CWELCC program would cost $6.3 billion in 2027-28 and $6.4 billion in 2028-29. As a result, the FAO estimates that there would be a CWELCC program funding shortfall of $1.4 billion in 2027-28 and $5.6 billion in 2028-29.
5. Interprovincial Comparison
At the request of the Members of Provincial Parliament, this chapter compares Ontario’s school board spending per student and child care spending per child with spending in other provinces.
School Board Spending
In 2023-24, Ontario’s school board spending per student was $15,247, which was $621 below the national average of $15,867. Compared to other large provinces, Ontario’s spending was higher than in British Columbia ($15,182) and Alberta ($13,607) but lower than in Quebec ($19,323).
Figure 5.1 School board spending per student by province in 2023-24
* Comparable data not available. Note: Canada average excludes New Brunswick, Newfoundland and Labrador, and the territories. Ontario school board spending per student differs from Figure 4.1, which shows per student provincial operating funding to Ontario school boards in real (inflation adjusted) 2026-27 dollars.
Source: Statistics Canada, Table 10-10-0019-01 and Table 37-10-0007-01 and FAO analysis.
Accessible version
| Province | School board spending per student ($) |
|---|---|
| NB | NA* |
| NL | NA* |
| AB | 13,607 |
| SK | 15,034 |
| BC | 15,182 |
| ON | 15,247 |
| MB | 15,760 |
| NS | 15,844 |
| PE | 15,919 |
| QC | 19,323 |
| Canada Average | 15,867 |
Child Care Spending
In 2024-25, Ontario had the fifth lowest child care spending per child aged zero to 12 among the provinces. Ontario’s child care spending per child was $2,533, which was $340 below the national average of $2,874. Compared to other large provinces, Ontario’s spending was higher than in Alberta ($2,093) but lower than in British Columbia ($2,943) and Quebec ($4,408).
Figure 5.2 Child care spending per child aged zero to 12 by province in 2024-25
Note: Child care spending excludes kindergarten programs. Information compiled directly from provincial public accounts. No adjustments were made to improve comparability across provinces. Canada average excludes territories.
Source: FAO analysis based on provincial public accounts and the Atkinson Centre’s 2023 Early Childhood Education Report.
Accessible version
| Province | Child care spending per child aged zero to 12 ($) |
|---|---|
| NS | 1,459 |
| MB | 1,766 |
| SK | 2,013 |
| AB | 2,093 |
| ON | 2,533 |
| NB | 2,602 |
| C | 2,943 |
| NL | 3,097 |
| PE | 4,149 |
| QC | 4,408 |
| Canada Average | 2,874 |
Footnotes
[1] Represents licensed child care spaces in centres and licensed home child care enrolment.
[2] FAO, Government Spending Trends: 1990 to 2023 and FAO calculations.
[3] Excluding the one-time OTPP adjustment in 2025-26, the FAO estimates that other ministry programs would need to grow by 1.7 per cent over the next three years to maintain service levels.
[4] For more information, see FAO, Ontario School Boards: Enrolment, Finances and Student Outcomes.
[5] These funds are primarily allocated through the Core Education Funding (Core Ed) program and the Responsive Education Programs (REP). The Core Ed program provides funding to school boards for teachers, administration, school operations and maintenance, supplies and equipment, pupil transportation, and other needs. The REP provides additional funding for specific government priorities such as mental health supports, literacy programs and equity initiatives.
[6] Represents licensed child care spaces in centres and licensed home child care enrolment.
[7] The commitment to reduce CWELCC average daily fees to $10 per day was subsequently revised to the end of March 2026.
[8] In June 2026, the federal government announced additional spending of up to $5.4 billion for the CWELCC program across all provinces and territories over 2026-27 and 2027-28. See Minister of Jobs and Families announces new funding to maintain affordable early learning and child care in Canada.