

1. Summary
At the request of Members of Provincial Parliament, this report reviews the Government of Ontario’s (the Province’s) health sector spending plan as outlined in the 2026 Ontario Budget. Health sector spending consists of the combined spending by the Ministries of Health and Long-Term Care.
Spending Plan Overview
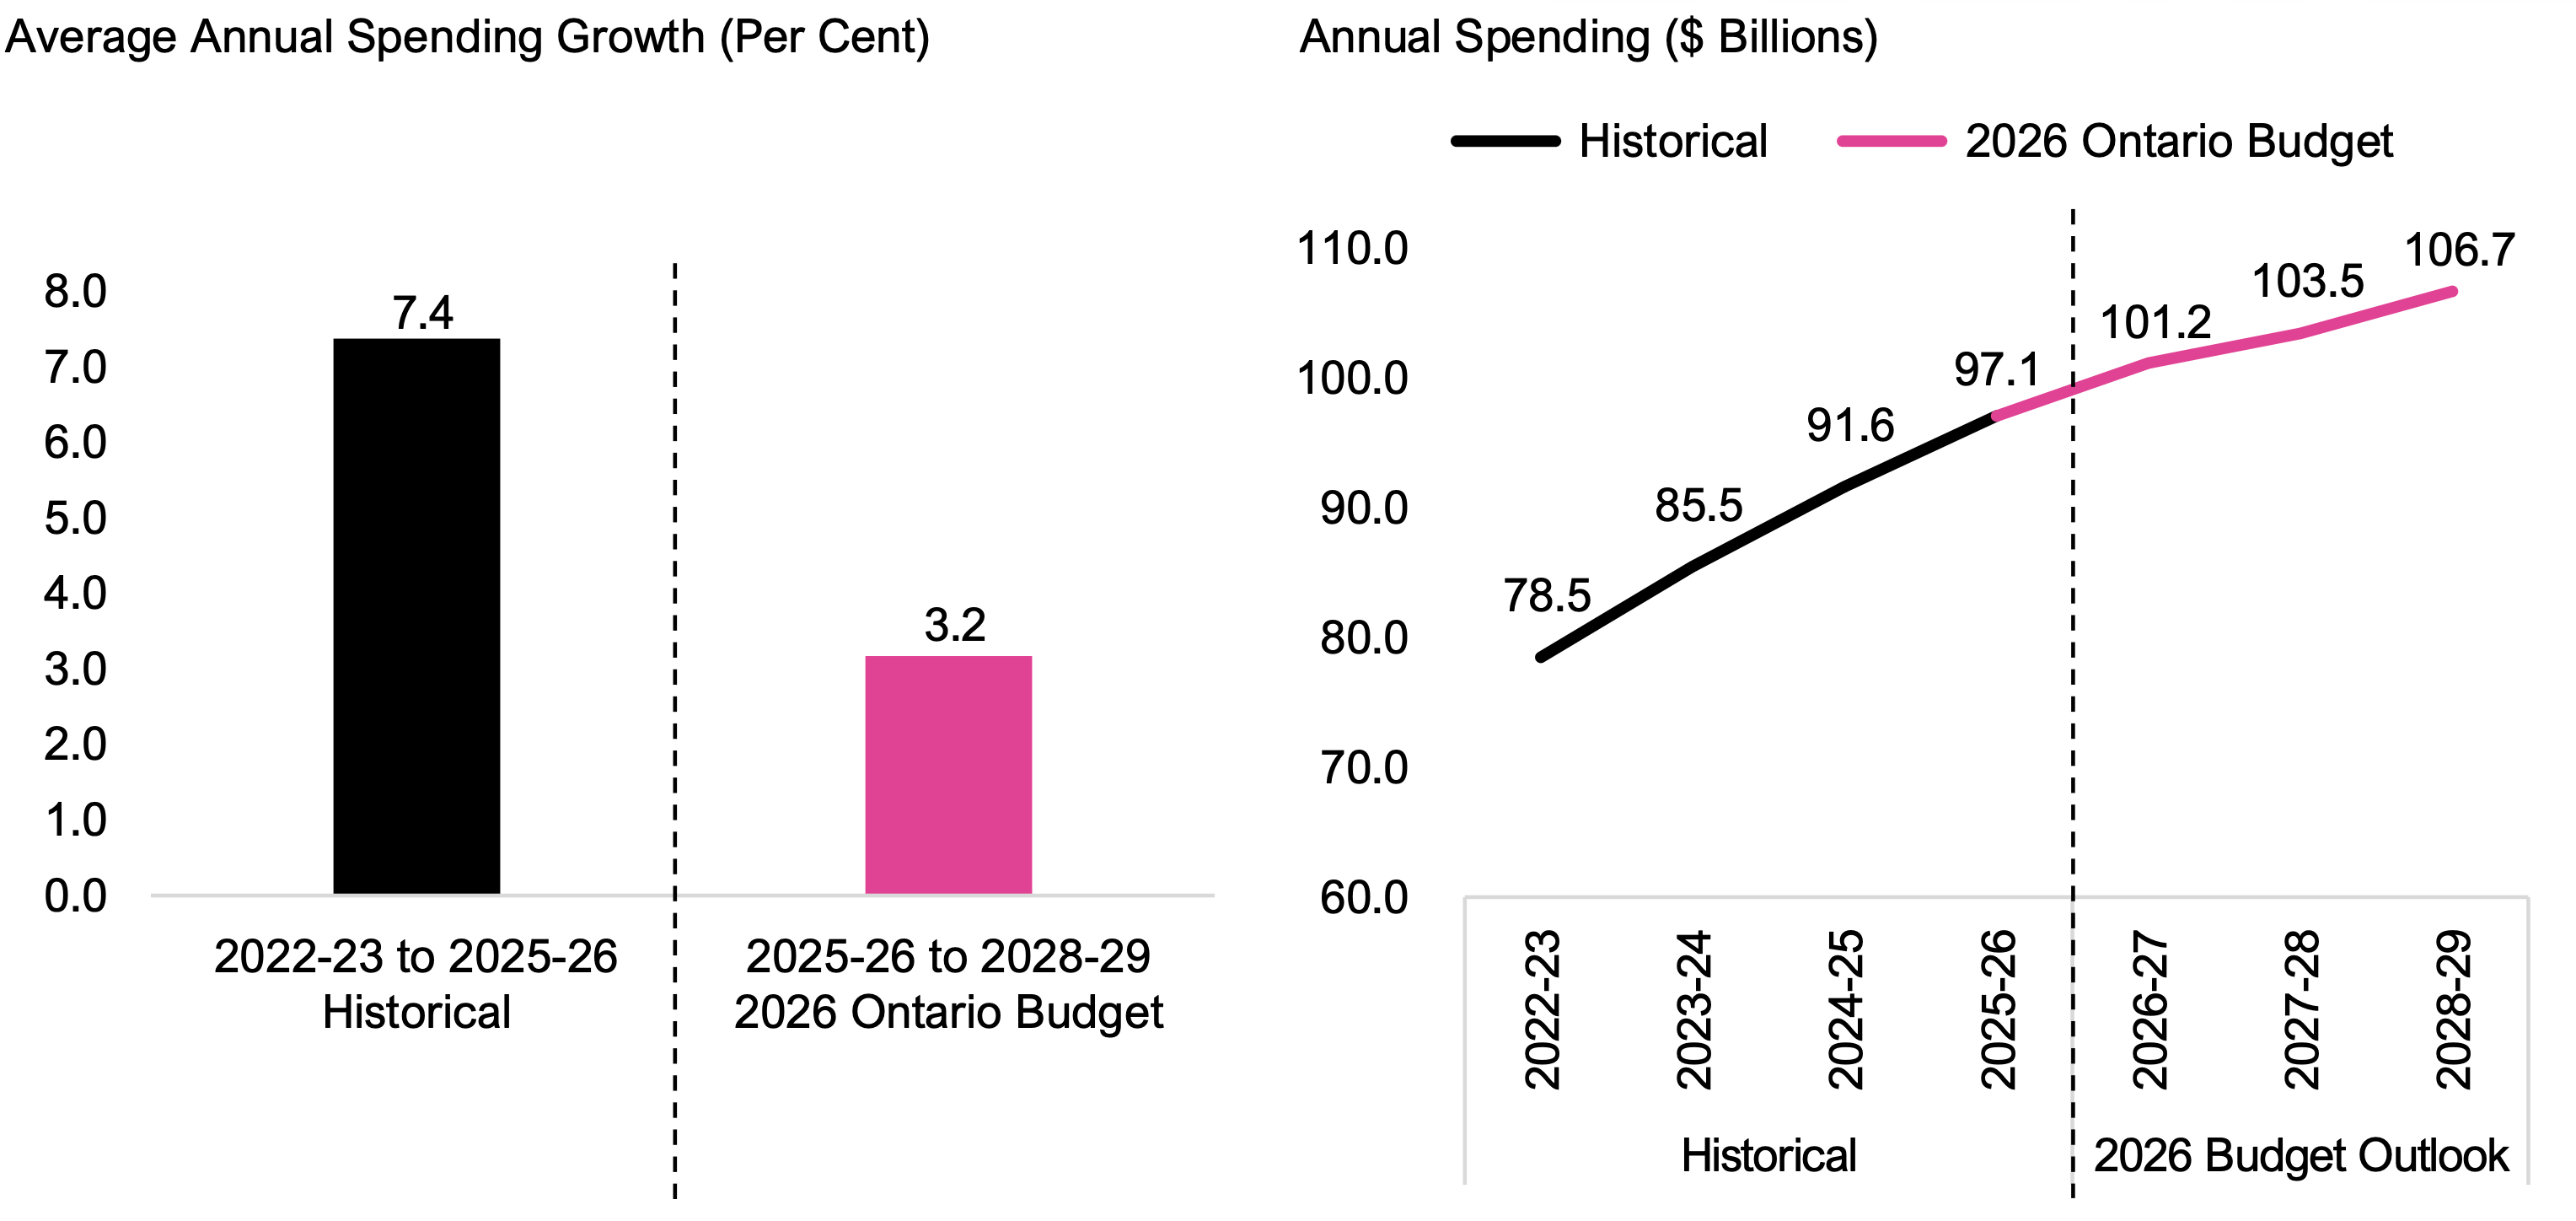
- In the 2026 Ontario Budget, the Province projects that health sector spending will grow at an average annual rate of 3.2 per cent, from $97.1 billion in 2025-26 to $106.7 billion in 2028-29.
- This is a significantly slower pace than the 7.4 per cent average annual growth over the previous three years from 2022-23 to 2025-26.
- For context, over the 36-year period from 1990-91 to 2025-26, health sector spending grew at an average annual rate of 5.1 per cent. If the Province’s health sector spending plan in the 2026 budget is achieved, it would be the slowest three-year growth rate since 2014-15 to 2017-18.
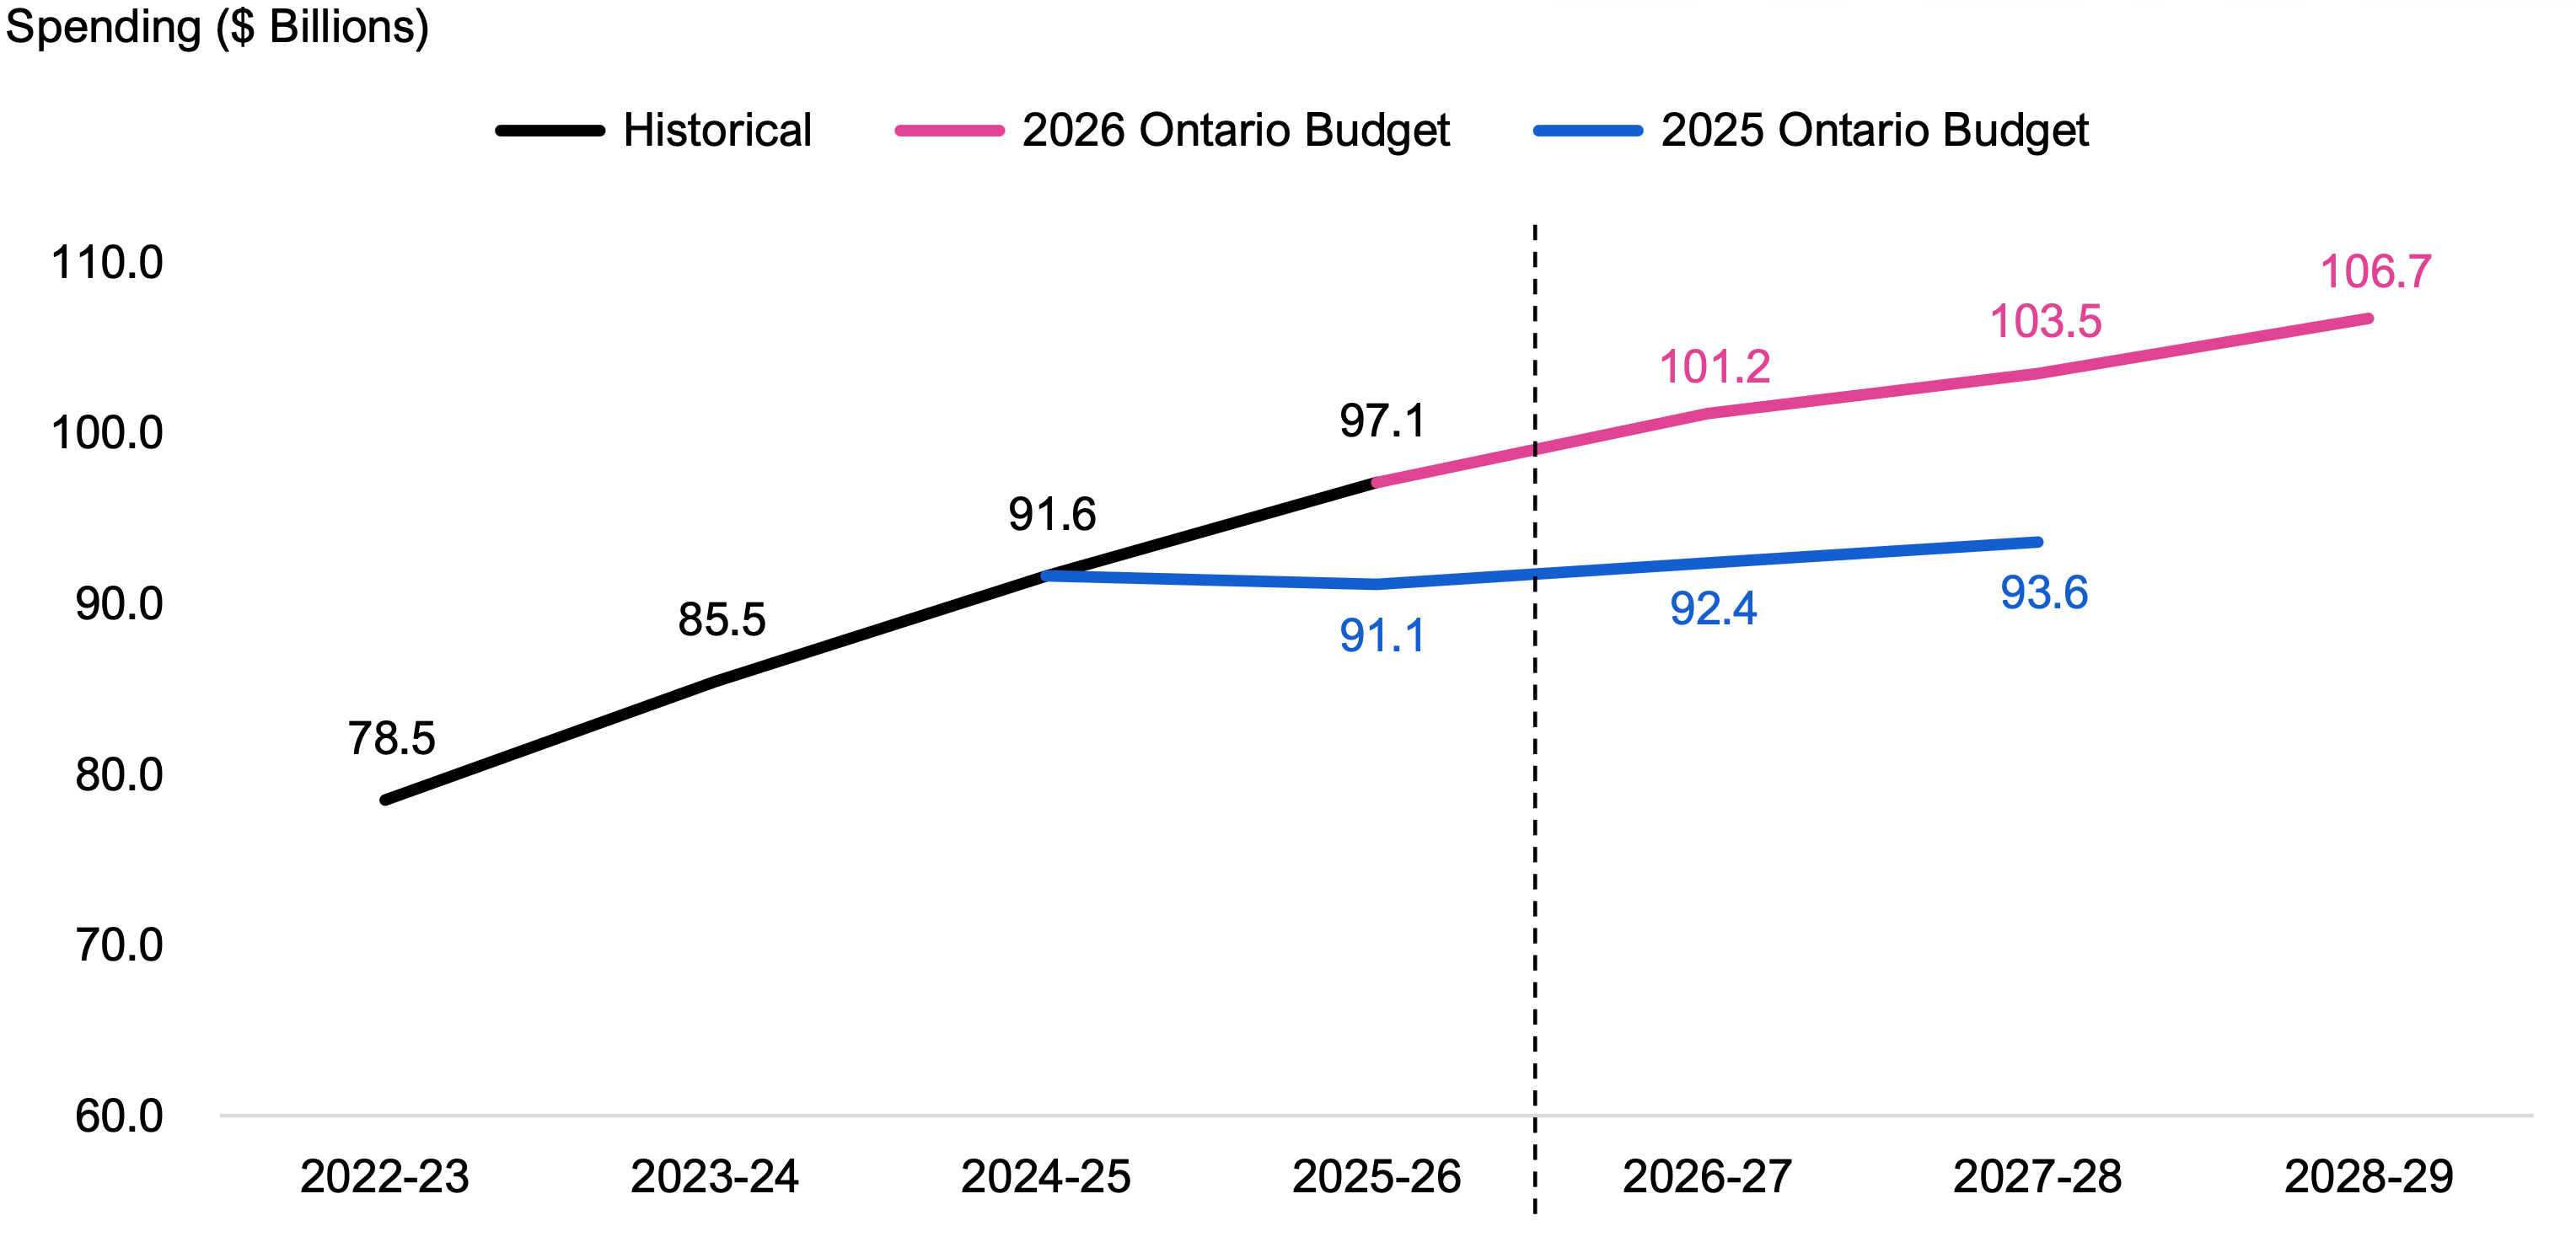
- Compared to the health sector spending plan in the 2025 Ontario Budget, the health sector spending plan in the 2026 Ontario Budget has increased by a total of $24.6 billion from 2025-26 to 2027-28. This includes additional spending of $6.0 billion in 2025-26, $8.8 billion in 2026-27 and $9.9 billion in 2027‑28.
- The FAO estimated health sector spending from 2026-27 to 2028-29 that would be required to maintain 2025-26 service levels. Also known as a cost driver projection, this scenario does not recommend how spending should change but serves as a benchmark to show whether the 2026 budget’s health sector spending plan is likely to maintain, improve or reduce the quality and accessibility of health services.
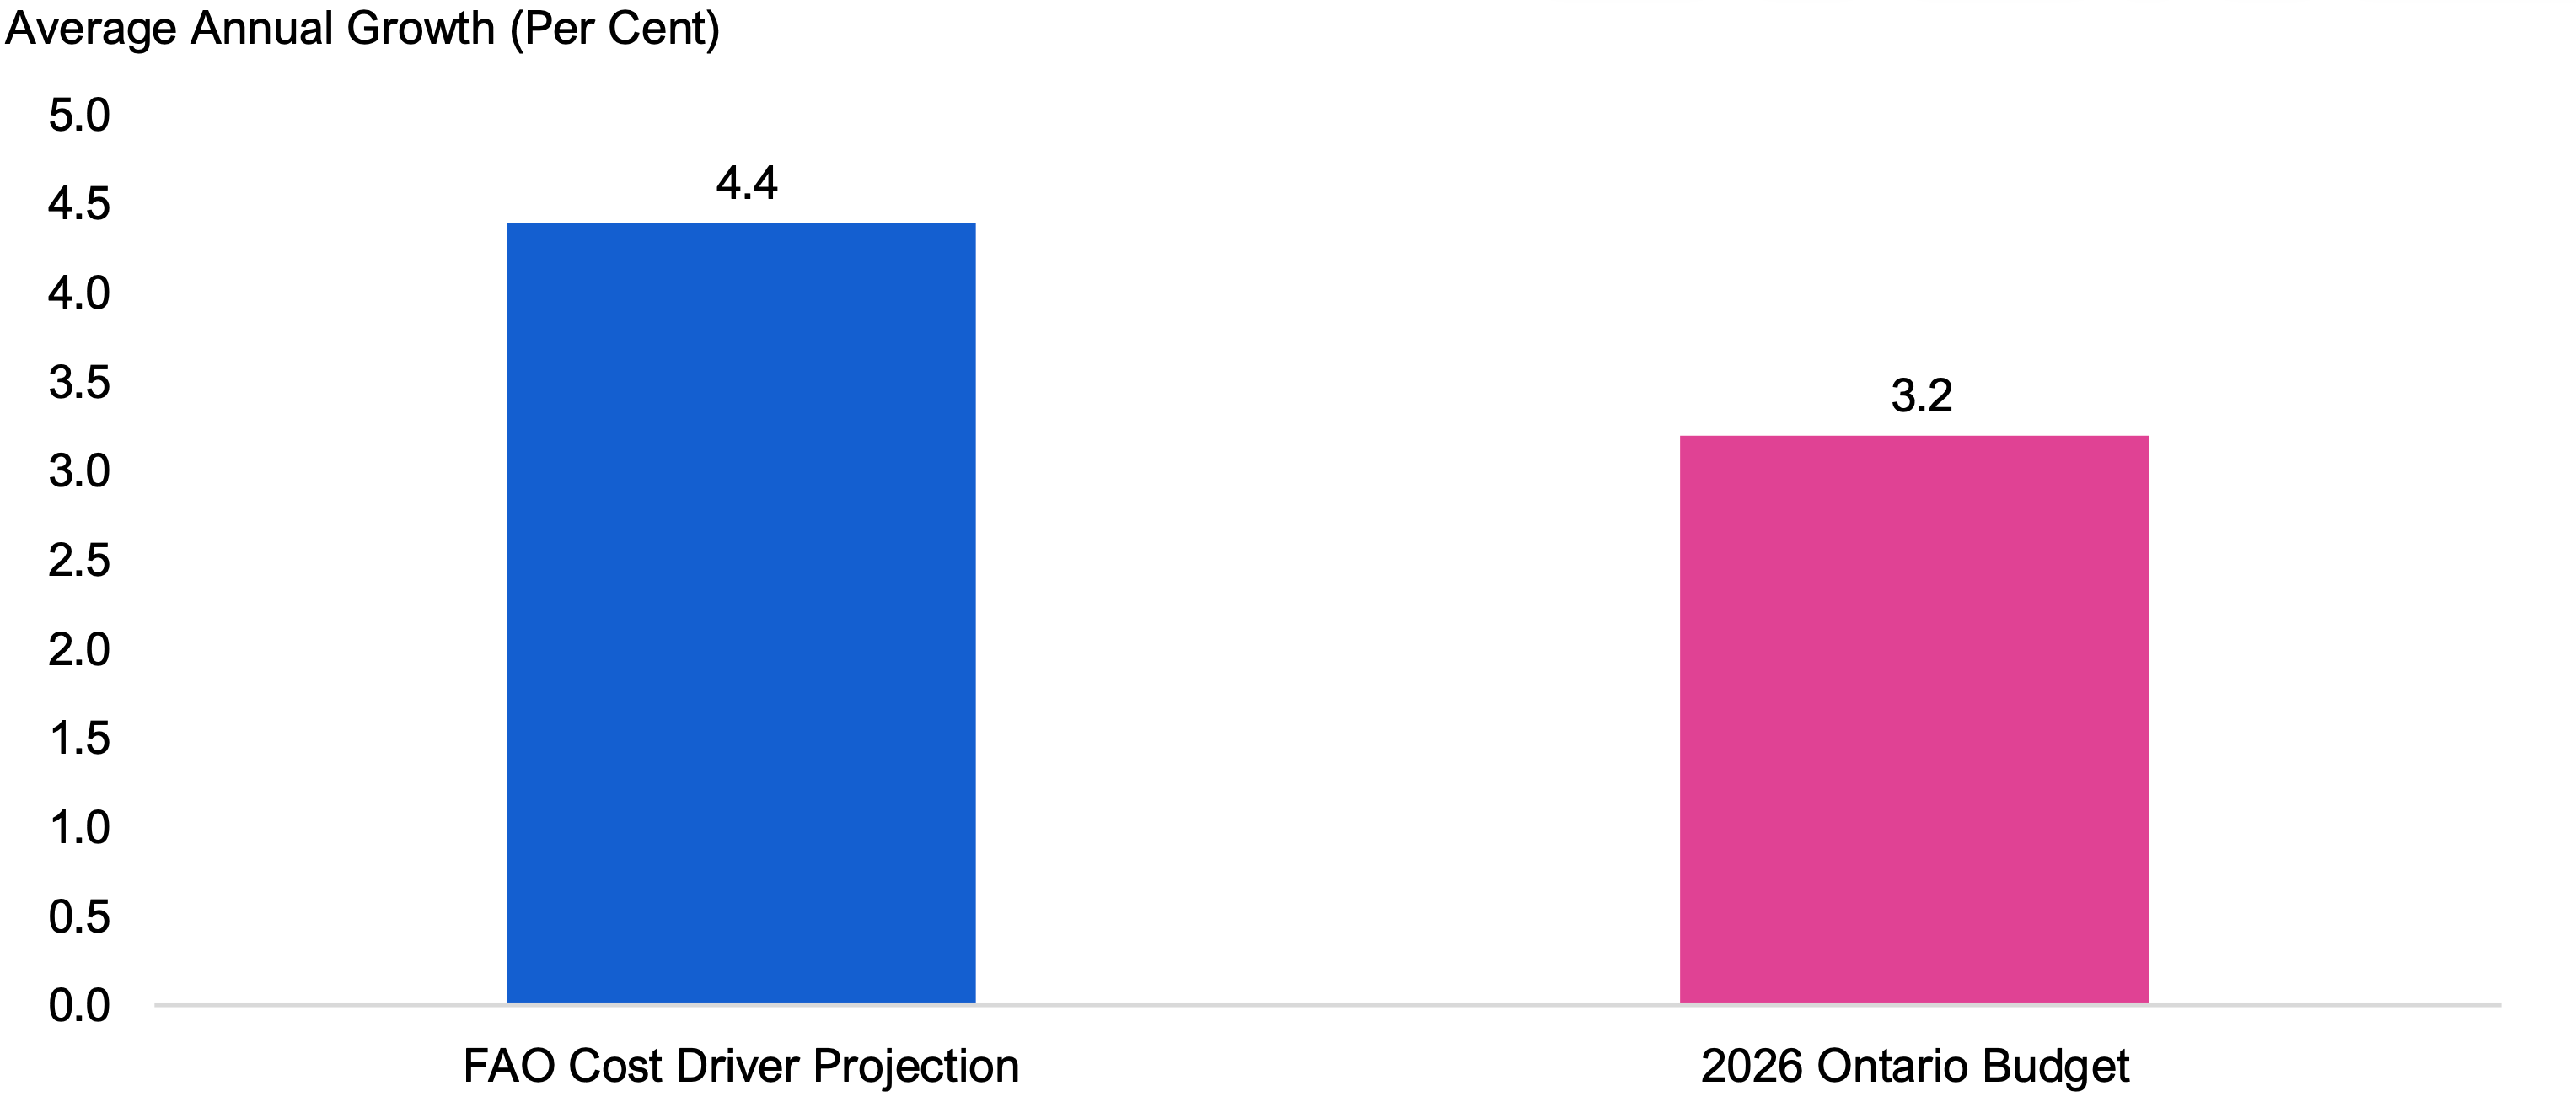
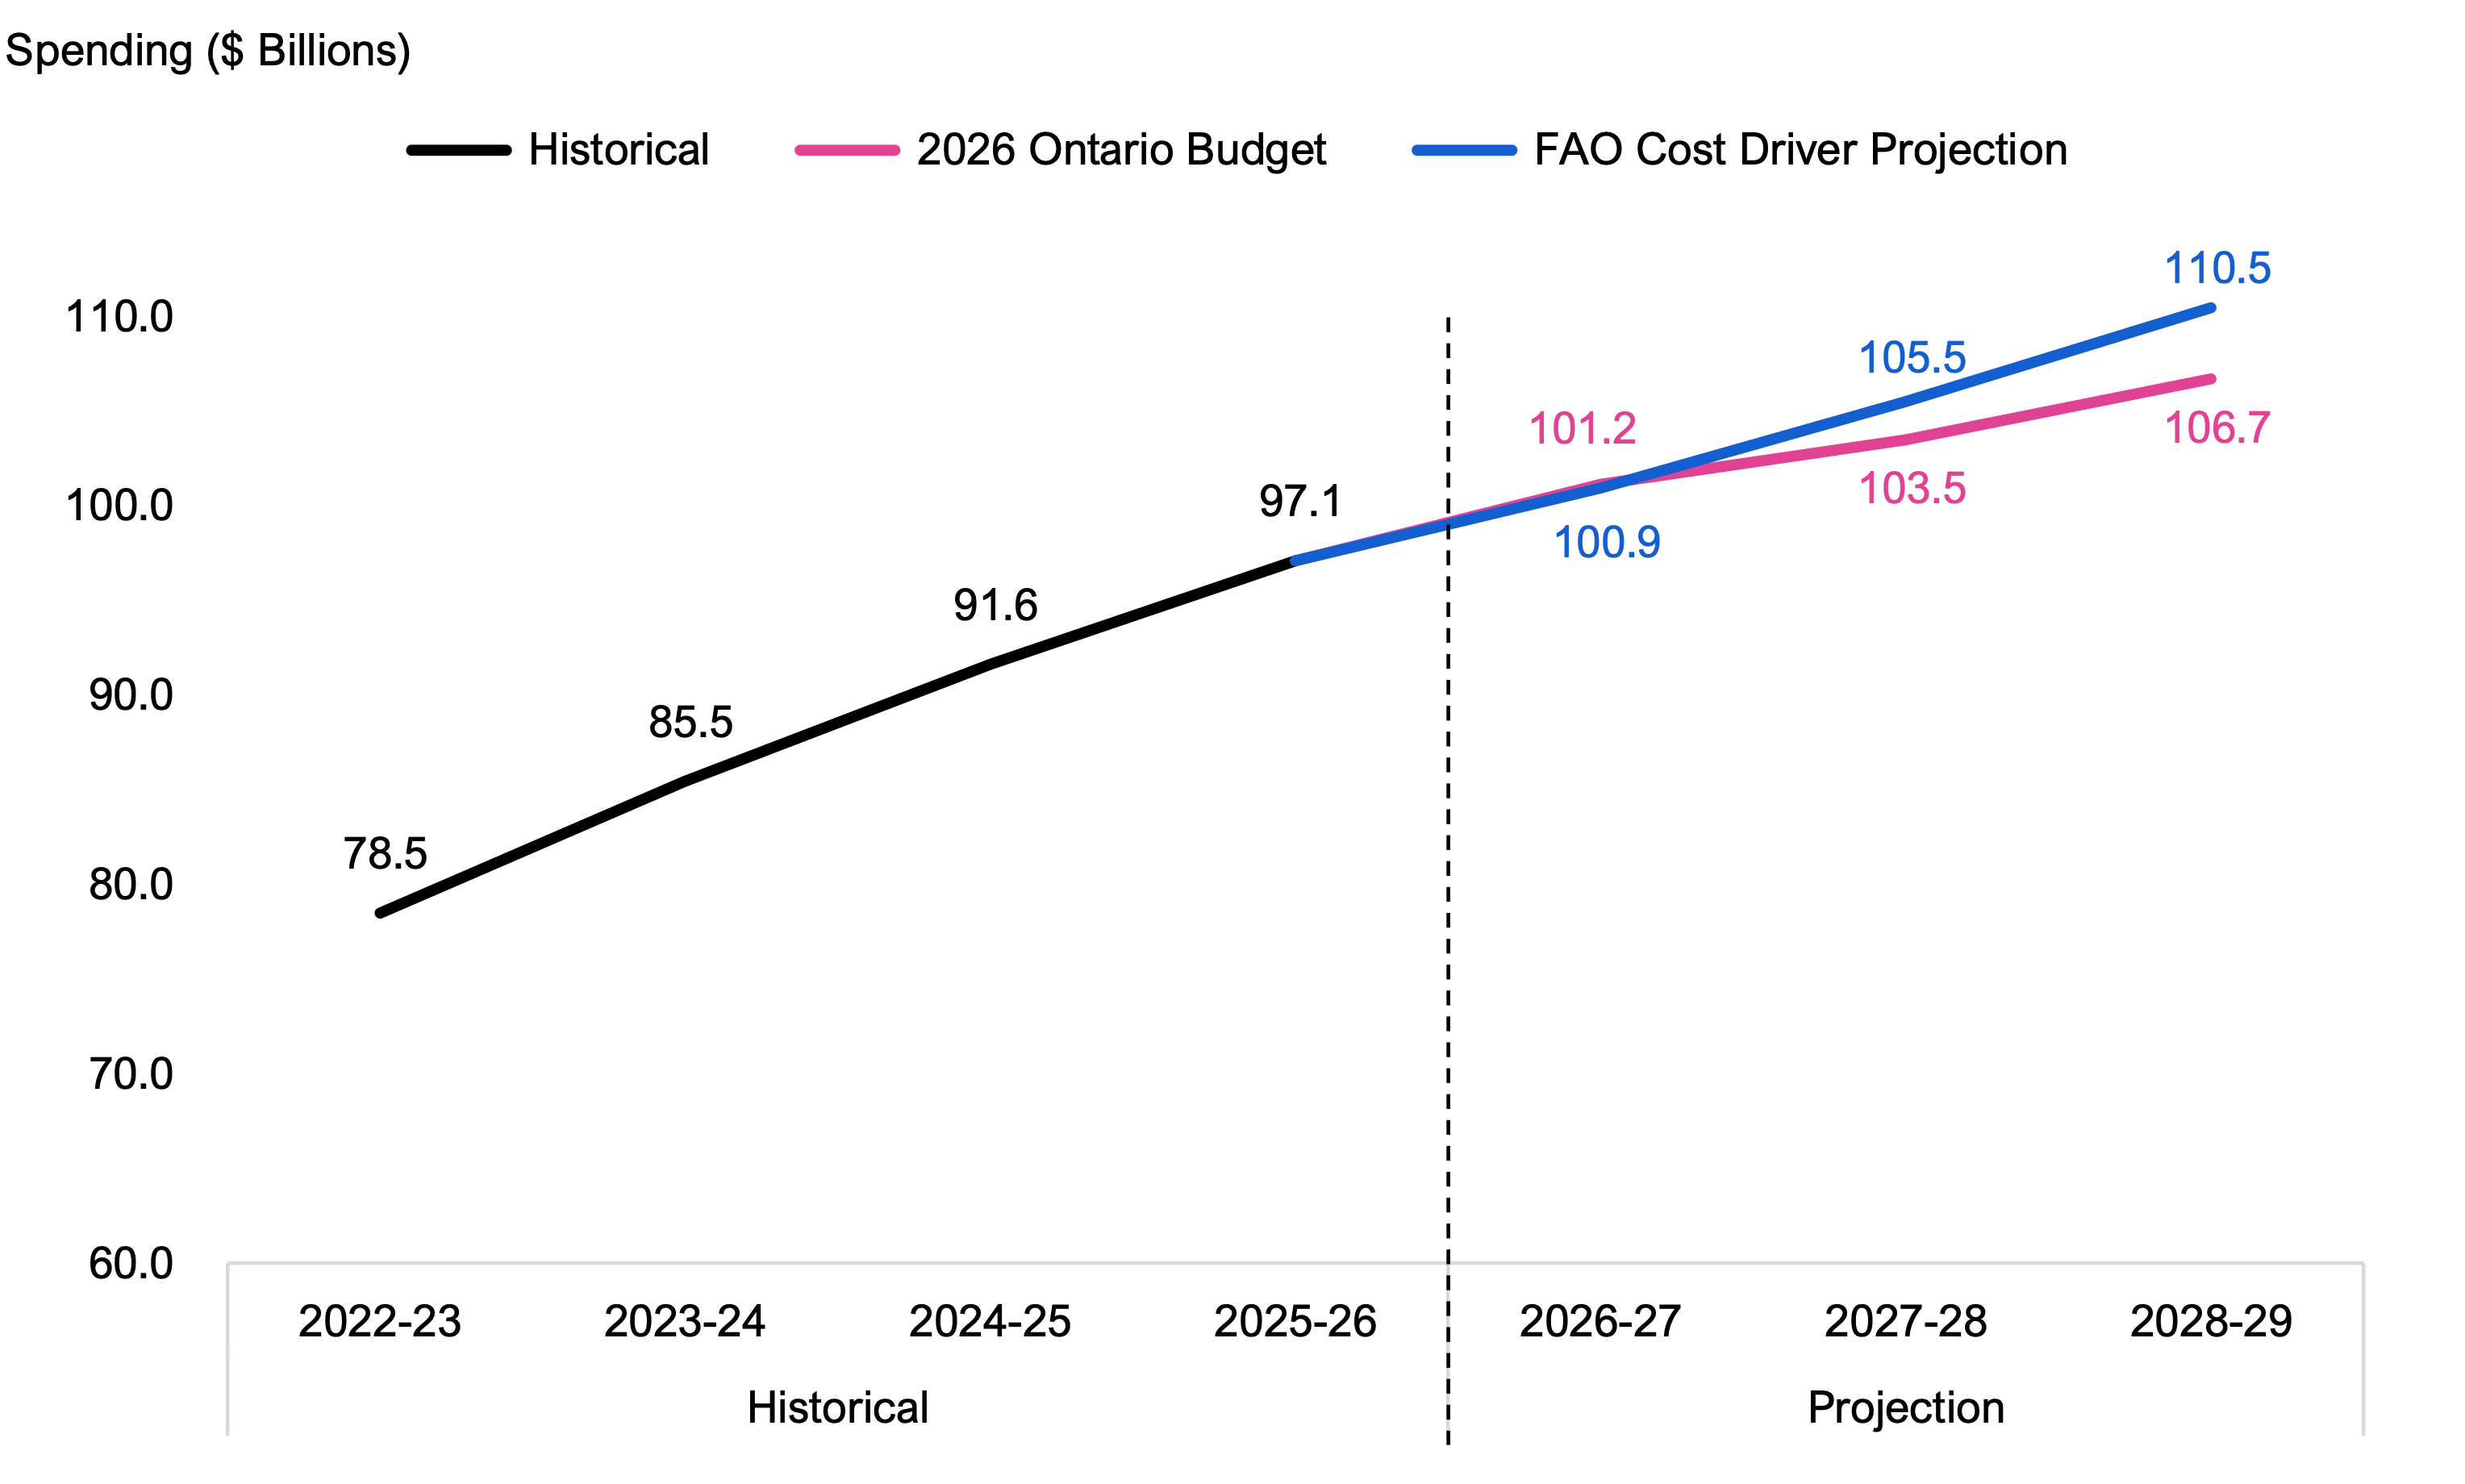
- Overall, the FAO estimates that health sector spending would need to grow by an average annual rate of 4.4 per cent over the next three years to maintain current service levels.
- The 2026 budget spending plan is above the FAO’s cost driver projection by $0.2 billion in 2026‑27, and below the FAO’s cost driver projection by $2.0 billion in 2027-28 and $3.8 billion in 2028‑29. The funding shortfall starting in 2027-28 means that, to maintain current service levels, the Province will need to implement health sector efficiencies (i.e., provide the same level of services with less resources) and/or commit additional funding beyond what was planned in the 2026 Ontario Budget.
Spending Plan Analysis
- Hospital Beds: There were 35,850 funded hospital beds in Ontario in 2025-26. Based on the 2026 budget health sector spending plan, the FAO projects that there would be sufficient funding for 33,443 hospital beds in 2028-29, a decrease of 2,407 funded beds. On a per-capita basis, this represents a decline from 221 funded hospital beds per 100,000 Ontarians in 2025-26 to 205 funded hospital beds per 100,000 Ontarians in 2028-29.
- Long-Term Care Beds: There were 82,128 long-term care beds in Ontario in 2025-26. Based on the 2026 budget health sector spending plan, the FAO projects that the number of long-term care beds would increase by 6,196 to 88,324 long-term care beds in 2028-29. On a per capita basis, this represents a decline from 59 long-term care beds per 1,000 Ontarians aged 75 and over in 2025-26 to 57 long-term care beds per 1,000 Ontarians aged 75 and over in 2028-29, as the projected growth rate in Ontarians aged 75 and over is expected to outpace the increase in the number of long-term care beds.
- Nurses: The FAO estimates that there were 157,062 provincially funded nurses in the health sector in Ontario in 2025-26. Based on the 2026 budget health sector spending plan, the FAO projects that there would be sufficient funding for 154,540 provincially funded nurses in 2028-29, a decrease of 2,522 provincially funded nurses. On a per-capita basis, this represents a decline from 968 provincially funded nurses per 100,000 Ontarians in 2025-26 to 948 provincially funded nurses per 100,000 Ontarians in 2028-29.
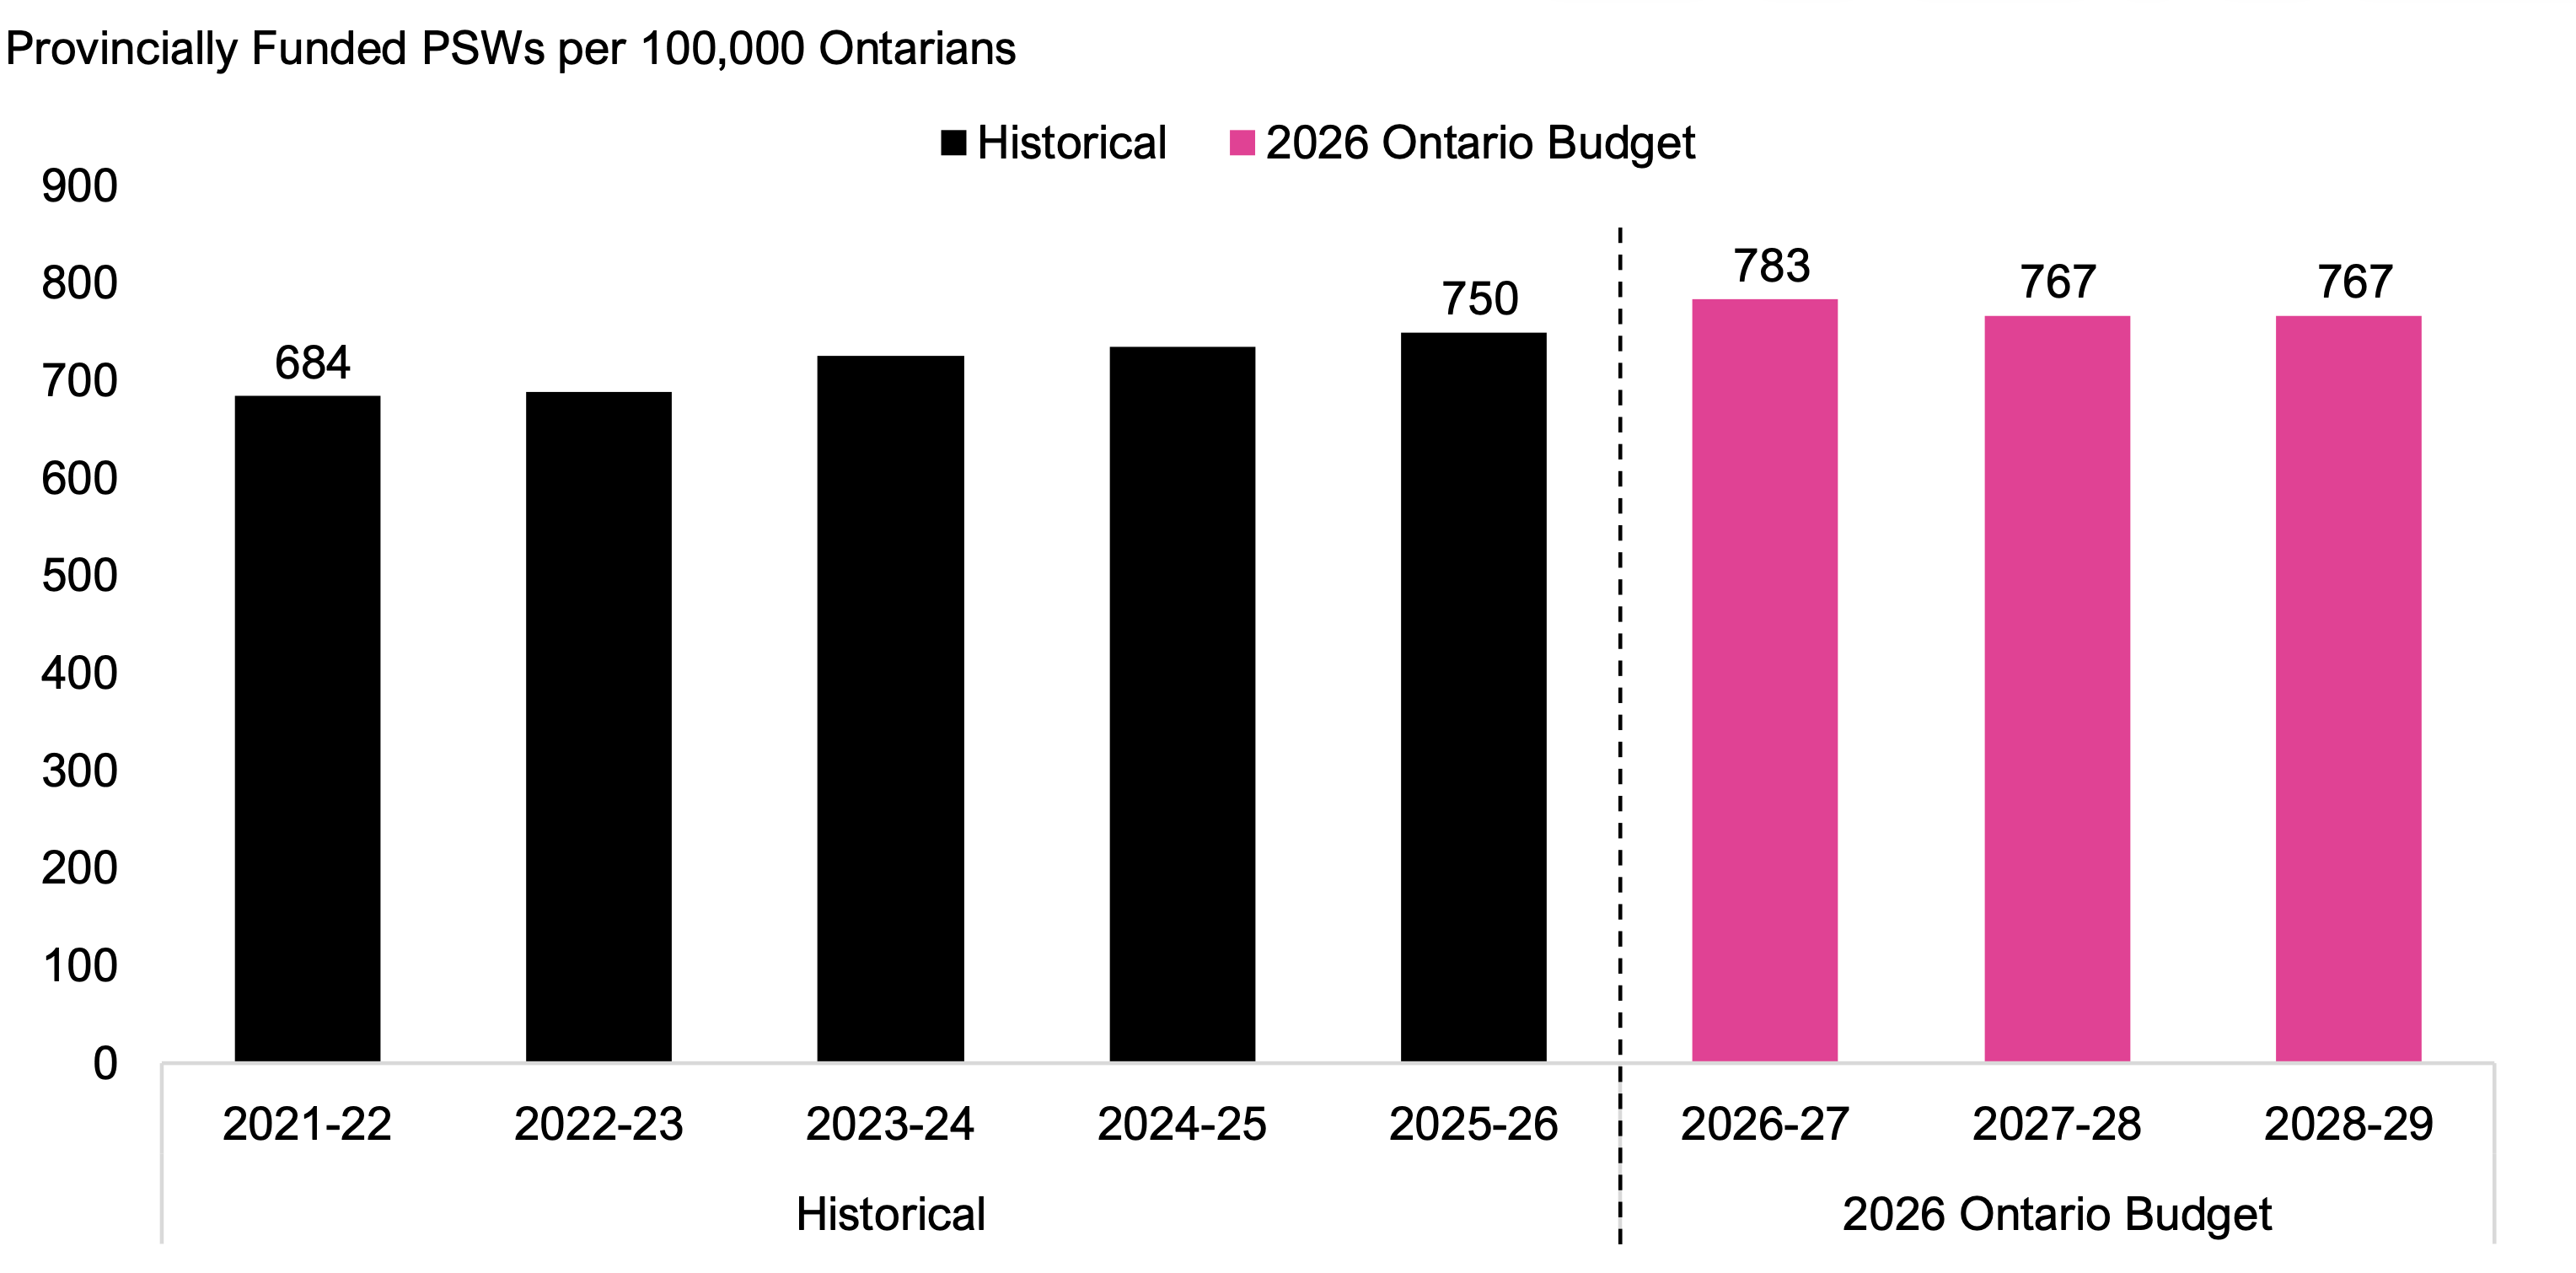
- Personal Support Workers (PSWs): The FAO estimates that there were 121,592 provincially funded PSWs in the health sector in Ontario in 2025-26. Based on the 2026 budget health sector spending plan, the FAO projects that there would be sufficient funding for 125,047 provincially funded PSWs in 2028-29, an increase of 3,455 PSWs. On a per-capita basis, this represents an increase from 750 provincially funded PSWs per 100,000 Ontarians in 2025-26 to 767 provincially funded PSWs per 100,000 Ontarians in 2028-29.
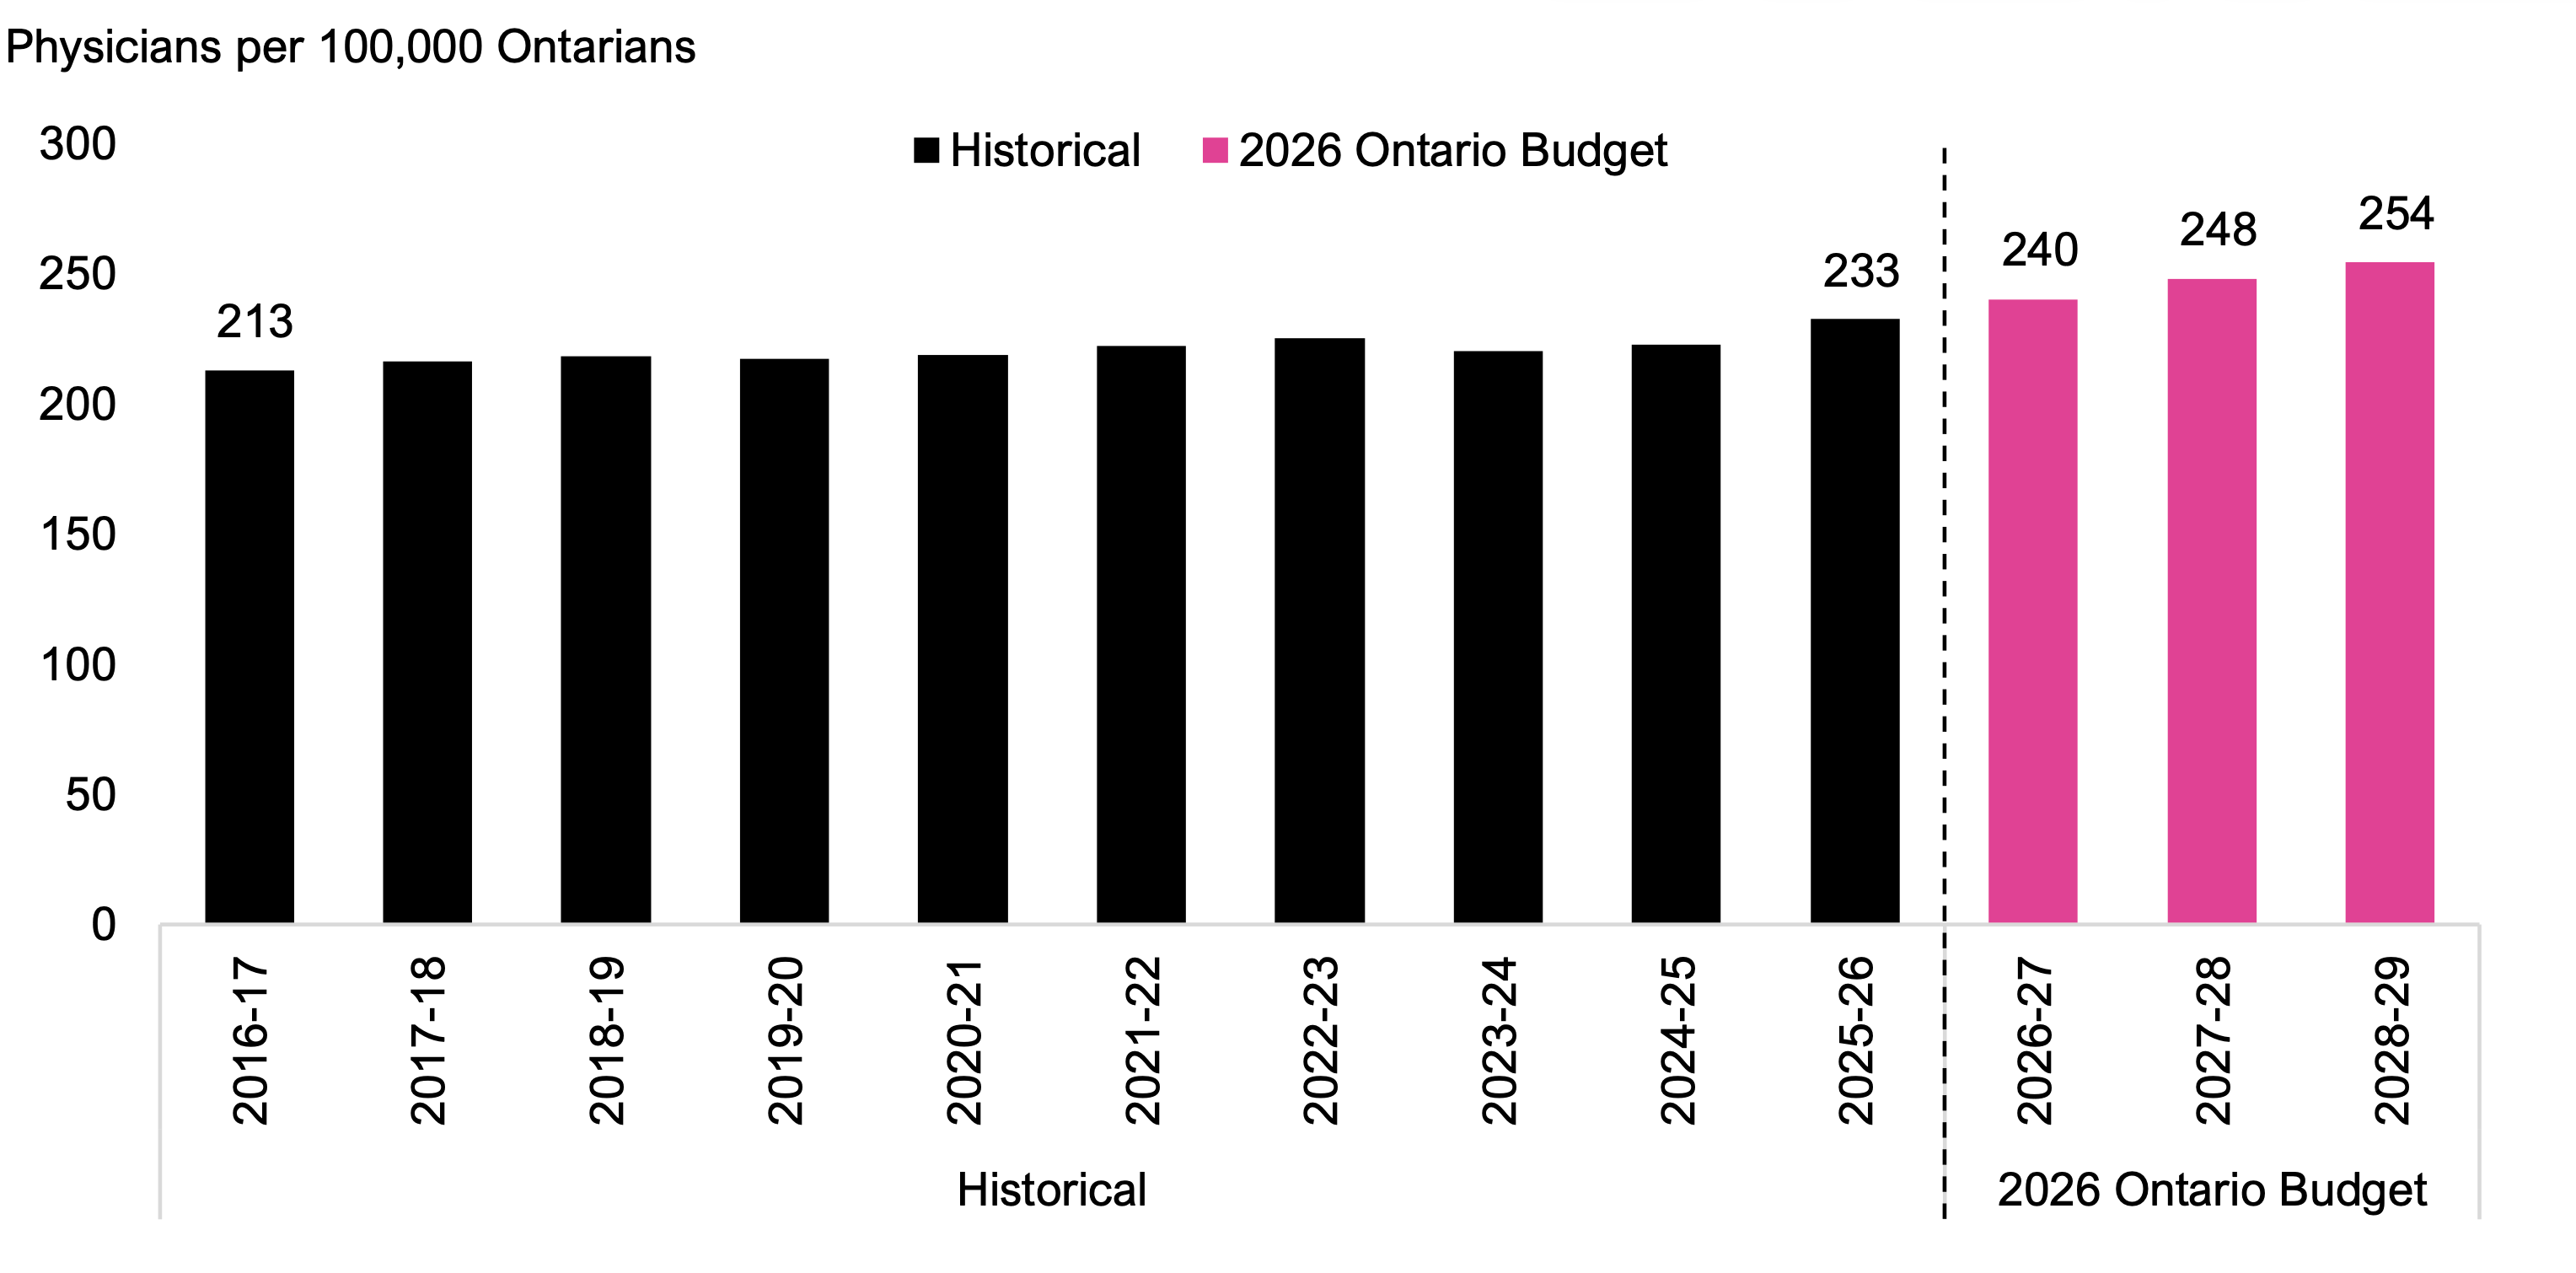
- Physicians: There were 37,713 physicians in Ontario in 2025-26. Based on the 2026 budget health sector spending plan, the FAO projects that there would be sufficient funding for 41,474 physicians in 2028-29, an increase of 3,761 physicians.[1] On a per-capita basis, this represents an increase from 233 physicians per 100,000 Ontarians in 2025-26 to 254 physicians per 100,000 Ontarians in 2028‑29.
Interprovincial Comparison
- In 2023, compared to the other provinces Ontario had:
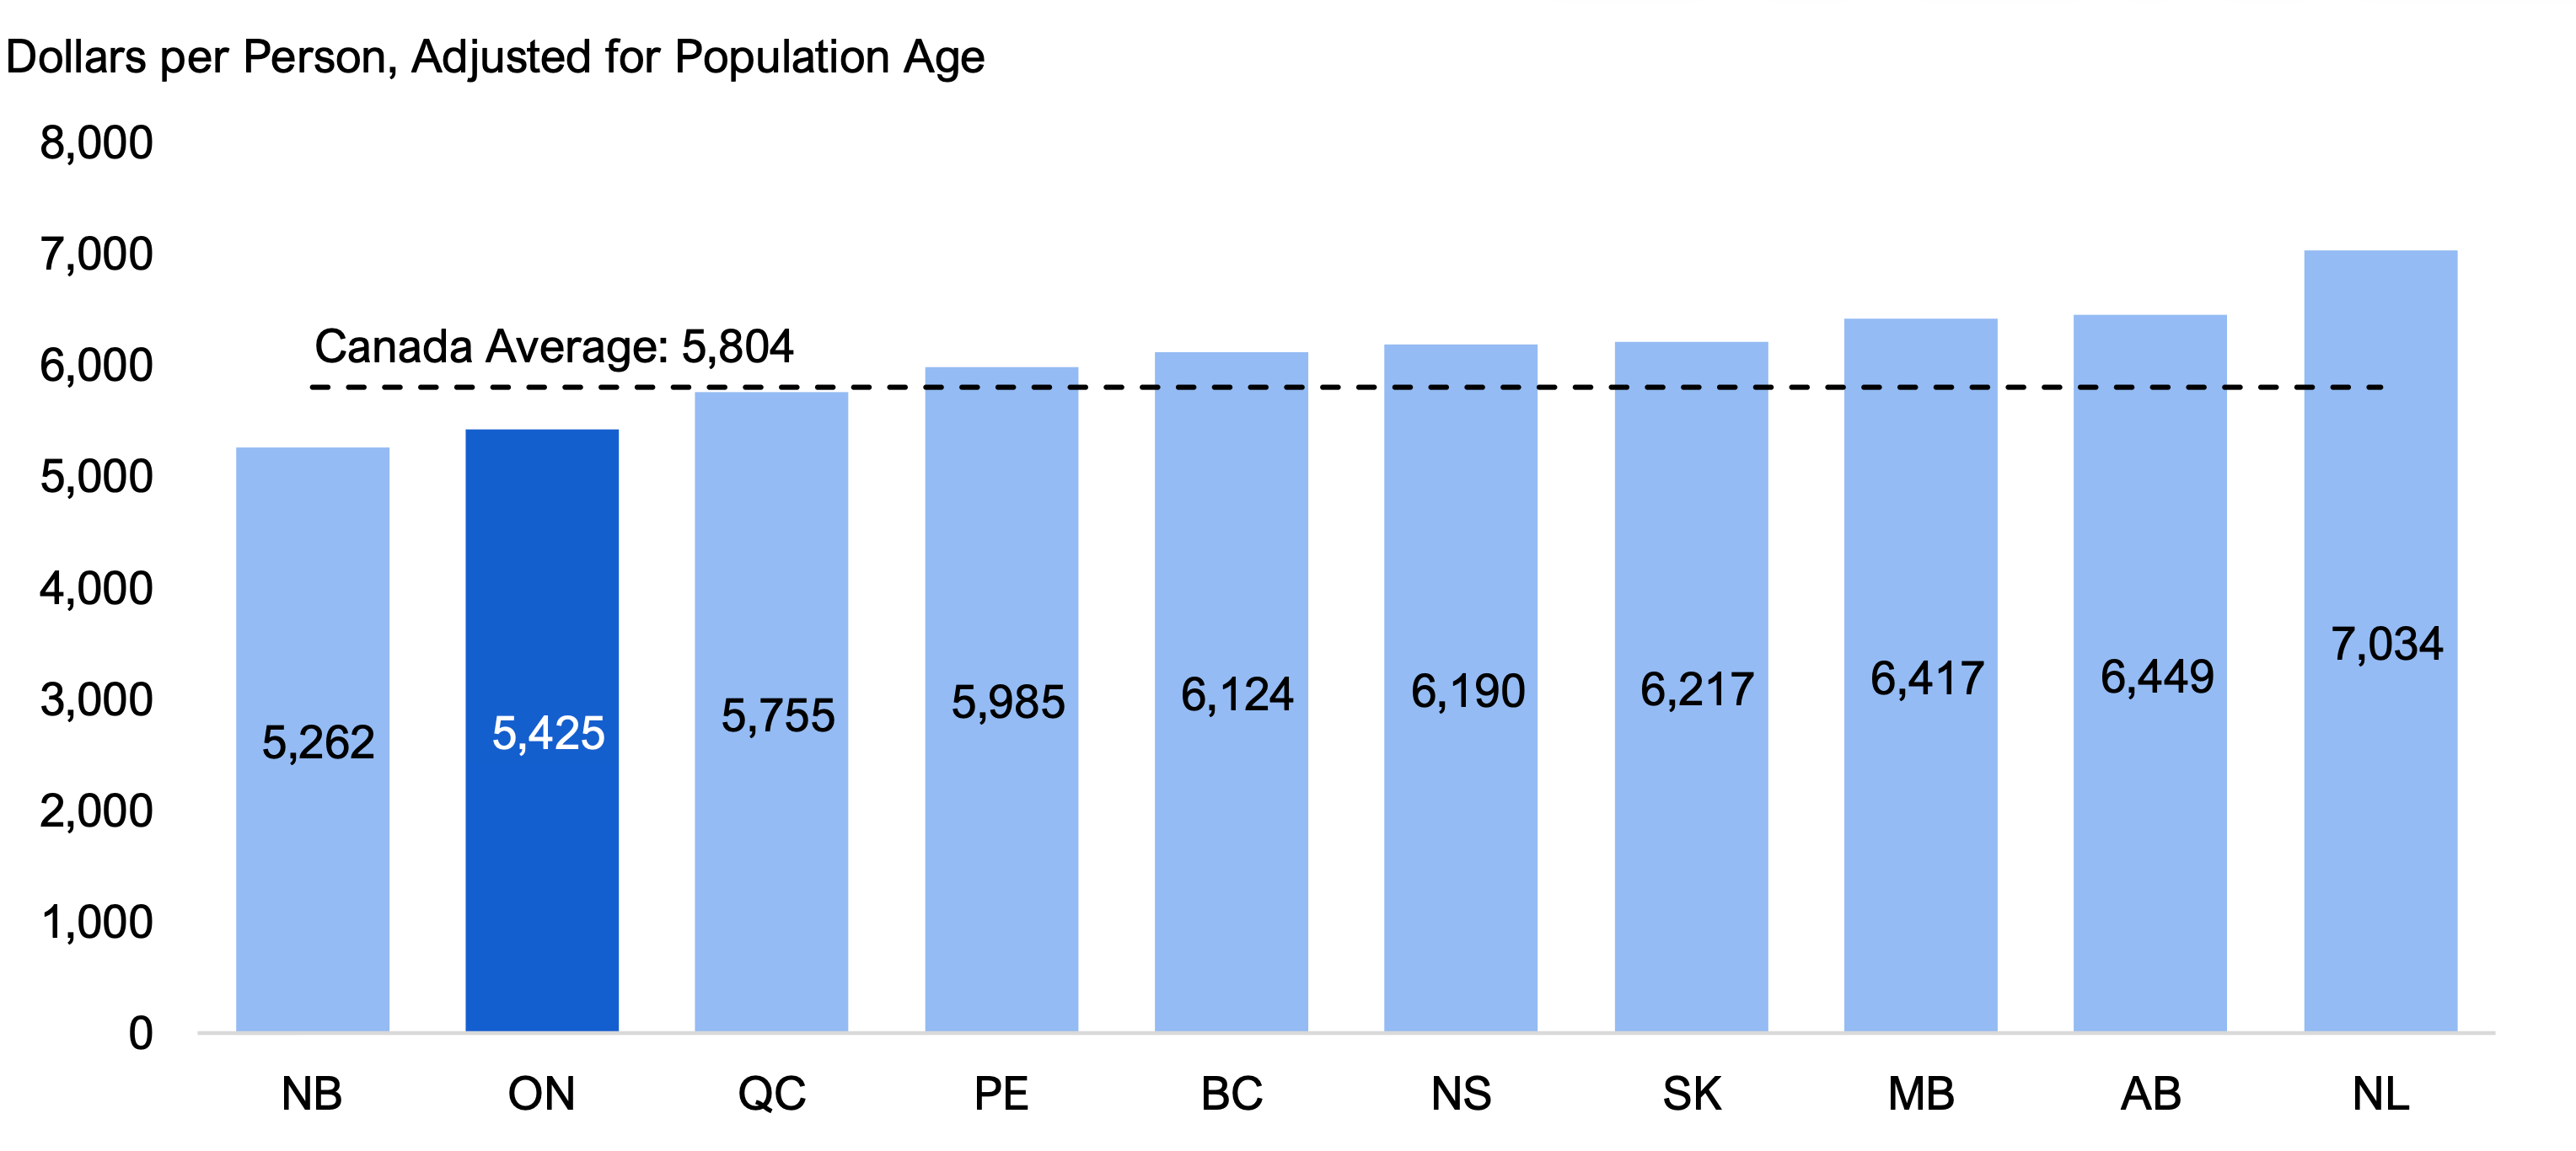
- The second lowest age-standardized per capita total provincial health sector funding at $5,425 per person, below the national average of $5,804 per person.
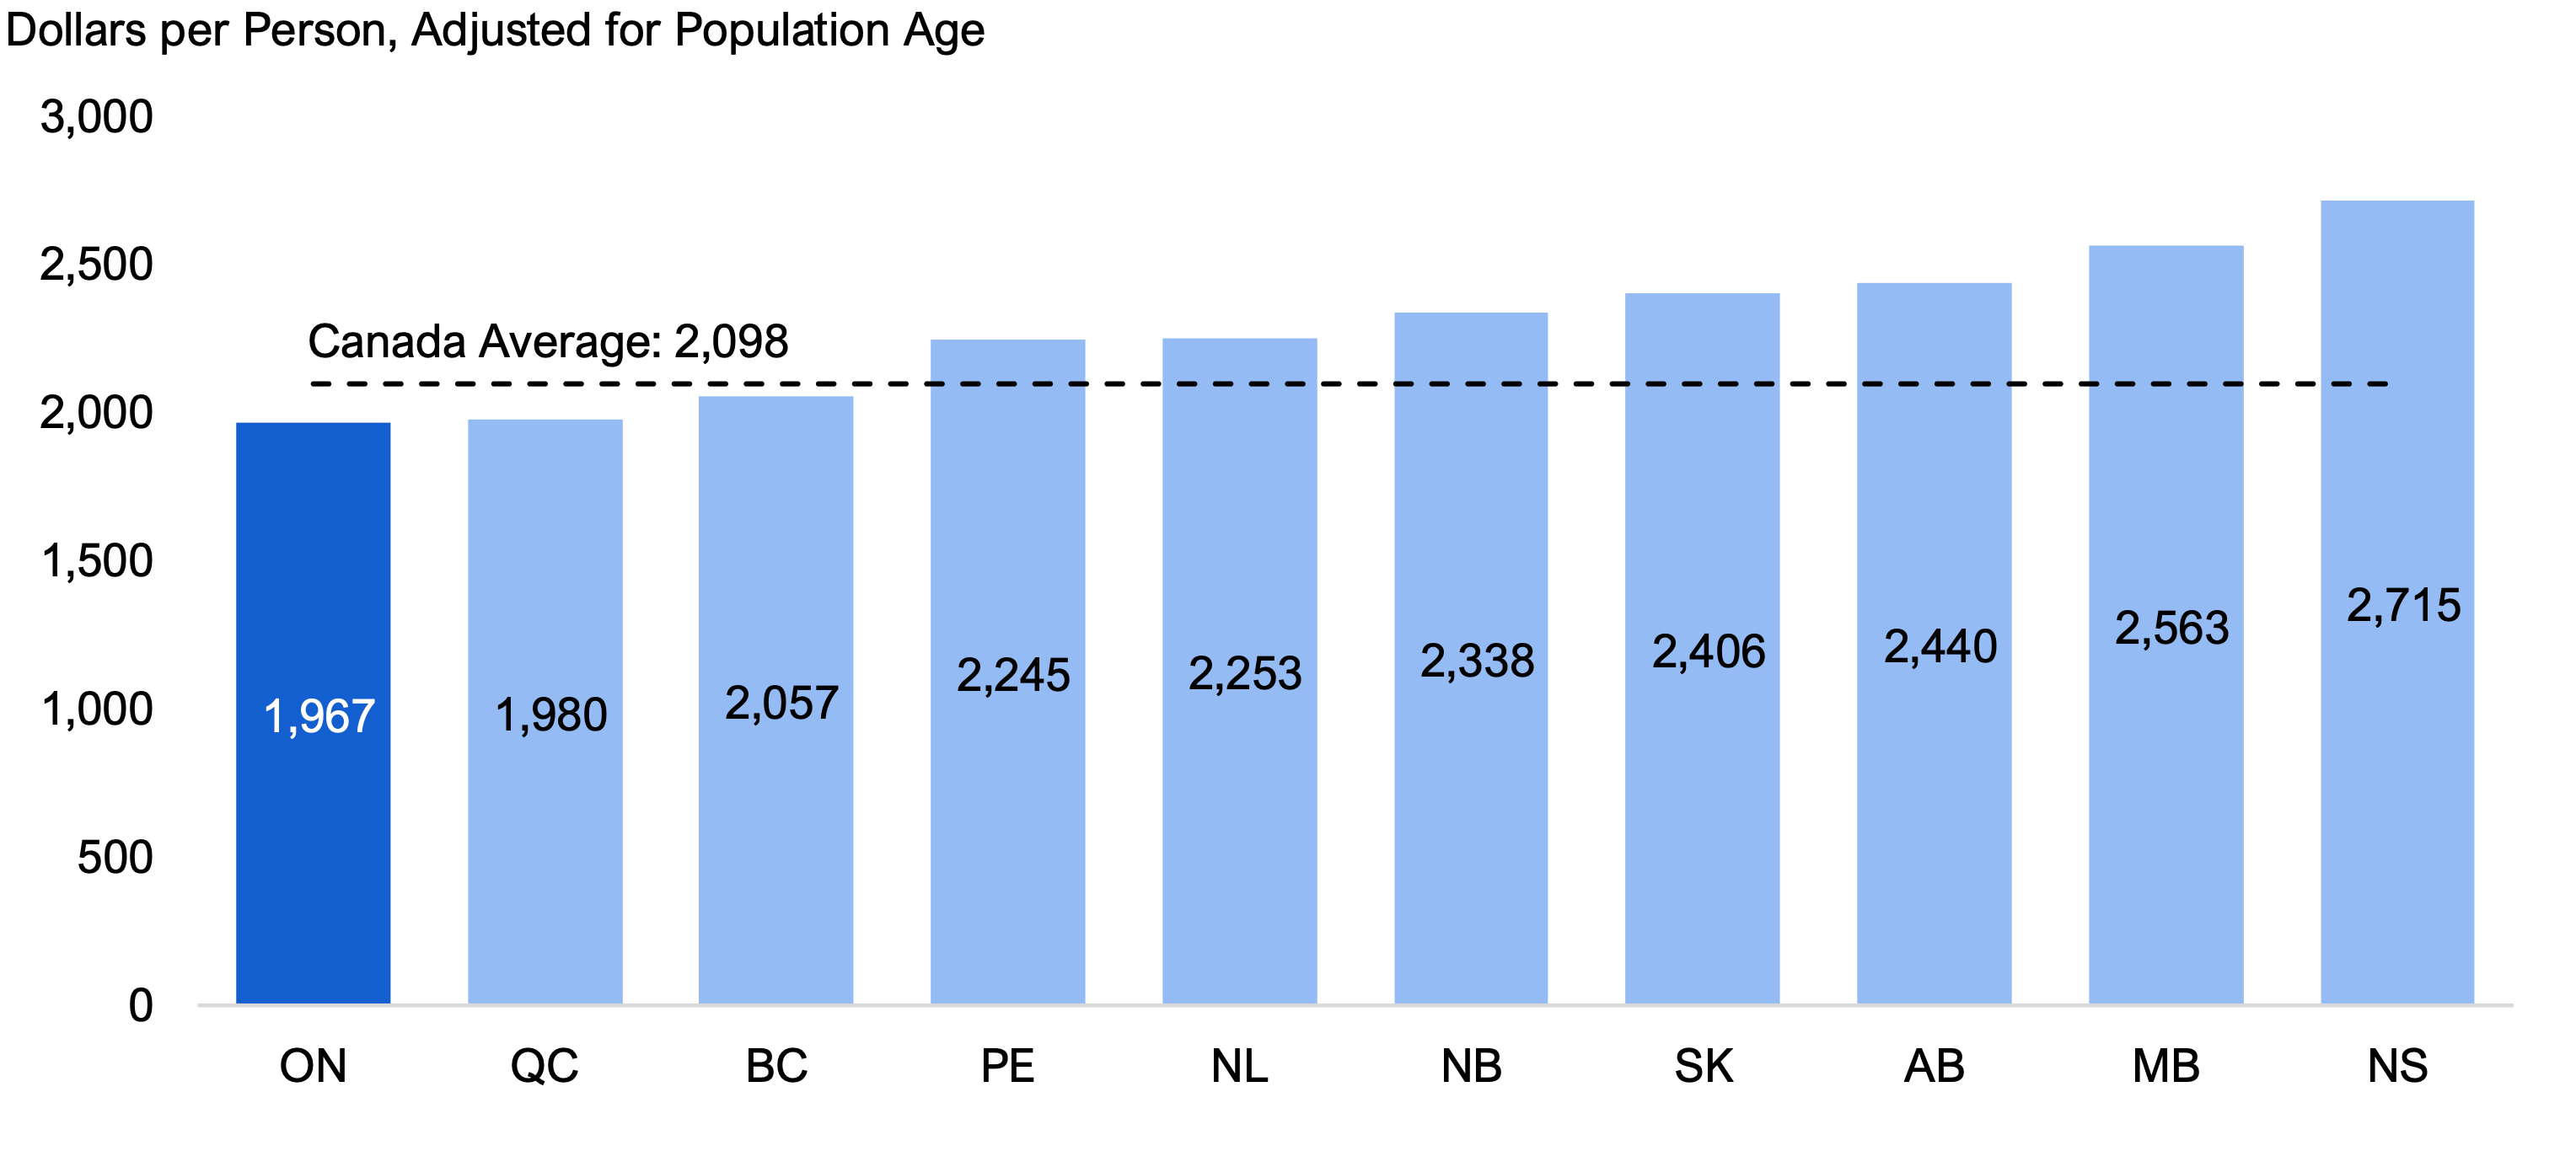
- The lowest age-standardized per capita provincial funding for hospitals at $1,967 per person, below the national average of $2,098 per person.
- A below average number of hospital beds, after adjusting for population and population age, with 229 hospital beds per 100,000 population, below the national average of 245 beds per 100,000 population.
- The fifth highest age-standardized per capita spending on physicians at $1,174 per person, above the national average of $1,145 per person.
- The second lowest number of physicians, after adjusting for population and population age, with 225 physicians per 100,000 population, below the national average of 242 physicians per 100,000 population.
- The second highest age-standardized per capita public drug spending at $454 per person, above the national average of $366 per person.
2. Introduction
This report reviews the Government of Ontario’s (the Province’s) health sector spending plan as outlined in the 2026 Ontario Budget. Health sector spending consists of the combined spending by the Ministries of Health and Long-Term Care.
This analysis was undertaken in response to research requests from Members of Provincial Parliament and is part of a series that reviews the 2026 spending plans for five ministries: Children, Community and Social Services; Colleges, Universities, Research Excellence and Security; Education; Health; and Long-Term Care.
The report is organized as follows:
- Chapter 3 compares the Province’s health sector spending plan in the 2026 Ontario Budget against historical health sector spending, the spending plan from the 2025 Ontario Budget, and estimated cost drivers. The cost driver analysis includes the FAO’s projection for health sector spending required to maintain current service levels.
- Chapter 4 estimates the impact of the Province’s health sector spending plan on select service levels.
- Chapter 5 provides an interprovincial comparison of health spending and service levels.
For additional information on the Ministries of Health and Long-Term Care’s 2026-27 spending plan, see the FAO’s 2026-27 Expenditure Estimates Dashboard, which allows users to review the ministries’ 2026-27 Expenditure Estimates to the standard account level of detail and compare 2026-27 requested spending against spending between 2021-22 and 2025-26.
3. Spending Plan Overview
In the 2026 Ontario Budget, the Province projects that health sector spending will increase from $97.1 billion in 2025-26 to $106.7 billion in 2028-29, representing an average annual growth rate of 3.2 per cent. This is a significantly slower pace than the 7.4 per cent average annual growth over the previous three years from 2022-23 to 2025-26.
Figure 3.1 Health sector spending plan in the 2026 Ontario Budget
Note: Historical values are not restated for program transfers or reclassifications, if any. 2025-26 value is an FAO estimate of unaudited spending and may contain differences from the final audited spending reported in the 2025-26 Public Accounts of Ontario.
Source: Ontario Public Accounts, the 2026 Ontario Budget and FAO analysis.
Accessible version
| 2022-23 to 2025-26
Historical |
2025-26 to 2028-29
2026 Ontario Budget |
|---|---|
| 7.4 | 3.2 |
| Historical | 2026 Ontario Budget | ||
|---|---|---|---|
| Historical | 2022-23 | 78.5 | |
| Historical | 2023-24 | 85.5 | |
| Historical | 2024-25 | 91.6 | |
| Historical | 2025-26 | 97.1 | |
| 2026 Budget Outlook | 2026-27 | 101.2 | |
| 2026 Budget Outlook | 2027-28 | 103.5 | |
| 2026 Budget Outlook | 2028-29 | 106.7 |
For context, over the 36-year period from 1990-91 to 2025-26, health sector spending grew at an average annual rate of 5.1 per cent.[2] The Province’s health sector spending plan in the 2026 budget calls for slower spending growth compared to the 36-year average and if achieved, would be the slowest three-year growth rate since 2014-15 to 2017-18.
2026 Spending Plan Compared to 2025 Spending Plan
Compared to the health sector spending plan in the 2025 Ontario Budget, the health sector spending plan in the 2026 Ontario Budget has increased by a total of $24.6 billion from 2025-26 to 2027-28. This includes additional spending of $6.0 billion in 2025-26, $8.8 billion in 2026-27 and $9.9 billion in 2027-28.
Figure 3.2 Health sector spending plan in the 2025 and 2026 Ontario Budgets
Note: Historical values are not restated for program transfers or reclassifications, if any. 2025-26 historical value is an FAO estimate of unaudited spending and may contain differences from the final audited spending reported in the 2025-26 Public Accounts of Ontario.
Source: Ontario Public Accounts, 2025 Ontario Budget, 2026 Ontario Budget and FAO analysis.
Accessible version
| Historical | 2025 Ontario Budget | 2026 Ontario Budget | |
|---|---|---|---|
| 2022-23 | 78.5 | ||
| 2023-24 | 85.5 | ||
| 2024-25 | 91.6 | ||
| 2025-26 | 97.1 | 91.1 | 97.1 |
| 2026-27 | 92.4 | 101.2 | |
| 2027-28 | 93.6 | 103.5 | |
| 2028-29 | 106.7 |
Spending Plan Compared to Cost Drivers
At the request of the Members of Provincial Parliament, the FAO estimated health sector spending over the next three years that would be required to maintain 2025-26 service levels. Also known as a cost driver projection, this scenario does not recommend how spending should change but serves as a benchmark to show whether the 2026 budget’s health sector spending plan is likely to maintain, improve or reduce the quality and accessibility of health services.
Overall, the FAO estimates that health sector spending would need to grow by an average annual rate of 4.4 per cent over the next three years to maintain current health sector service levels. The FAO’s health sector cost driver projection incorporates three key factors:
- Population growth: As Ontario’s population increases, more people will access public health care services.
- Population aging: On average, older Ontarians use more health care services.
- Health care inflation: The cost of delivering health care services increases due to growth in employee compensation and rising costs for pharmaceuticals, medical supplies, equipment and technology.
Figure 3.3 Comparing health sector spending growth, FAO cost driver projection vs. 2026 Ontario Budget, 2025‑26 to 2028‑29
Source: 2026 Ontario Budget and FAO analysis.
Accessible version
| FAO Cost Driver Projection | 2026 Ontario Budget |
|---|---|
| 4.4 | 3.2 |
As noted above, in the 2026 budget, the Province projects that health sector spending will increase at an average annual rate of 3.2 per cent from 2025-26 to 2028-29. Compared to the FAO’s cost driver projection, this results in excess funding of $0.2 billion in 2026-27, and funding shortfalls of $2.0 billion in 2027-28 and $3.8 billion in 2028-29.
Figure 3.4 Comparing health sector spending projections, FAO cost driver projection vs. 2026 Ontario Budget
Note: Historical values are not restated for program transfers or reclassifications, if any. 2025-26 value is an FAO estimate of unaudited spending and may contain differences from the final audited spending reported in the 2025-26 Public Accounts of Ontario.
Source: Ontario Public Accounts, 2026 Ontario Budget and FAO analysis.
Accessible version
| Historical | FAO Cost Driver Projection | 2026 Ontario Budget | ||
|---|---|---|---|---|
| Historical | 2022-23 | 78.5 | ||
| Historical | 2023-24 | 85.5 | ||
| Historical | 2024-25 | 91.6 | ||
| Historical | 2025-26 | 97.1 | ||
| Projection | 2026-27 | 100.9 | 101.2 | |
| Projection | 2027-28 | 105.5 | 103.5 | |
| Projection | 2028-29 | 110.5 | 106.7 |
The funding shortfall starting in 2027-28 means that, to maintain current service levels, the Province will need to implement health sector efficiencies (i.e., provide the same level of services with fewer resources) and/or commit additional funding beyond what was planned in the 2026 Ontario Budget.
4. Spending Plan Analysis
At the request of the Members of Provincial Parliament, the FAO estimated the potential impact of the health sector spending plan in the 2026 budget on select service level indicators. For information on other measures of health service levels, see Ontario Health, Health System Performance Reporting and Canadian Institute for Health Information (CIHI), Health system performance measurement.
Hospital Beds
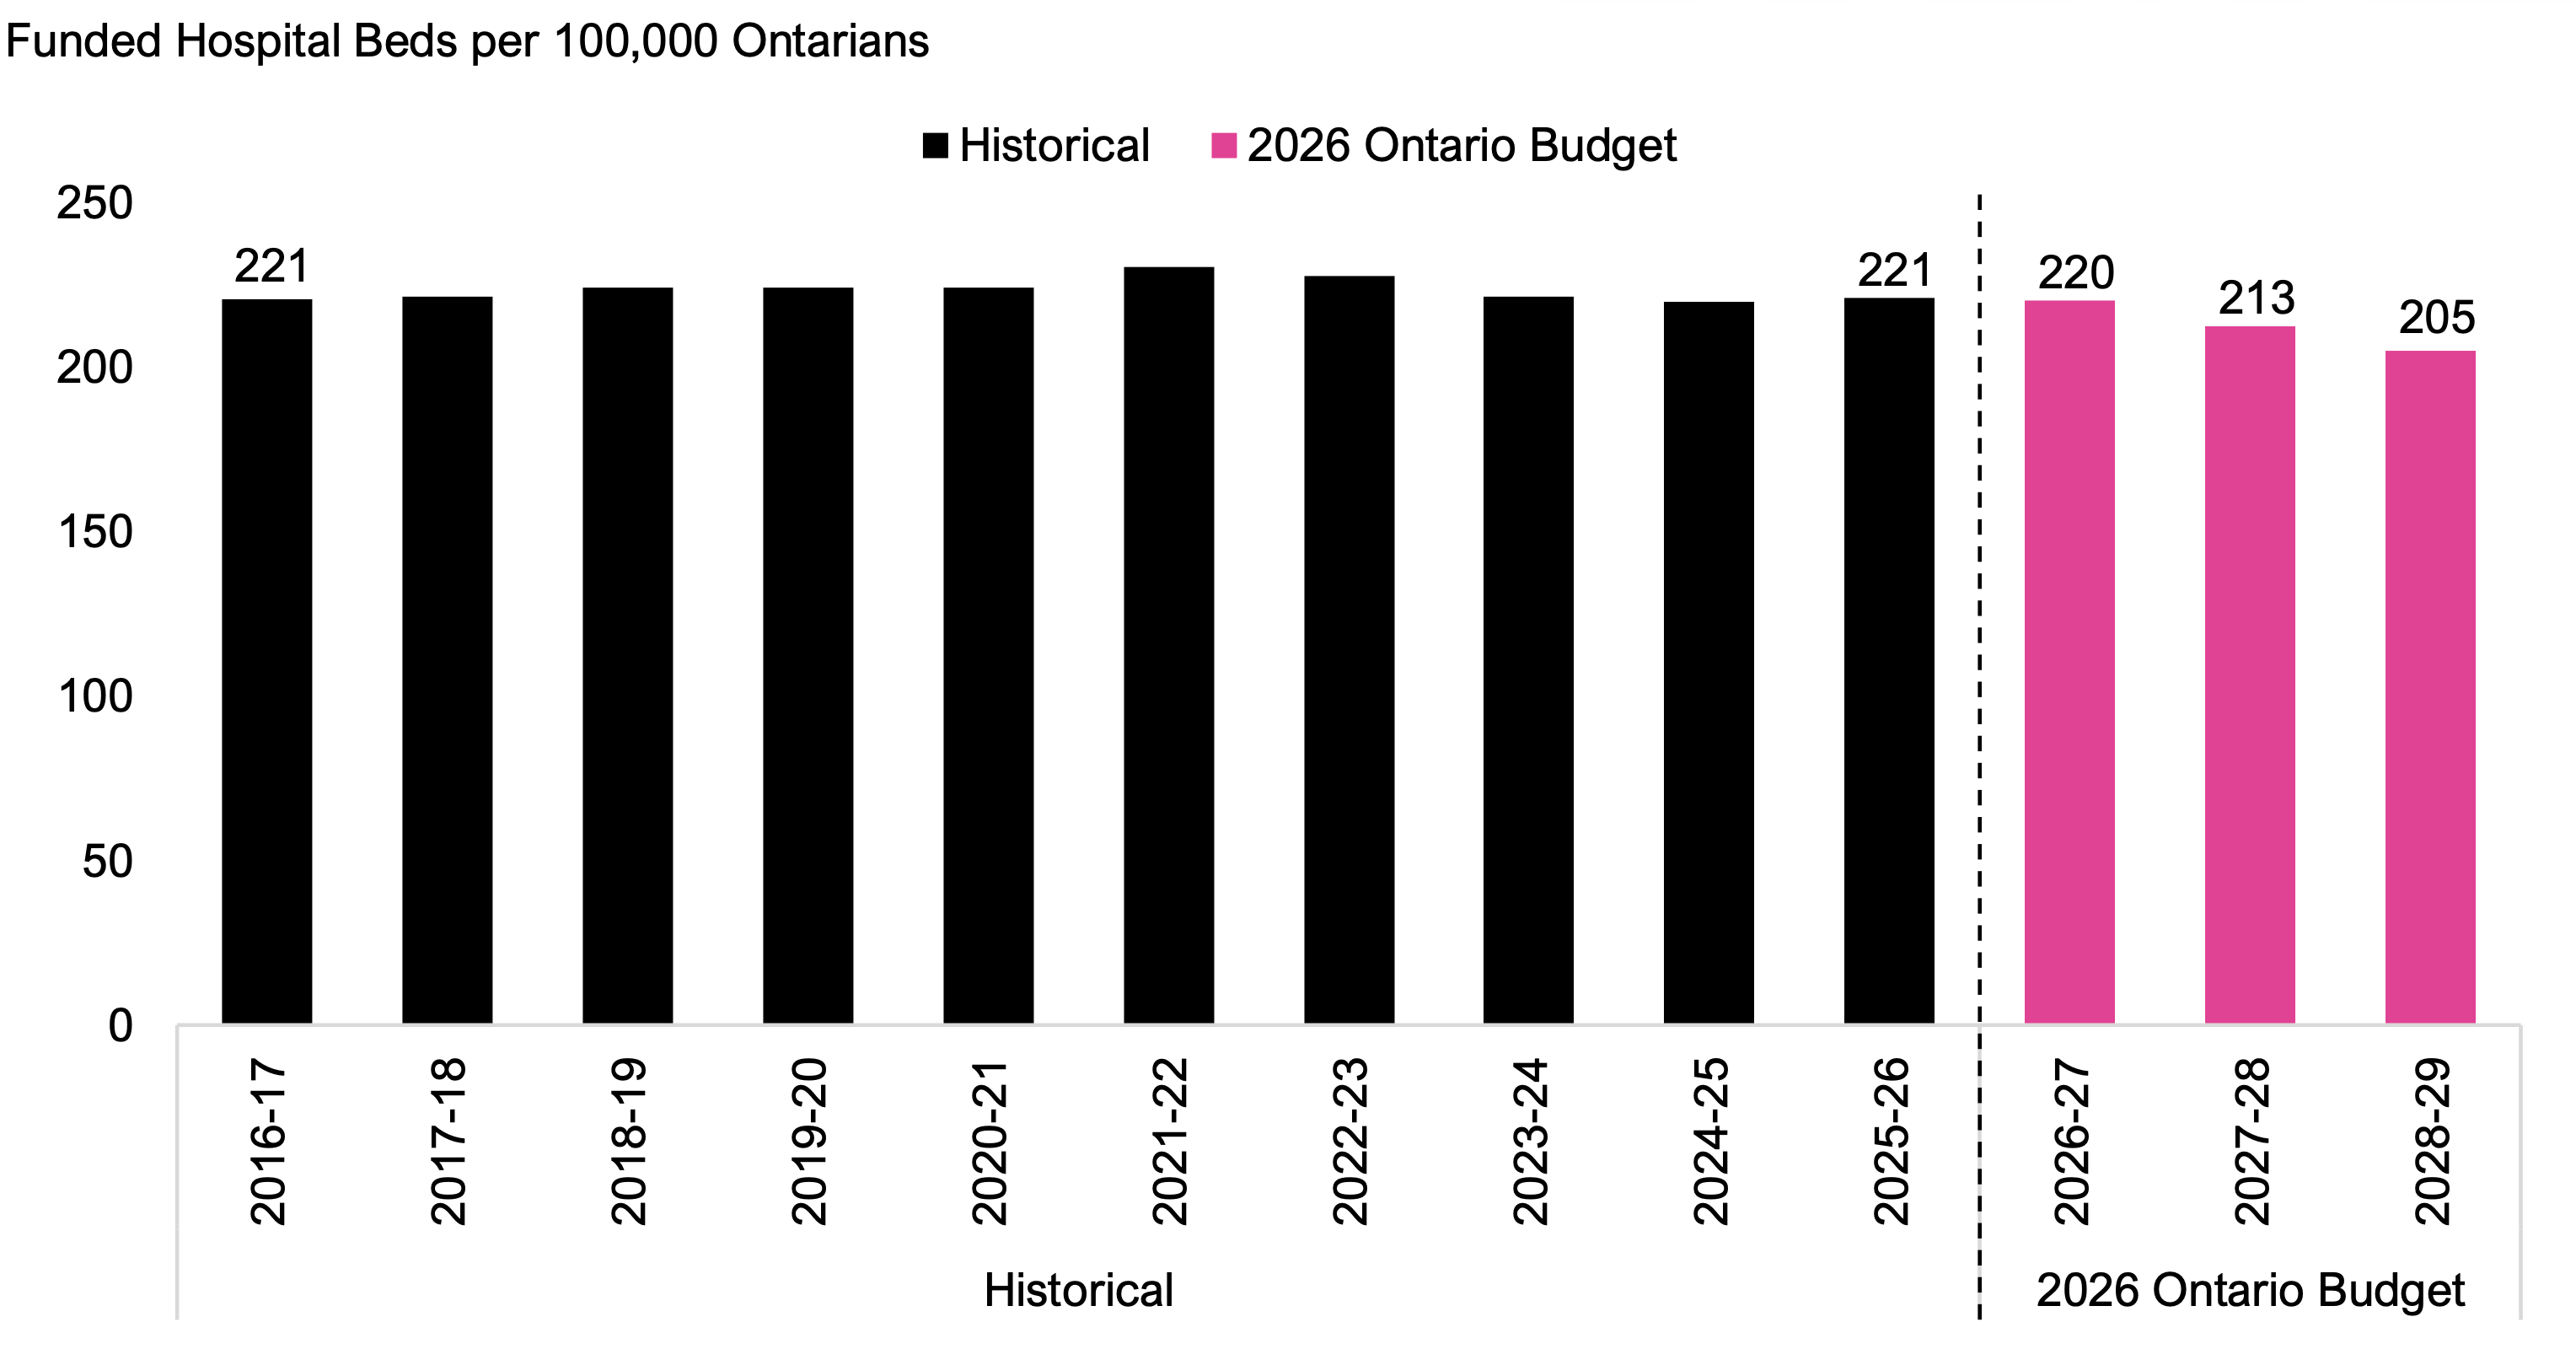
In 2025-26, there were 35,850 funded hospital beds in Ontario.[3] Based on the 2026 budget health sector spending plan, the FAO projects that there would be sufficient funding for 33,443 hospital beds in 2028‑29, a decrease of 2,407 funded hospital beds from 2025-26 levels.
On a per-capita basis, this represents a decline from 221 funded hospital beds per 100,000 Ontarians in 2025‑26 to 205 funded hospital beds per 100,000 Ontarians in 2028-29.[4]
Figure 4.1 Number of funded hospital beds per 100,000 Ontarians, 2016-17 to 2028-29
Note: Funded hospital beds represent hospital beds that have been allocated operating funding by the Province and are actively staffed and available to patients.
Source: FAO analysis of information provided by the Province, CIHI: Spending Trends in Health Service Delivery, 2014-2015 to 2023-2024 – Data Tables – Table 5: Hospital Beds Staffed and in Operation, and Ontario Health Coalition: Hospital Beds Staffed and in Operation Ontario 1990 to 2014.
Accessible version
| Historical | 2026 Ontario Budget | ||
|---|---|---|---|
| Historical | 2016-17 | 221 | |
| Historical | 2017-18 | 222 | |
| Historical | 2018-19 | 224 | |
| Historical | 2019-20 | 224 | |
| Historical | 2020-21 | 224 | |
| Historical | 2021-22 | 230 | |
| Historical | 2022-23 | 228 | |
| Historical | 2023-24 | 221 | |
| Historical | 2024-25 | 220 | |
| Historical | 2025-26 | 221 | |
| 2026 Ontario Budget | 2026-27 | 220 | |
| 2026 Ontario Budget | 2027-28 | 213 | |
| 2026 Ontario Budget | 2028-29 | 205 |
Long-Term Care Beds
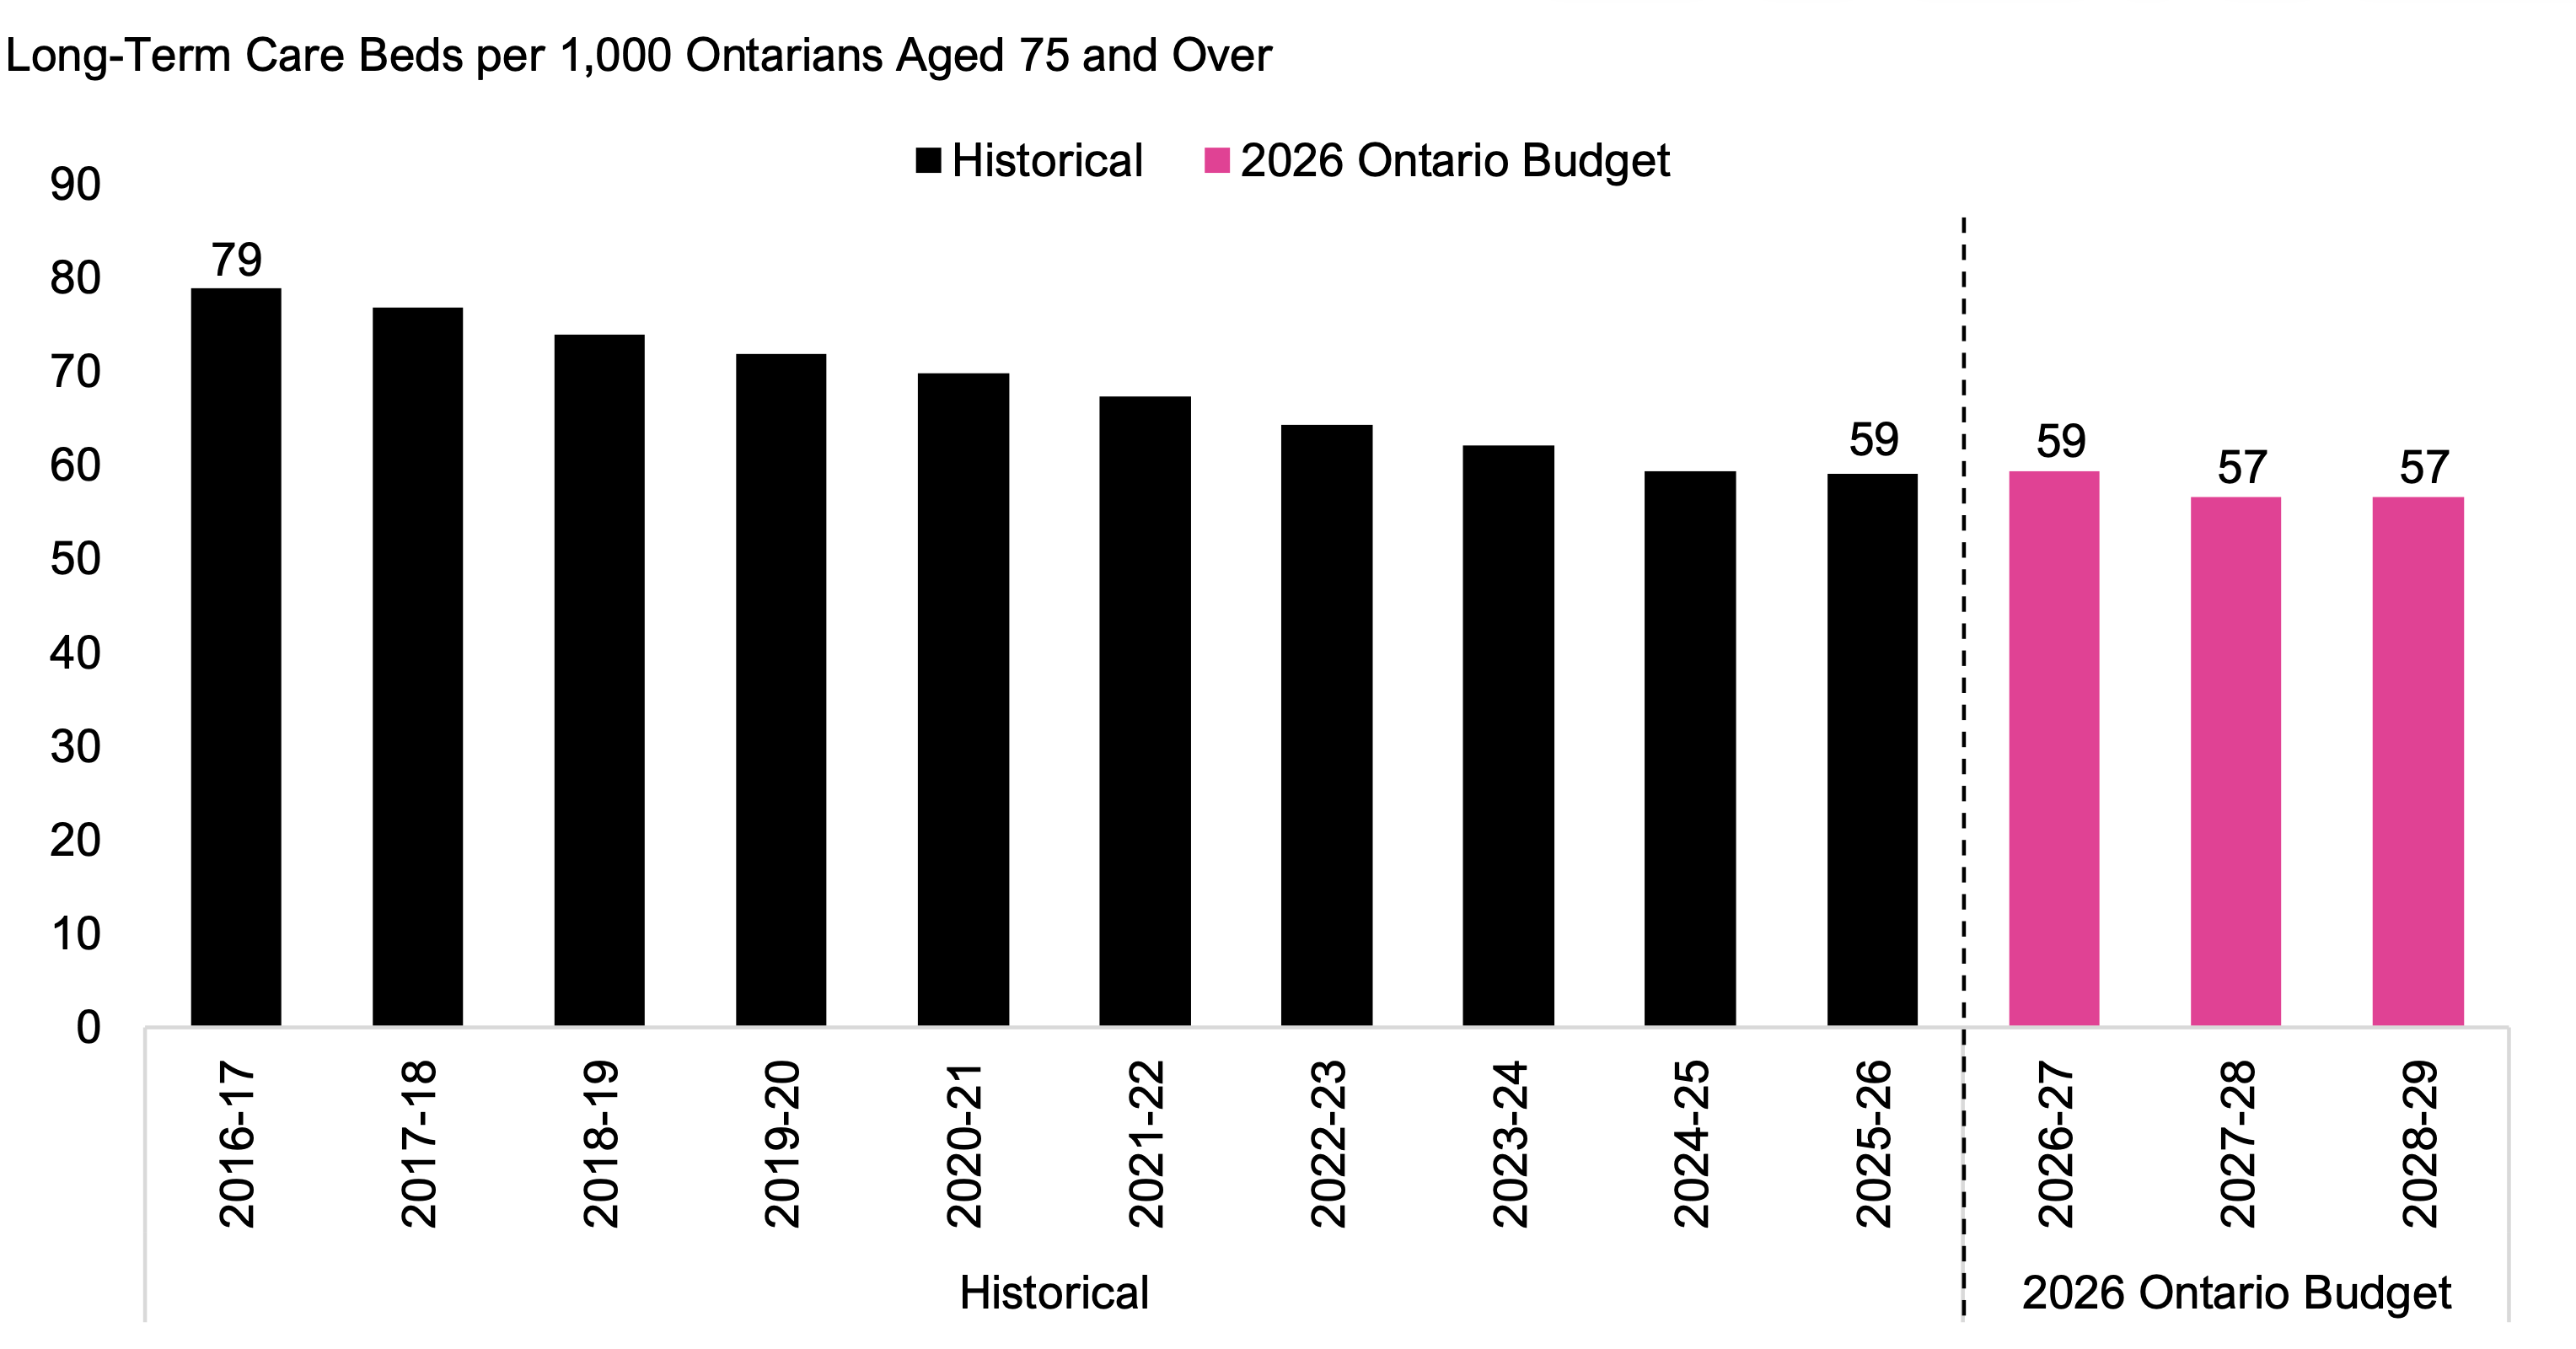
There were 82,128 long-term care beds in Ontario in 2025-26. Based on the 2026 budget health sector spending plan, the FAO projects that there would be sufficient funding for 88,324 long-term care beds in 2028‑29, an increase of 6,196 beds from 2025-26 levels.
On a per-capita basis, this represents a decline from 59 long-term care beds per 1,000 Ontarians aged 75 and over[5] in 2025-26 to 57 long-term care beds per 1,000 Ontarians aged 75 and over in 2028-29, as the projected growth rate in Ontarians aged 75 and over is expected to outpace the growth in the number of long‑term care beds.[6]
Figure 4.2 Number of long-term care beds per 1,000 Ontarians aged 75 and over, 2016-17 to 2028-29
Source: FAO analysis of information provided by the Province.
Accessible version
| Historical | 2026 Ontario Budget | ||
|---|---|---|---|
| Historical | 2016-17 | 79 | |
| Historical | 2017-18 | 77 | |
| Historical | 2018-19 | 74 | |
| Historical | 2019-20 | 72 | |
| Historical | 2020-21 | 70 | |
| Historical | 2021-22 | 67 | |
| Historical | 2022-23 | 64 | |
| Historical | 2023-24 | 62 | |
| Historical | 2024-25 | 59 | |
| Historical | 2025-26 | 59 | |
| 2026 Ontario Budget | 2026-27 | 59 | |
| 2026 Ontario Budget | 2027-28 | 57 | |
| 2026 Ontario Budget | 2028-29 | 57 |
Nurses
Provincially funded nurses, which include registered nurses, nurse practitioners and licensed practical nurses, are employed in hospitals, long-term care homes, clinics and many other health care settings.
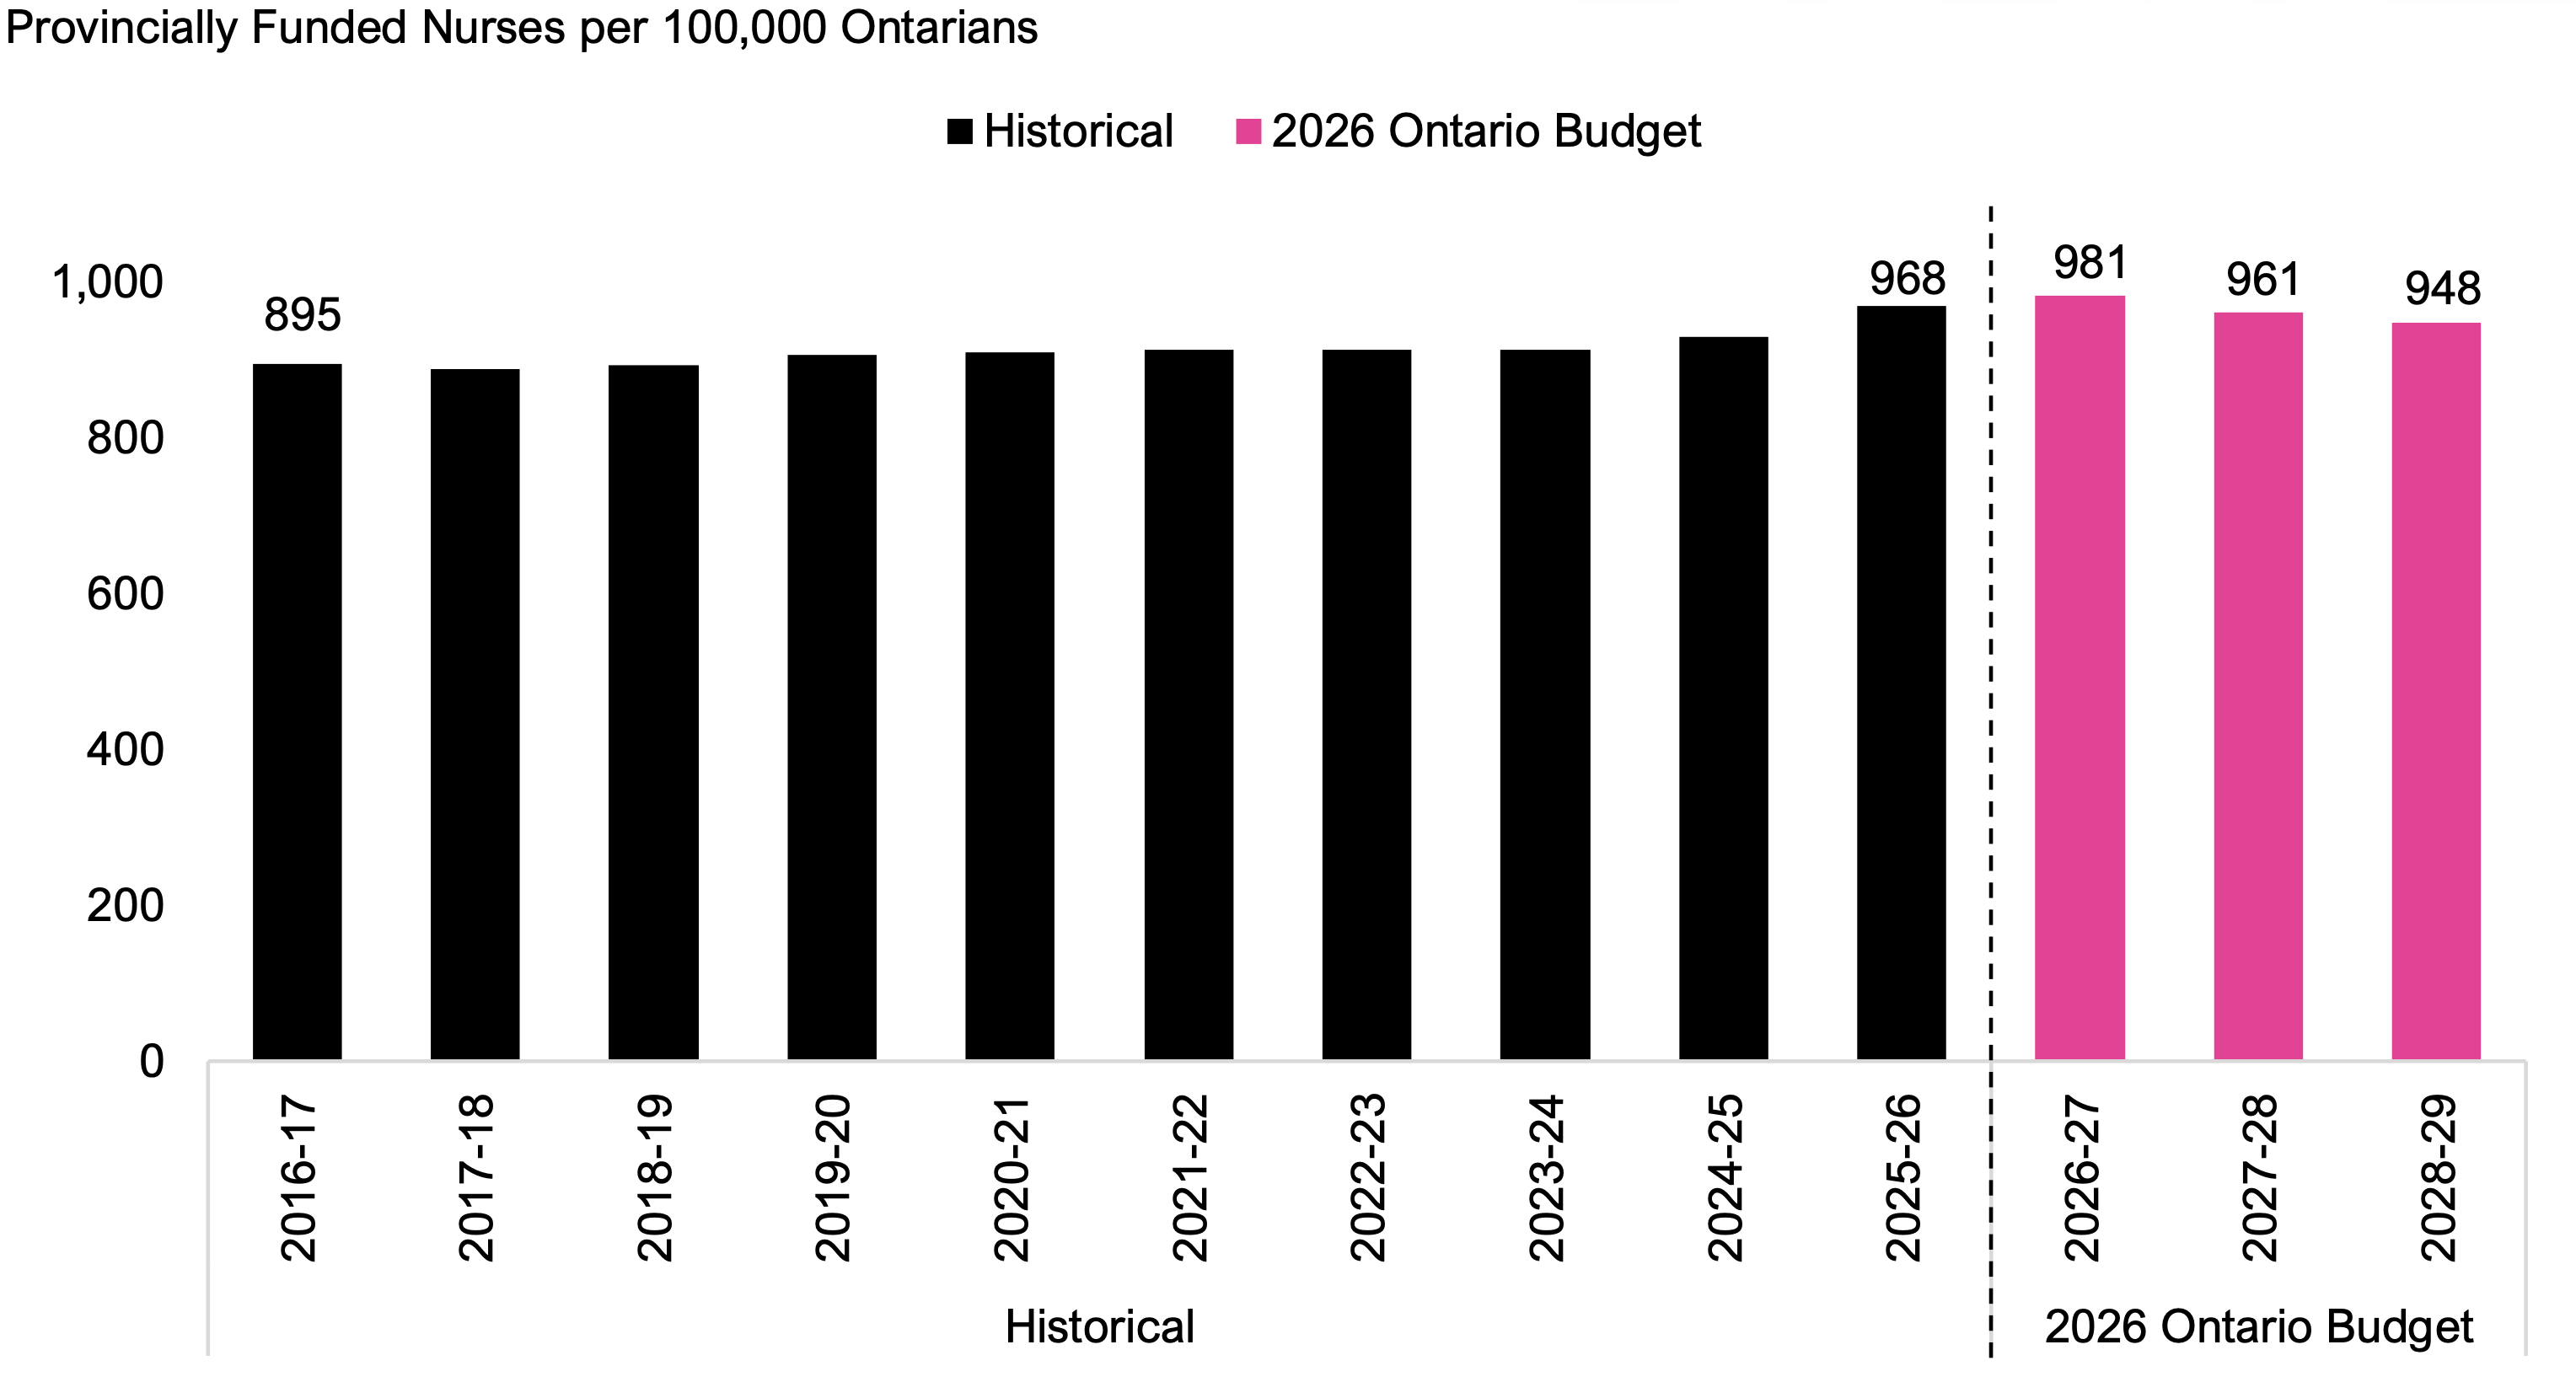
The FAO estimates that in 2025-26, there were 157,062 provincially funded nurses in the health sector. Based on the 2026 budget health sector spending plan, the FAO projects that there would be sufficient funding for 154,540 provincially funded nurses in 2028-29, a decrease of 2,522 provincially funded nurses from 2025‑26 levels.
On a per-capita basis, this represents a decline from 968 provincially funded nurses per 100,000 Ontarians in 2025-26 to 948 provincially funded nurses per 100,000 Ontarians in 2028-29.
Figure 4.3 Number of provincially funded nurses per 100,000 Ontarians, 2016-17 to 2028-29
Source: FAO analysis of information provided by the Province and CIHI: Nursing in Canada, 2025: Table 4a – Workforce of regulated nurses, by jurisdiction.
Accessible version
| Historical | 2026 Ontario Budget | ||
|---|---|---|---|
| Historical | 2016-17 | 895 | |
| Historical | 2017-18 | 888 | |
| Historical | 2018-19 | 892 | |
| Historical | 2019-20 | 907 | |
| Historical | 2020-21 | 909 | |
| Historical | 2021-22 | 913 | |
| Historical | 2022-23 | 912 | |
| Historical | 2023-24 | 912 | |
| Historical | 2024-25 | 930 | |
| Historical | 2025-26 | 968 | |
| 2026 Ontario Budget | 2026-27 | 981 | |
| 2026 Ontario Budget | 2027-28 | 961 | |
| 2026 Ontario Budget | 2028-29 | 948 |
Personal Support Workers
Provincially funded personal support workers (PSWs) provide care in long-term care homes, hospitals, and home and community care.
The FAO estimates that in 2025-26, there were 121,592 provincially funded PSWs in the health sector. Based on the 2026 budget health sector spending plan, the FAO projects that the number of provincially funded PSWs would increase by 3,455, reaching 125,047 PSWs in 2028-29.
On a per-capita basis, this represents an increase from 750 provincially funded PSWs per 100,000 Ontarians in 2025-26 to 767 provincially funded PSWs per 100,000 Ontarians in 2028-29.
Figure 4.4 Number of provincially funded personal support workers per 100,000 Ontarians, 2021-22 to 2028-29
Source: FAO analysis of information provided by the Province.
Accessible version
| Historical | 2026 Ontario Budget | ||
|---|---|---|---|
| Historical | 2021-22 | 684 | |
| Historical | 2022-23 | 689 | |
| Historical | 2023-24 | 725 | |
| Historical | 2024-25 | 735 | |
| Historical | 2025-26 | 750 | |
| 2026 Ontario Budget | 2026-27 | 783 | |
| 2026 Ontario Budget | 2027-28 | 767 | |
| 2026 Ontario Budget | 2028-29 | 767 |
Physicians
Physicians provide care in their own practices, as well as in hospitals and community settings.
There were 37,713 physicians in Ontario in 2025-26.[7] Based on the 2026 budget health sector spending plan, the FAO projects that the Province could fund 3,761 additional physicians, reaching 41,474 physicians in 2028-29, provided that compensation levels under the current physician services agreement and other practice conditions are sufficient to attract, license and retain the additional number of physicians.[8]
On a per-capita basis, this represents an increase from 233 physicians per 100,000 Ontarians in 2025-26 to 254 physicians per 100,000 Ontarians in 2028-29.[9]
In the 2025 Ontario Budget, the government committed to connecting two million more Ontarians to a family doctor or primary care team by 2029. Based on the FAO’s projection, the funding available under the 2026 budget health sector spending plan would be sufficient to achieve this objective.
Figure 4.5 Number of provincially funded physicians per 100,000 Ontarians, 2016-17 to 2028-29
Note: The FAO’s projection represents the number of physicians that the 2026 Ontario Budget’s health sector spending plan could support, provided that compensation levels under the existing physician services agreement and other practice conditions are sufficient to attract, license and retain the funded number of physicians.
Source: FAO analysis of Ontario Physician Reporting Centre (OPRC), Physicians in Ontario Longitudinal Dataset (2009-2025), 2026.
Accessible version
| Historical | 2026 Ontario Budget | ||
|---|---|---|---|
| Historical | 2016-17 | 213 | |
| Historical | 2017-18 | 216 | |
| Historical | 2018-19 | 218 | |
| Historical | 2019-20 | 217 | |
| Historical | 2020-21 | 219 | |
| Historical | 2021-22 | 222 | |
| Historical | 2022-23 | 225 | |
| Historical | 2023-24 | 220 | |
| Historical | 2024-25 | 223 | |
| Historical | 2025-26 | 233 | |
| 2026 Ontario Budget | 2026-27 | 240 | |
| 2026 Ontario Budget | 2027-28 | 248 | |
| 2026 Ontario Budget | 2028-29 | 254 |
5. Interprovincial Comparison
At the request of the Members of Provincial Parliament, this chapter compares Ontario’s age-standardized[10] per capita health spending and select service levels with those of other provinces. The information in this chapter is for the 2023 calendar year, the latest year with comparable data.
Total Provincial Health Sector Funding
In 2023, Ontario had the second lowest age-standardized per capita health sector funding among the provinces. Ontario’s total provincial health sector funding was $5,425 per person, $379 below the national average of $5,804. Compared to the next three largest provinces by population, Ontario’s funding was lower than in Quebec ($5,755), British Columbia ($6,124) and Alberta ($6,449).
Figure 5.1 Age-standardized per capita total provincial health sector funding by province in 2023
Note: Canada average excludes territories.
Source: FAO analysis of CIHI: National Health Expenditure Trends, 2025: Data Tables – Series E1.
Accessible version
| Province | Dollars per Person, Adjusted for Population Age |
|---|---|
| NB | 5,262 |
| ON | 5,425 |
| QC | 5,755 |
| PE | 5,985 |
| BC | 6,124 |
| NS | 6,190 |
| SK | 6,217 |
| MB | 6,417 |
| AB | 6,449 |
| NL | 7,034 |
| Canada Average | 5,804 |
Provincial Hospital Funding
In 2023, Ontario had the lowest age-standardized per capita provincial funding for hospitals at $1,967, compared to the Canadian average of $2,098. Quebec ($1,980) and British Columbia ($2,057) were also below the Canadian average, while Alberta ($2,440) was above the Canadian average.
Figure 5.2 Age-standardized per capita provincial funding for hospitals in 2023
Note: Canada average excludes territories.
Source: FAO analysis of CIHI: National Health Expenditure Trends, 2025: Data Tables – Series E2.
Accessible version
| Province | Dollars per Person, Adjusted for Population Age |
|---|---|
| ON | 1,967 |
| QC | 1,980 |
| BC | 2,057 |
| PE | 2,245 |
| NL | 2,253 |
| NB | 2,338 |
| SK | 2,406 |
| AB | 2,440 |
| MB | 2,563 |
| NS | 2,715 |
| Canada Average | 2,098 |
Hospital Beds
In 2023, Ontario had 229 hospital beds per age-standardized 100,000 population, which was below the national average of 245 hospital beds. This placed Ontario ahead of British Columbia (224) but below Alberta (279).
Figure 5.3 Age-standardized number of hospital beds per 100,000 population by province in 2023
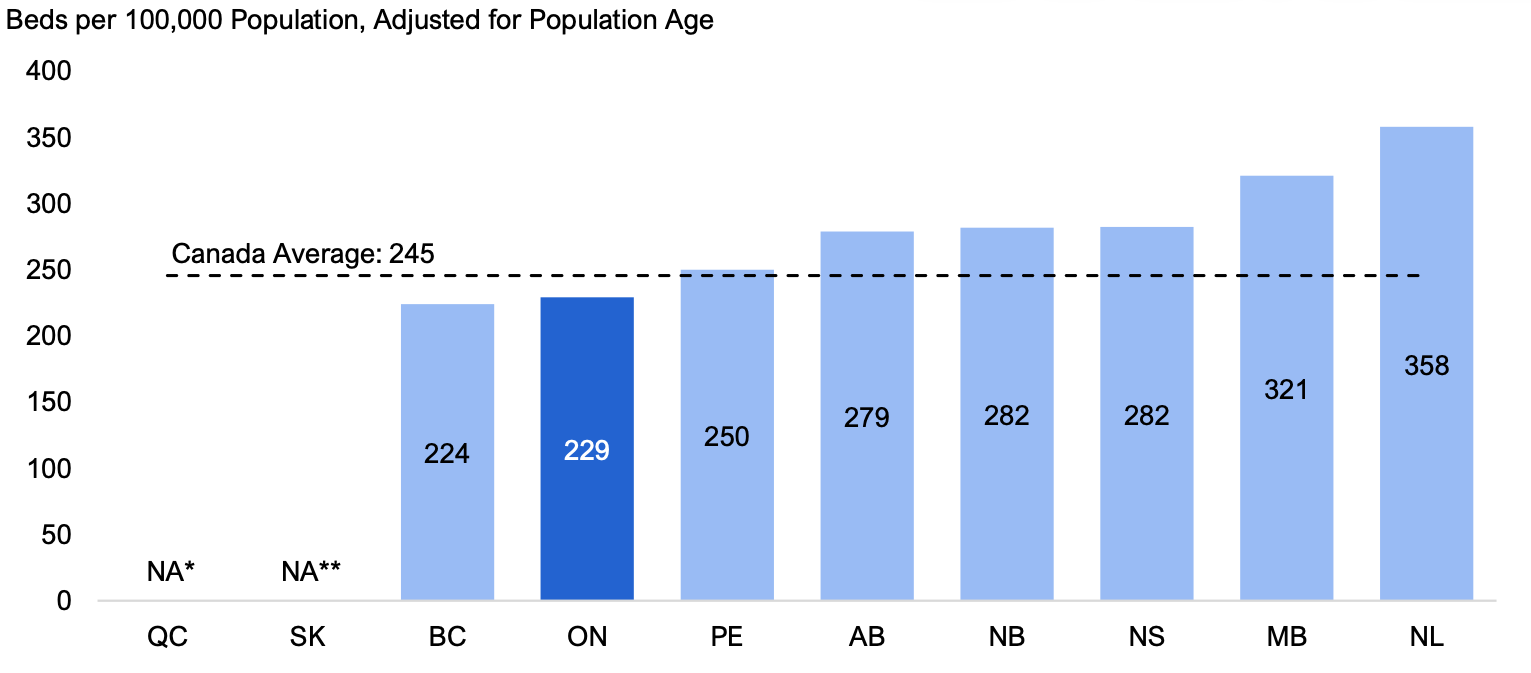
* Excludes Quebec as the province does not report hospital-based long-term care beds (referred to as chronic care beds in Ontario) to CIHI. These beds are distinct from long-term care beds in residential facilities.
** Excludes Saskatchewan as CIHI does not report mental health, rehabilitation and rated bed capacity for this province. Note: Canada average excludes Quebec, Saskatchewan and territories.
Source: FAO analysis of CIHI: Spending Trends in Health Service Delivery, 2014-2015 to 2023-2024 – Data Tables – Table 5: Hospital Beds Staffed and in Operation.
Accessible version
| Province | Beds per 100,000 Population, Adjusted for Population Age |
|---|---|
| QC | NA* |
| SK | NA** |
| BC | 224 |
| ON | 229 |
| PE | 250 |
| AB | 279 |
| NB | 282 |
| NS | 282 |
| MB | 321 |
| NL | 358 |
| Canada Average | 245 |
Spending on Physicians
In 2023, Ontario had above average age-standardized per capita spending on physicians, at $1,174 per person. Ontario’s spending on physicians was higher than spending by British Columbia ($1,173) and Quebec ($946) but lower than spending by Alberta ($1,408).
Figure 5.4 Age-standardized per capita spending on physicians by province in 2023
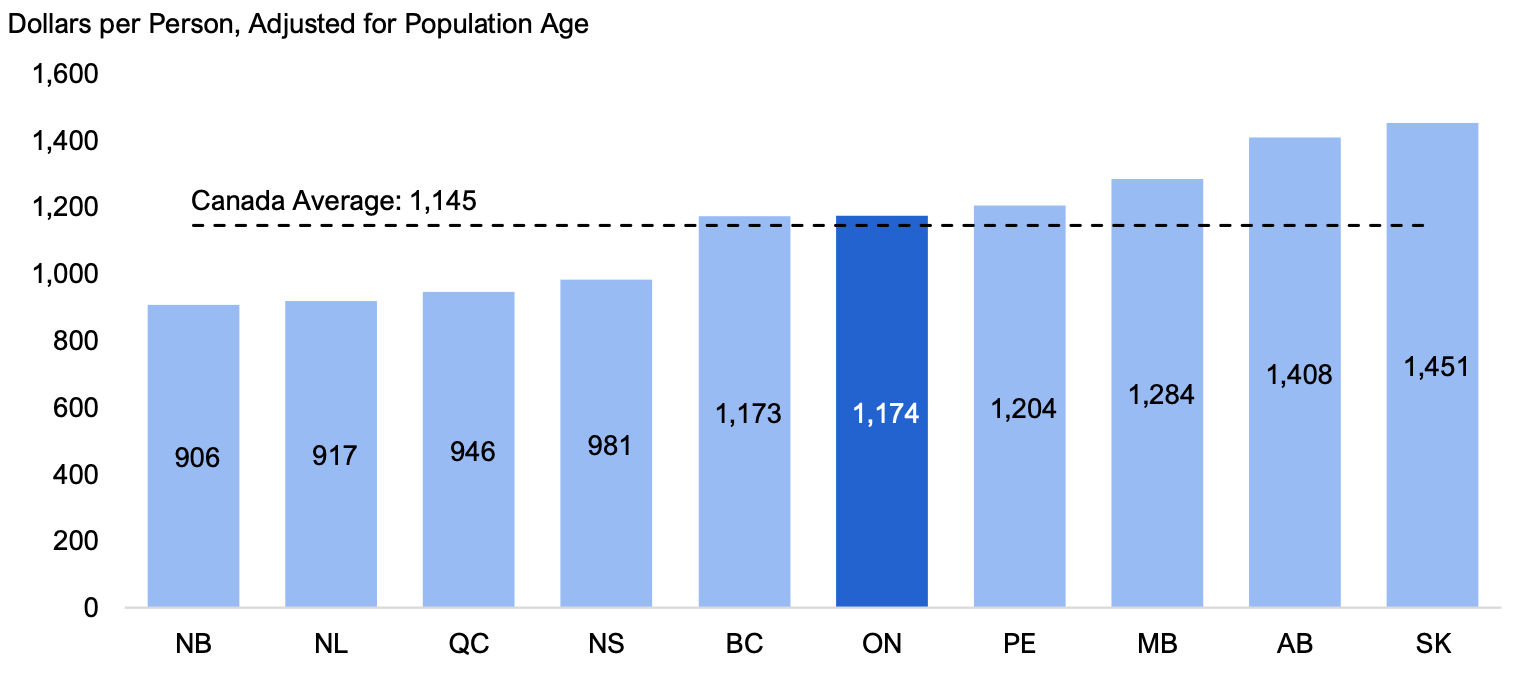
Note: Canada average excludes territories.
Source: FAO analysis of CIHI: National Health Expenditure Trends, 2025: Data Tables – Series E4.
Accessible version
| Province | Dollars per Person, Adjusted for Population Age |
|---|---|
| NB | 906 |
| NL | 917 |
| QC | 946 |
| NS | 981 |
| BC | 1,173 |
| ON | 1,174 |
| PE | 1,204 |
| MB | 1,284 |
| AB | 1,408 |
| SK | 1,451 |
| Canada Average | 1,145 |
Number of Physicians
In 2023, Ontario had the second lowest number of physicians among the provinces, after adjusting for population and population age, with 225 physicians per 100,000 population. Ontario was below the Canadian average (242), Quebec (250), Alberta (256) and British Columbia (265).
Figure 5.5 Age-standardized number of physicians per 100,000 population by province in 2023
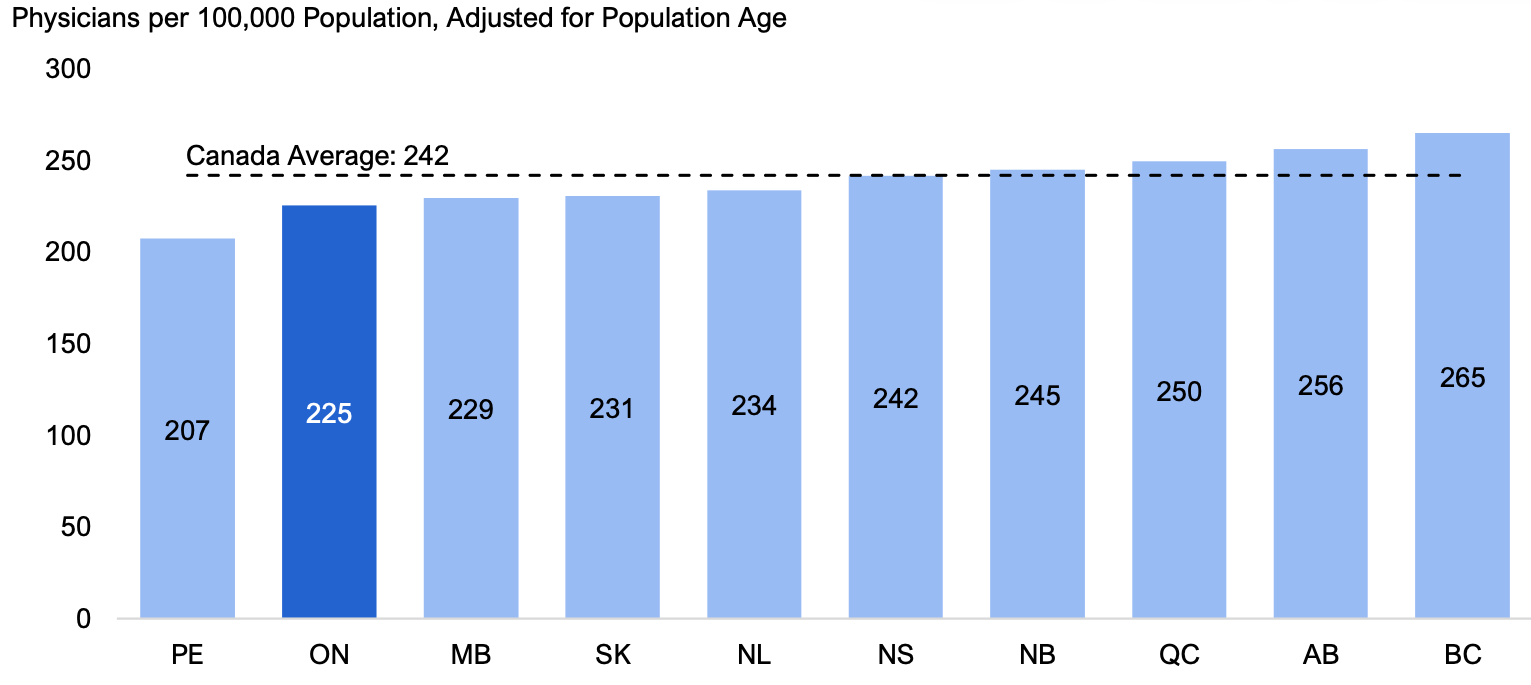
Note: Canada average excludes territories. The physician count reported in this chapter differs from the number presented in Chapter 4 because it is based on CIHI data rather than OPRC data. CIHI’s standardized national methodology supports interprovincial comparisons, while OPRC data are used for Ontario-specific workforce analysis. As a result, physician counts may differ between the two sources.
Source: FAO analysis of CIHI: Supply, Distribution and Migration of Physicians in Canada, 2001 to 2024 – Historical Data.
Accessible version
| Province | Physicians per 100,000 Population, Adjusted for Population Age |
|---|---|
| PE | 207 |
| ON | 225 |
| MB | 229 |
| SK | 231 |
| NL | 234 |
| NS | 242 |
| NB | 245 |
| QC | 250 |
| AB | 256 |
| BC | 265 |
| Canada Average | 242 |
Public Drug Spending
In 2023, Ontario ranked second among the provinces for age-standardized per capita public drug spending, at $454 per person, above the national average of $366. Ontario was second only to Alberta ($495) and ahead of British Columbia ($244) and Quebec ($276).
Figure 5.6 Age-standardized per capita public drug spending by province in 2023
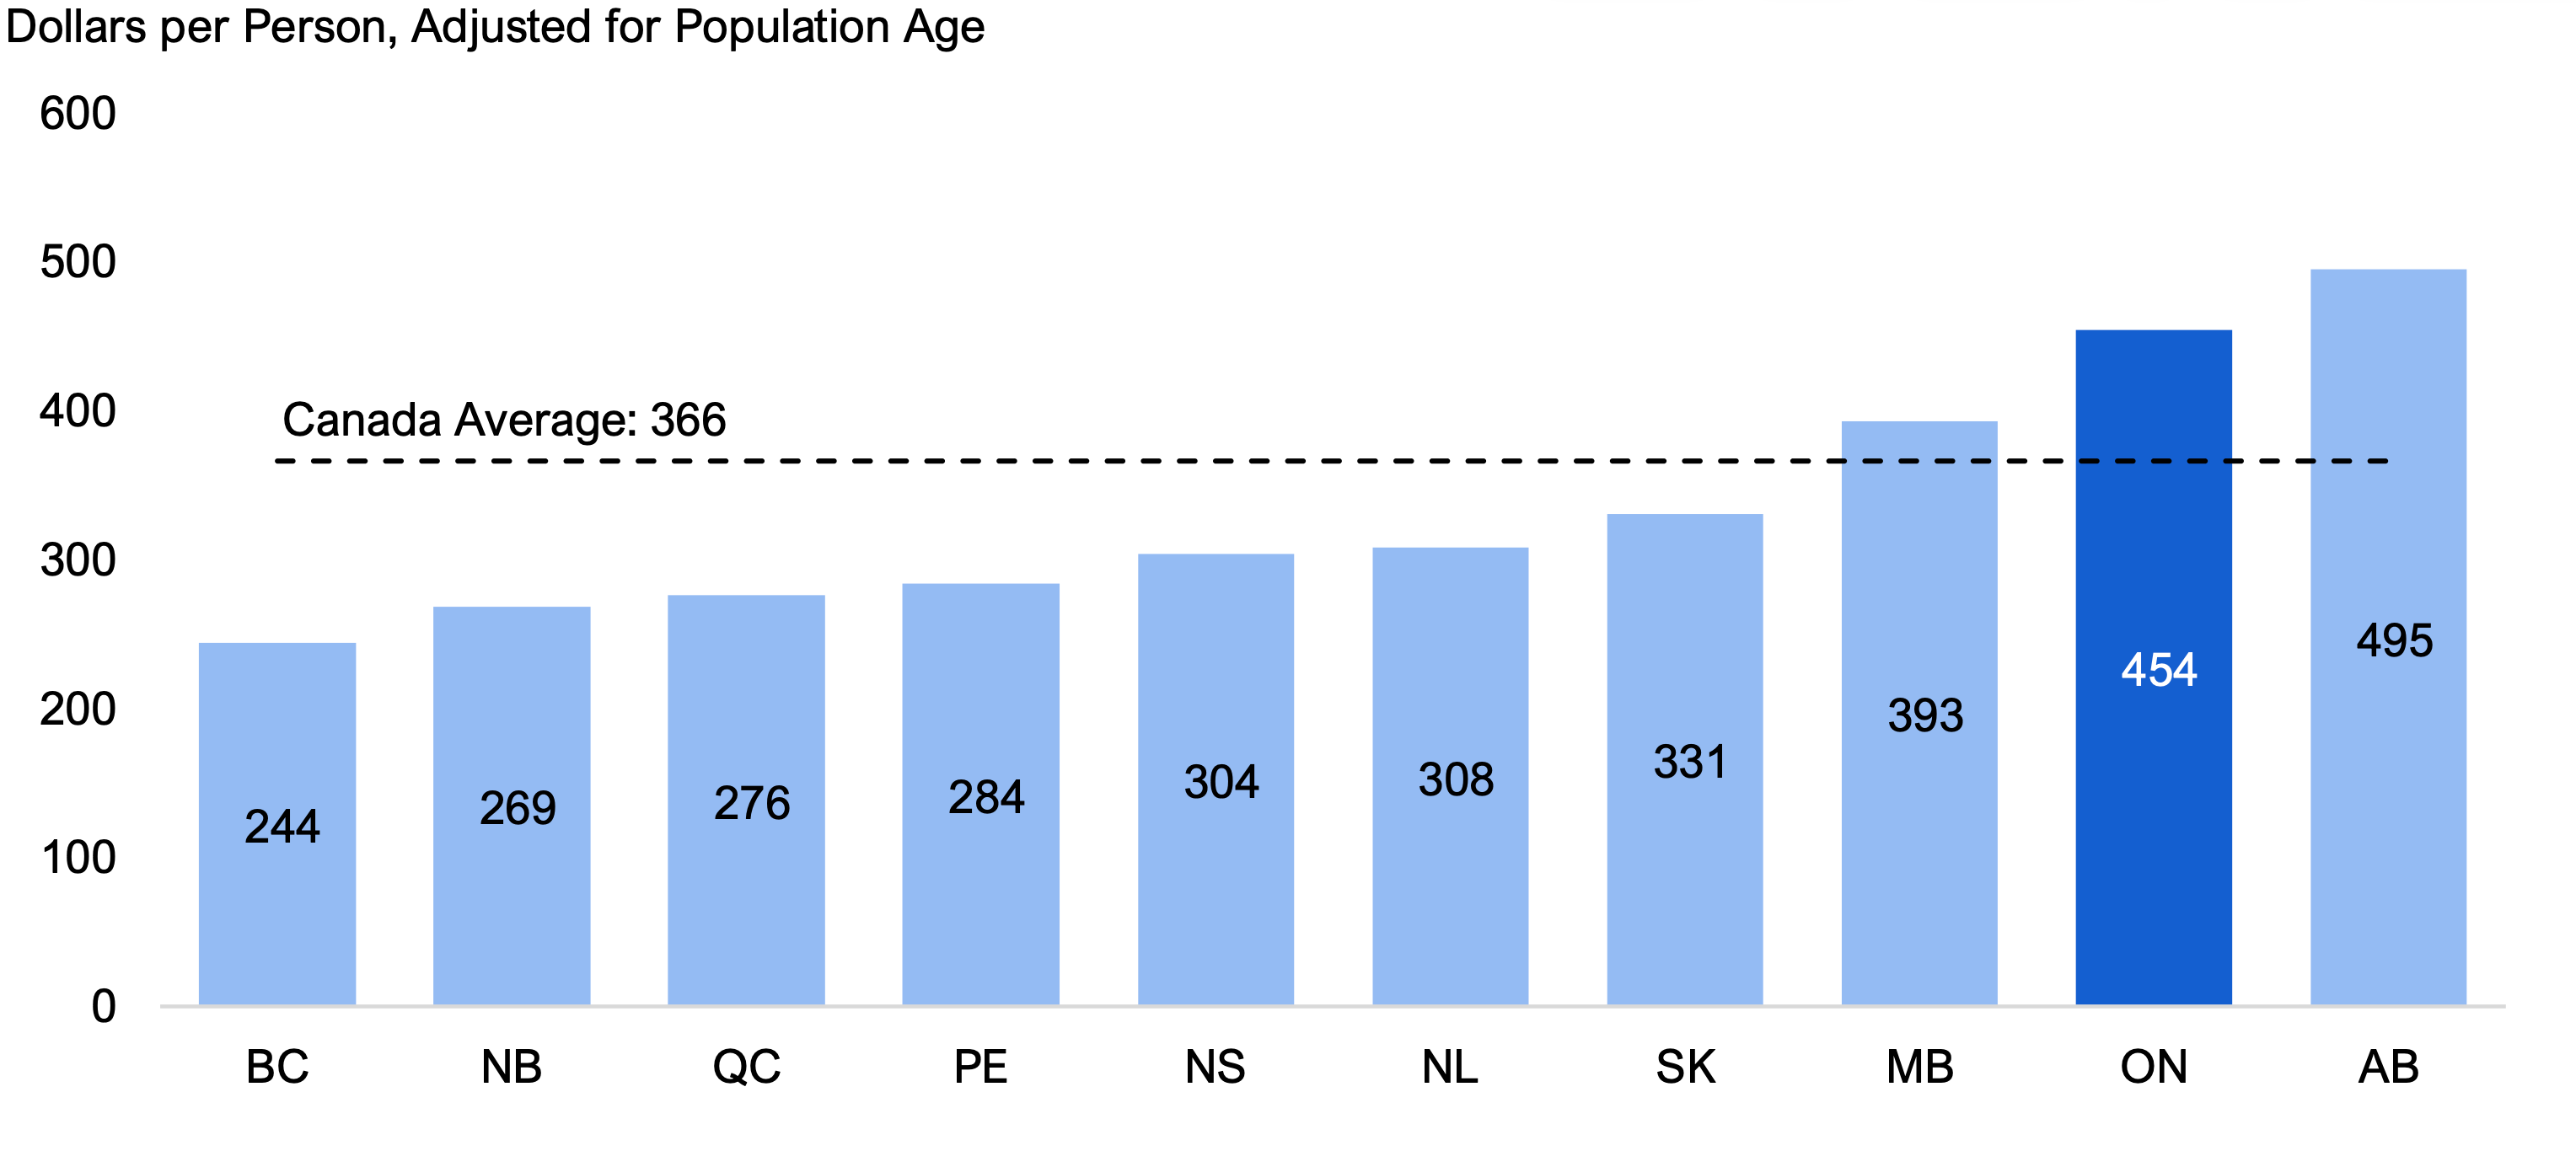
Note: Canada average excludes territories.
Source: FAO analysis of CIHI: National Health Expenditure Trends, 2025: Data Tables – Series E6.
Accessible version
| Province | Dollars per Person, Adjusted for Population Age |
|---|---|
| BC | 244 |
| NB | 269 |
| QC | 276 |
| PE | 284 |
| NS | 304 |
| NL | 308 |
| SK | 331 |
| MB | 393 |
| ON | 454 |
| AB | 495 |
| Canada Average | 366 |
Footnotes
[1] The projected increase represents the number of additional physicians that planned funding could support and not necessarily the number who will enter or remain in practice. Achieving this increase would depend on compensation and broader practice conditions being sufficient to attract, license and retain the required number of physicians.
[2] FAO, Government Spending Trends: 1990 to 2023 and FAO calculations.
[3] Funded hospital beds represent hospital beds that have been allocated operating funding by the Province and are actively staffed and available to patients.
[4] For a long-term historical analysis of the number of hospital beds in Ontario, see FAO, Government Spending Trends: 1990 to 2023.
[5] Over 90 per cent of long-term care residents are aged 75 and over, CIHI, Profile of Residents in Residential and Hospital-Based Continuing Care, 2023–2024, Table 3.
[6] For a long-term historical analysis of the number of long-term care beds in Ontario, see FAO, Government Spending Trends: 1990 to 2023.
[7] Ontario Physician Reporting Centre, Physicians in Ontario Longitudinal Dataset (2009-2025) – Hamilton, ON: OPRC; 2026.
[8] Unlike nurses and PSWs, physicians are typically not direct employees of the Province. Instead, they are largely independent practitioners who are mainly paid through the Ontario Health Insurance Program (OHIP), under agreements negotiated between the Ministry of Health and the Ontario Medical Association (OMA). Consequently, the projected increase represents the number of additional physicians that planned funding could support and not necessarily the number who will enter or remain in practice. Achieving this increase would depend on compensation and broader practice conditions being sufficient to attract, license and retain the required number of physicians.
[9] For a long-term historical analysis of the number of physicians in Ontario, see FAO, Government Spending Trends: 1990 to 2023.
[10] Spending and service levels have been age-standardized to account for differences in population age structures across provinces. Because older populations typically require more health care services, age standardization adjusts spending and service level estimates as if each province had the same age distribution as Ontario, enabling more meaningful comparisons.