
1. Summary
At the request of Members of Provincial Parliament, this report reviews the Government of Ontario’s (the Province’s) Ministry of Children, Community and Social Services (MCCSS or ministry) spending plan as outlined in the 2026 Ontario Budget.
Spending Plan Overview
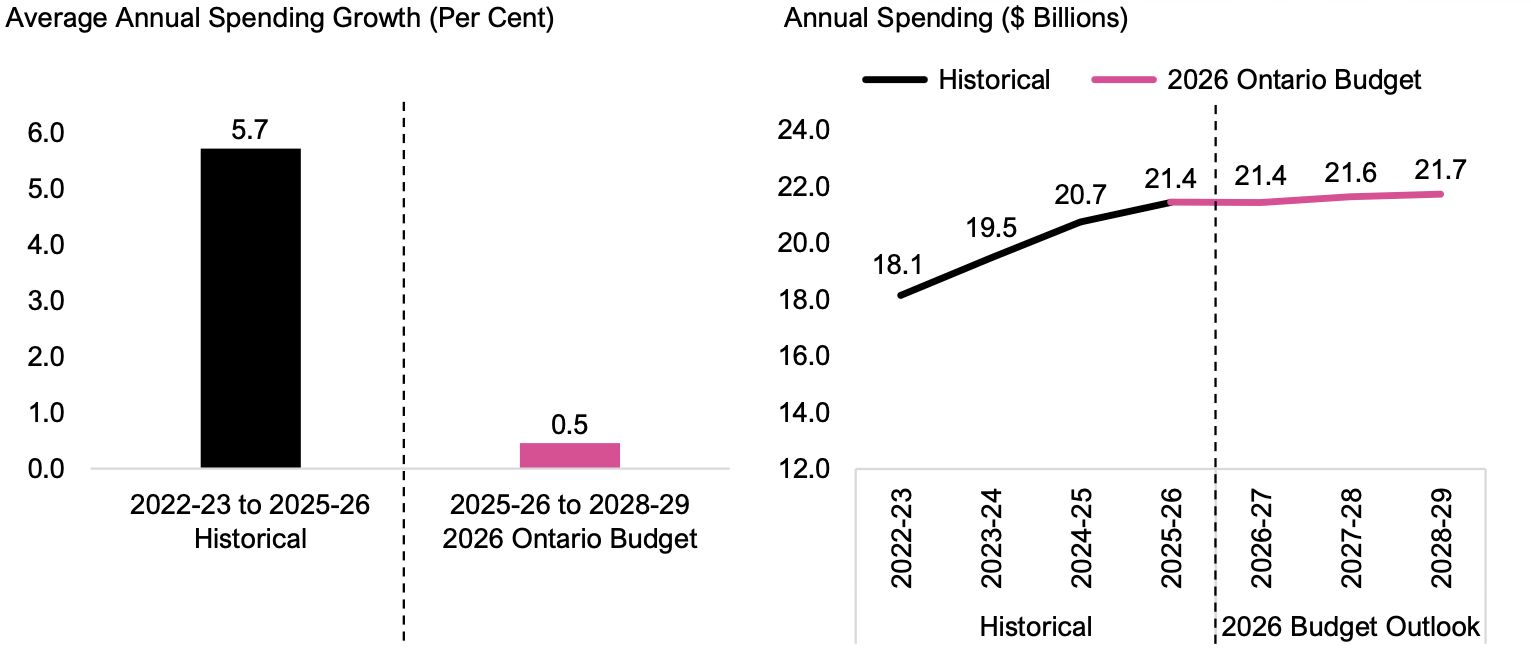
- In the 2026 Ontario Budget, the Province projects that MCCSS spending will grow at an average annual rate of 0.5 per cent, from $21.4 billion in 2025-26 to $21.7 billion in 2028-29.
- This is a significantly slower pace than the 5.7 per cent average annual growth over the previous three years from 2022-23 to 2025-26.
- For context, over the 36-year period from 1990-91 to 2025-26, MCCSS spending grew at an average annual rate of 3.2 per cent. If the Province’s MCCSS spending plan in the 2026 budget is achieved, it would be the slowest three-year growth rate since 1999-00 to 2002-03.
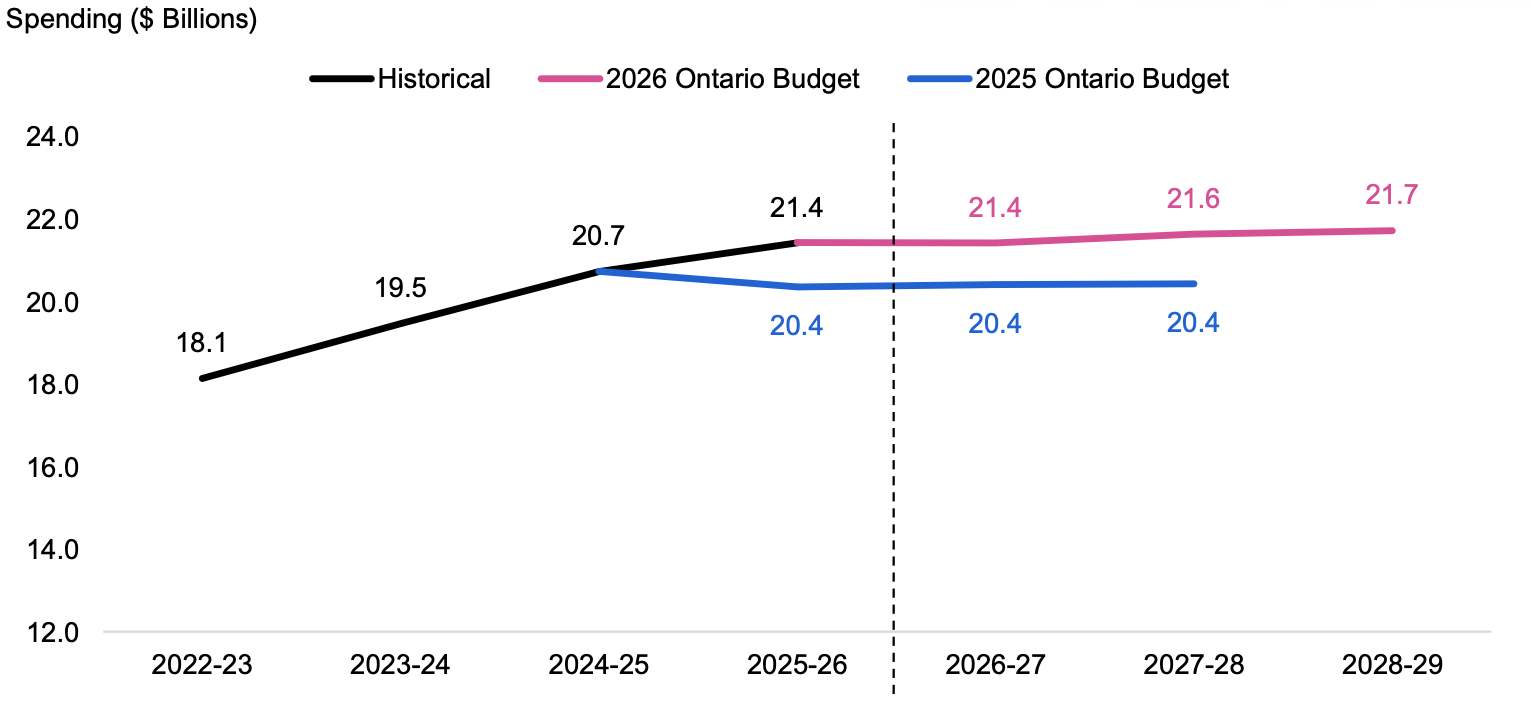
- Compared to the MCCSS spending plan in the 2025 Ontario Budget, the MCCSS spending plan in the 2026 Ontario Budget has increased by a total of $3.3 billion from 2025-26 to 2027-28. This includes additional spending of $1.1 billion in 2025-26, $1.0 billion in 2026-27 and $1.2 billion in 2027-28.
- The FAO estimated MCCSS spending from 2026-27 to 2028-29 that would be required to maintain 2025-26 service levels. Also known as a cost driver projection, this scenario does not recommend how spending should change but serves as a benchmark to show whether the 2026 budget’s MCCSS spending plan is likely to maintain, improve or reduce the quality and accessibility of ministry services.
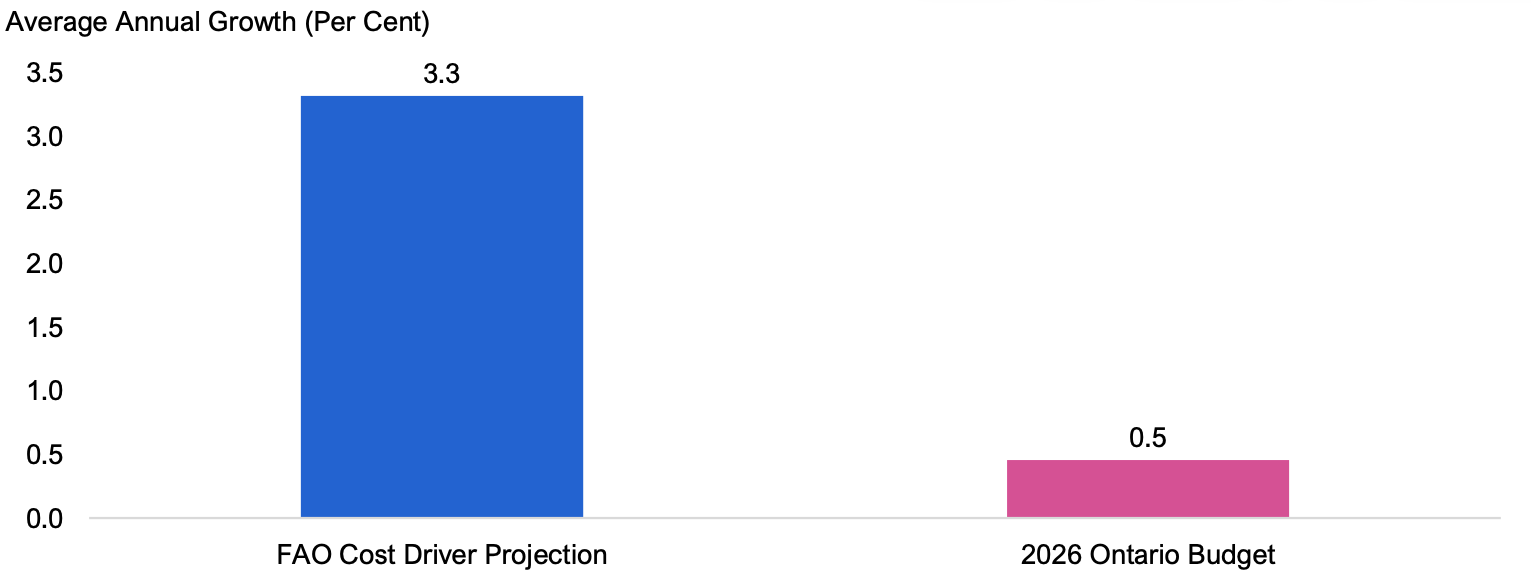
- Overall, the FAO estimates that MCCSS spending would need to grow by an average annual rate of 3.3 per cent over the next three years to maintain current service levels.
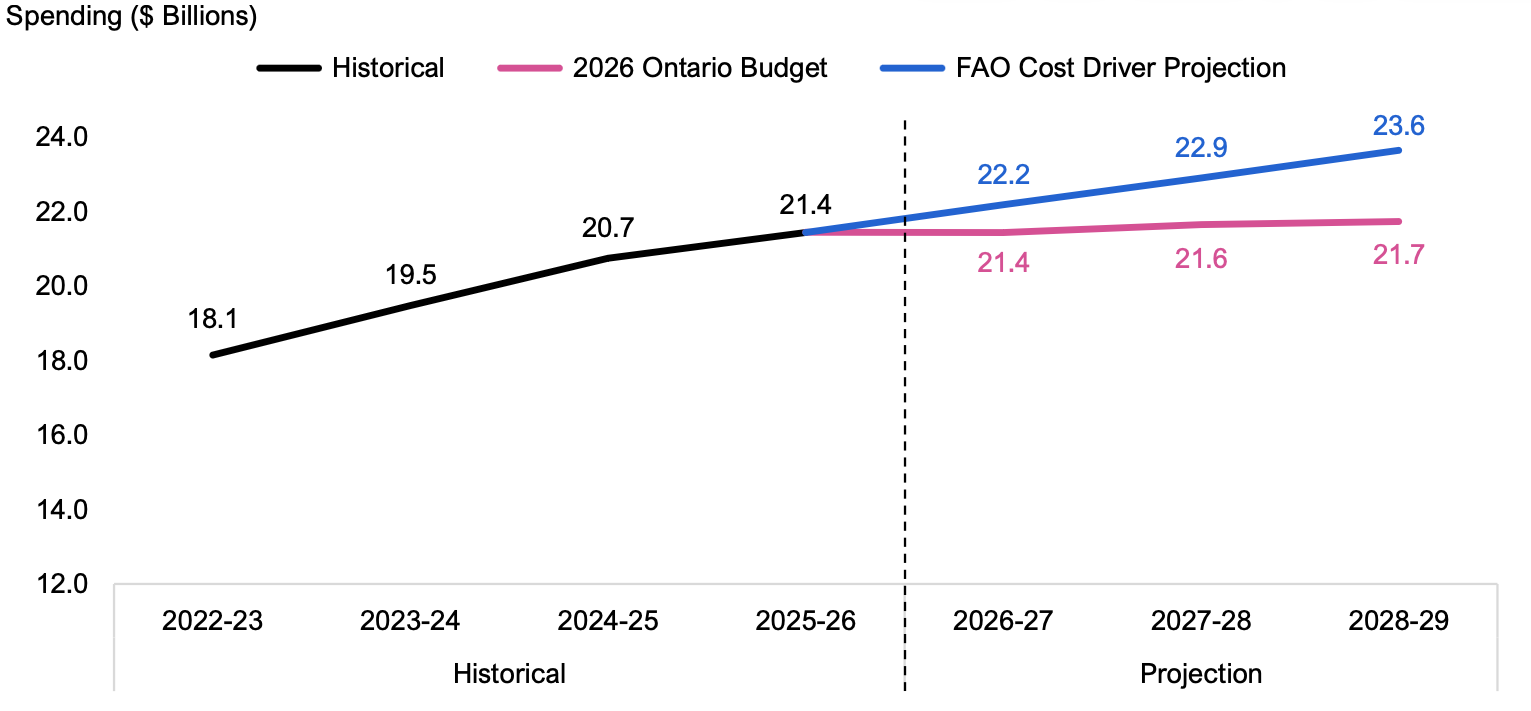
- The 2026 budget spending plan is below the FAO’s cost driver projection by $0.7 billion in 2026‑27, $1.3 billion in 2027-28 and $1.9 billion in 2028-29. This means that, to maintain current service levels, the Province will need to implement program efficiencies (i.e., provide the same level of services with less resources) and/or commit additional funding beyond what was planned in the 2026 Ontario Budget.
Spending Plan Analysis
Ontario Disability Support Program – Financial Assistance
- The Ontario Disability Support Program (ODSP) – Financial Assistance provides direct financial assistance to Ontarians with disabilities and their families.
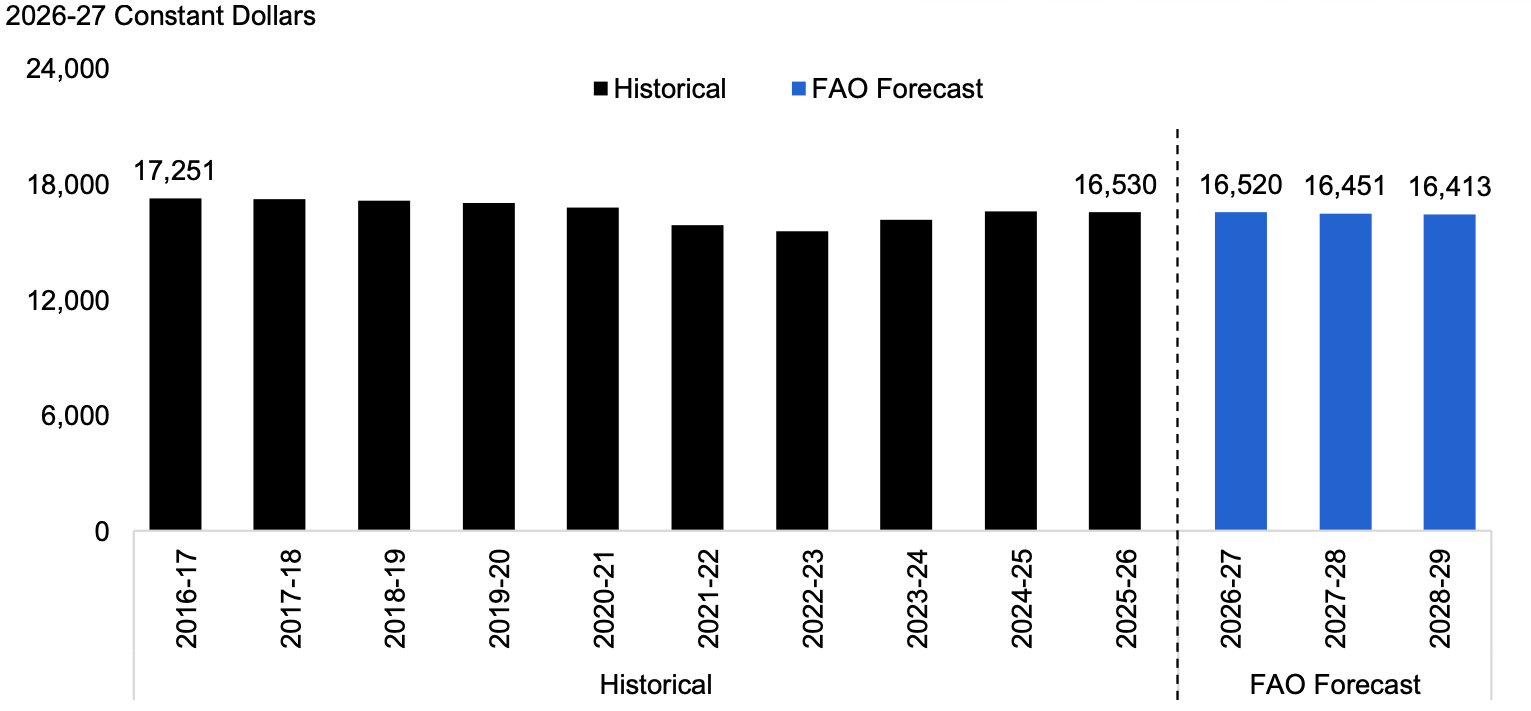
- On an inflation-adjusted basis (i.e., real 2026-27 dollars), the average annual ODSP allowance per case was $16,530 in 2025-26. Based on prescribed increases in allowances, the FAO projects that the average inflation-adjusted allowance will decrease to $16,413 in 2028-29.
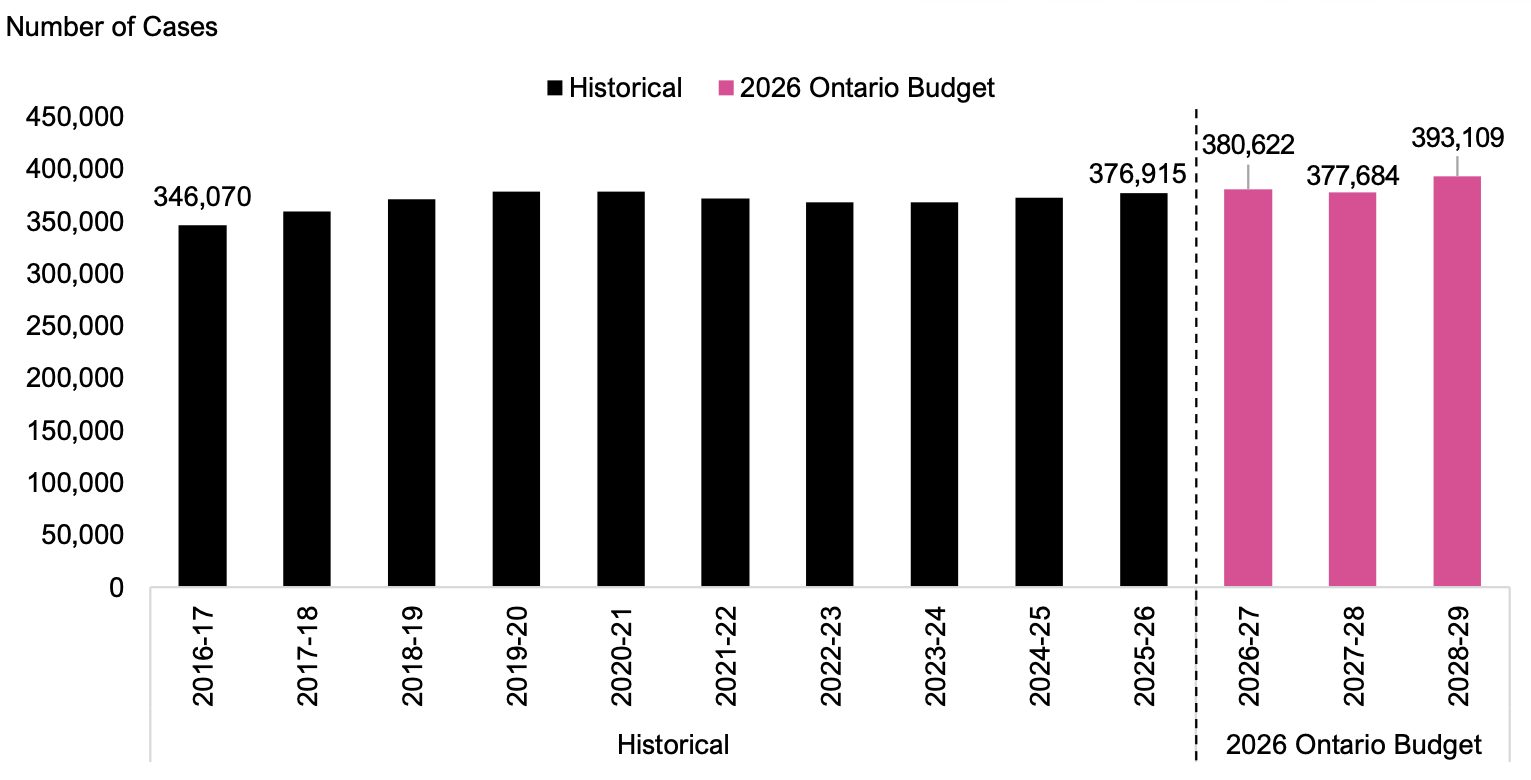
- In 2025-26, the average monthly number of ODSP cases was 376,915. Going forward, based on the MCCSS spending plan in the 2026 budget and FAO projected allowance rates, the FAO estimates a funded case capacity of 380,622 cases in 2026-27, 377,684 cases in 2027-28 and 393,109 cases in 2028-29.
- This represents an average annual caseload growth rate of 1.4 per cent, lower than the 2.2 per cent average annual caseload growth rate estimated by the FAO.
- As a result, the FAO estimates a funded caseload shortfall of 4,468 cases in 2026‑27, 16,365 cases in 2027-28 and 9,357 cases in 2028-29.
Ontario Works – Financial Assistance
- The Ontario Works (OW) – Financial Assistance program provides direct financial assistance to Ontarians facing barriers to employment.
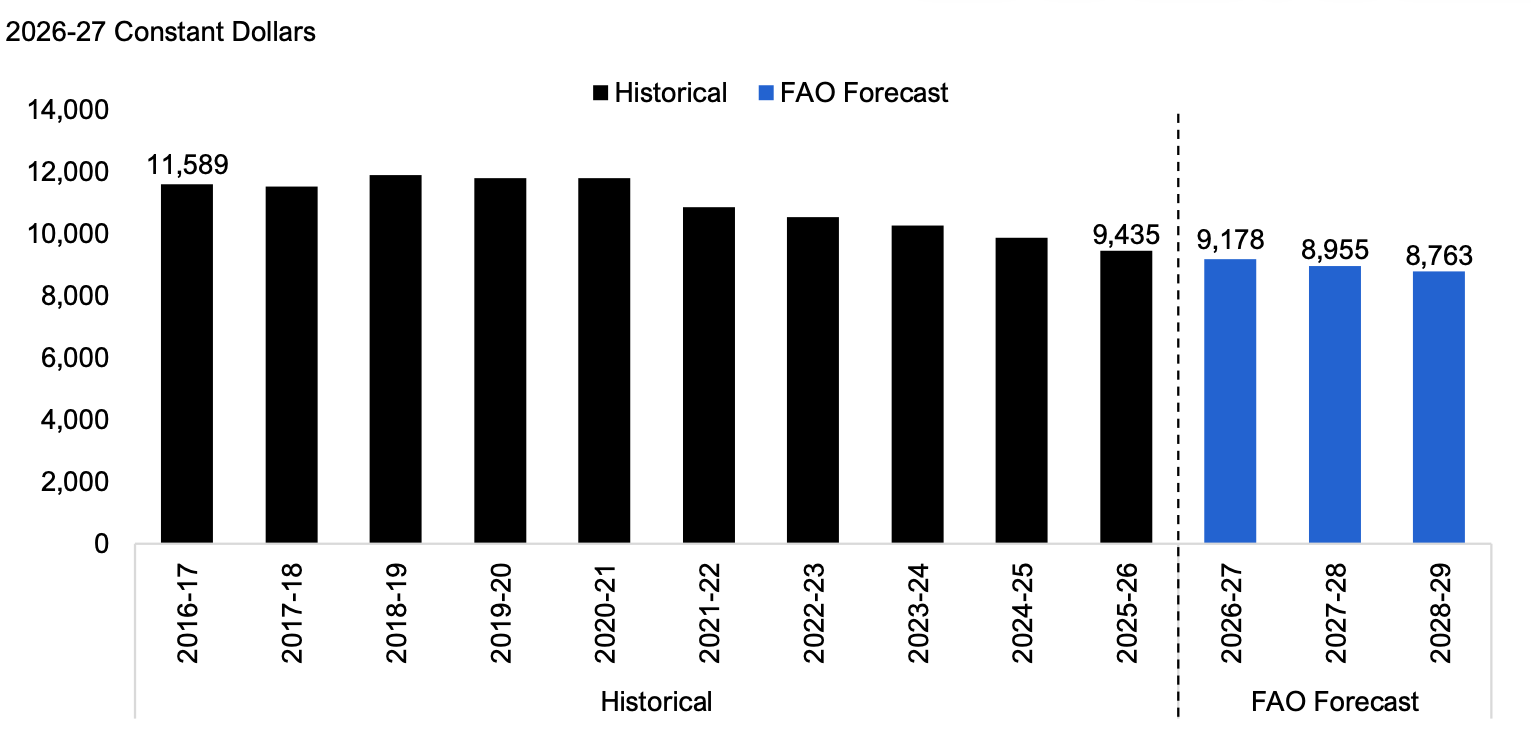
- On an inflation-adjusted basis, the average annual OW allowance per case was $9,435 in 2025-26. As OW rates are currently frozen, the FAO estimates that the average inflation-adjusted allowance will decline to $8,763 in 2028-29.
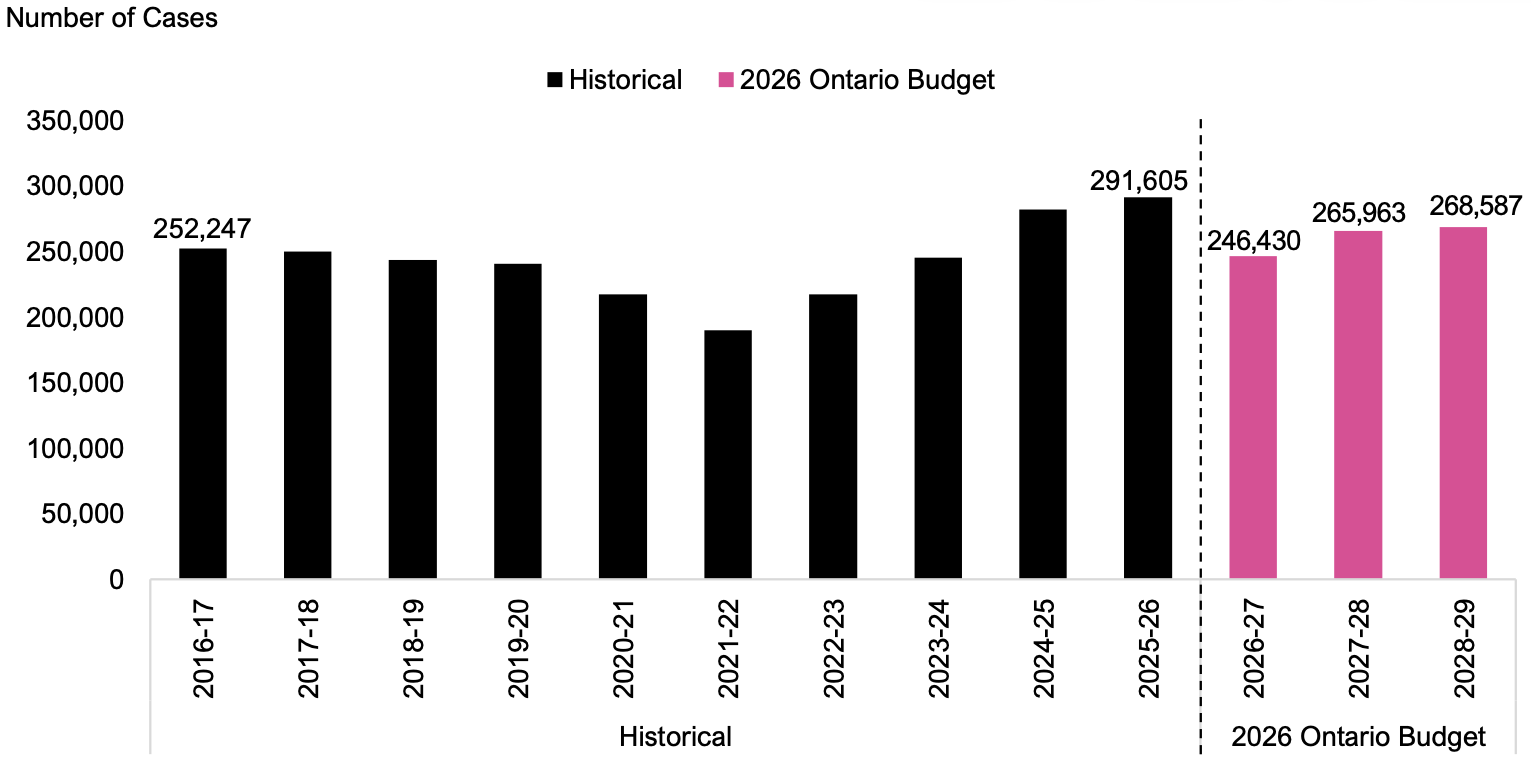
- In 2025-26, the average monthly number of Ontario Works cases was 291,605. Going forward, based on the MCCSS spending plan in the 2026 budget and FAO projected allowance rates, the FAO estimates a funded case capacity of 246,430 cases in 2026-27, 265,963 cases in 2027-28 and 268,587 cases in 2028-29.
- This represents an average annual caseload decline of 2.7 per cent, below the 1.3 per cent average annual caseload increase estimated by the FAO.
- As a result, the FAO estimates a funded caseload shortfall of 56,534 cases in 2026-27, 37,830 cases in 2027-28 and 34,196 cases in 2028-29.
Other MCCSS Spending
- MCCSS funds additional programs that provide targeted supports for adults, youth and children with disabilities; victims of violence; Indigenous peoples; children and youth at risk; youth in conflict with the law; and low-income families.
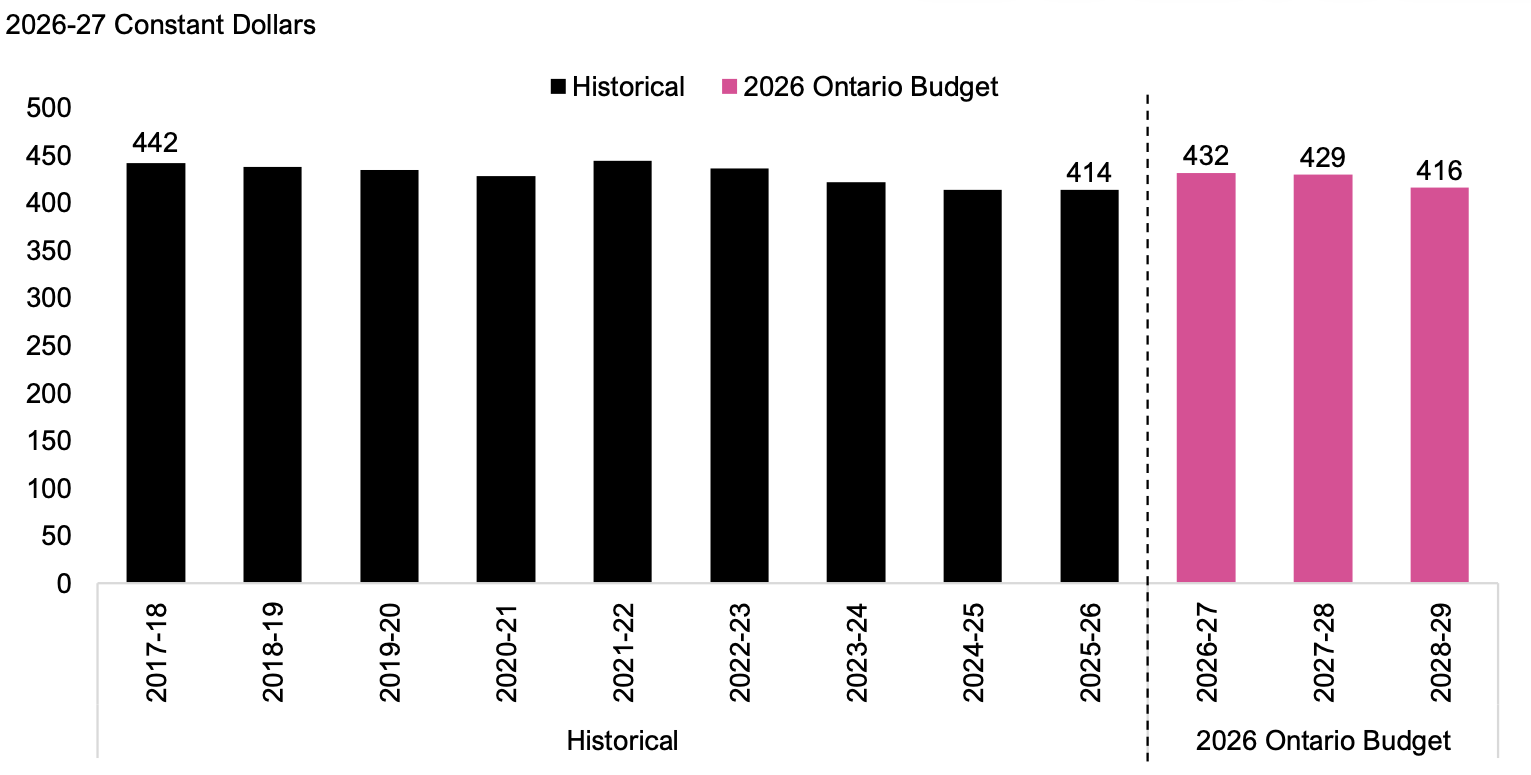
- In 2025-26, inflation-adjusted per-adult spending on MCCSS programs targeted to adults was $414. Based on the MCCSS spending plan in the 2026 budget, the FAO estimates that inflation-adjusted per‑adult spending will increase to $432 in 2026-27 and then decline to $429 in 2027-28 and $416 in 2028‑29.
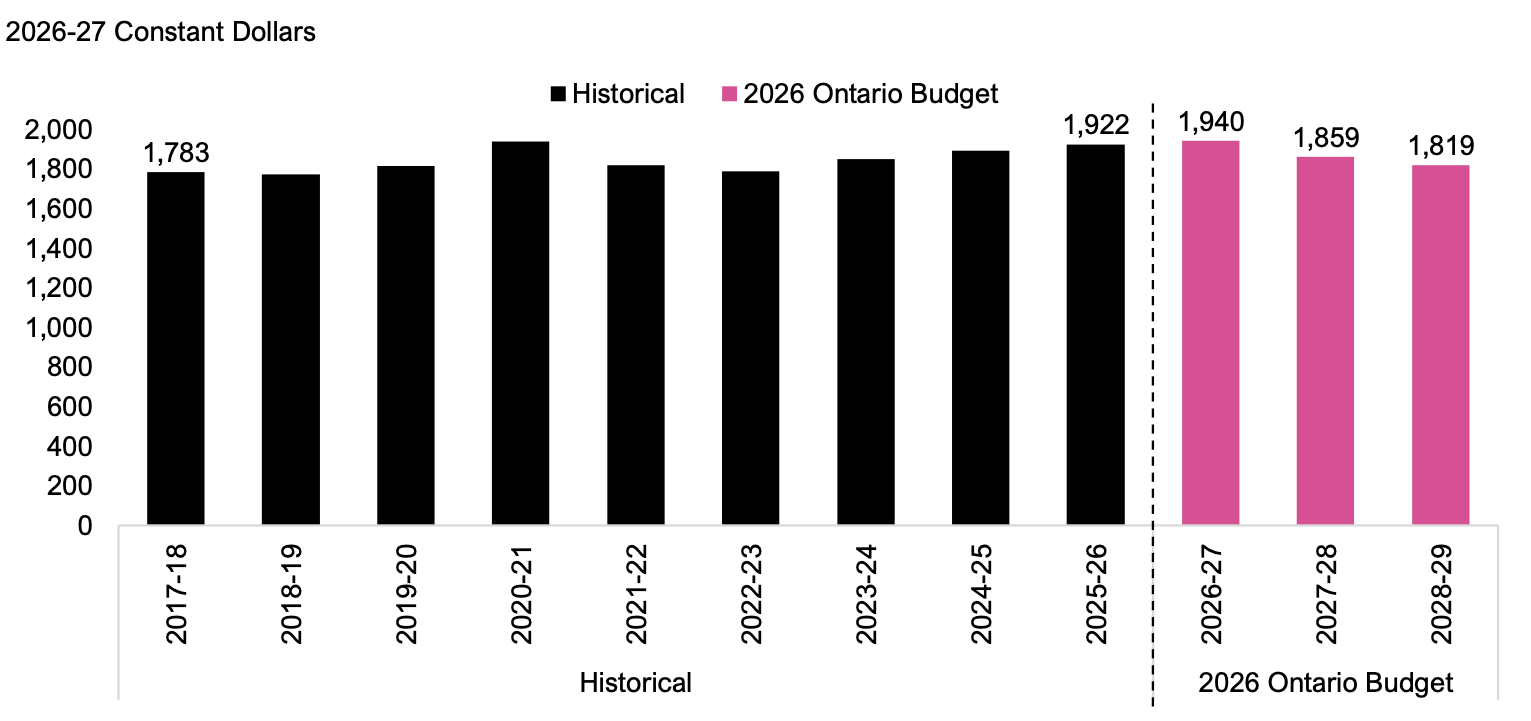
- In 2025-26, inflation-adjusted per-child/youth spending on MCCSS programs targeted to children and youth was $1,922. Based on the MCCSS spending plan in the 2026 budget, the FAO estimates that inflation-adjusted per-child/youth spending will increase to $1,940 in 2026-27 and then decline to $1,859 in 2027-28 and $1,819 in 2028-29.
Interprovincial Comparison
- In 2024, compared to the other provinces Ontario had:
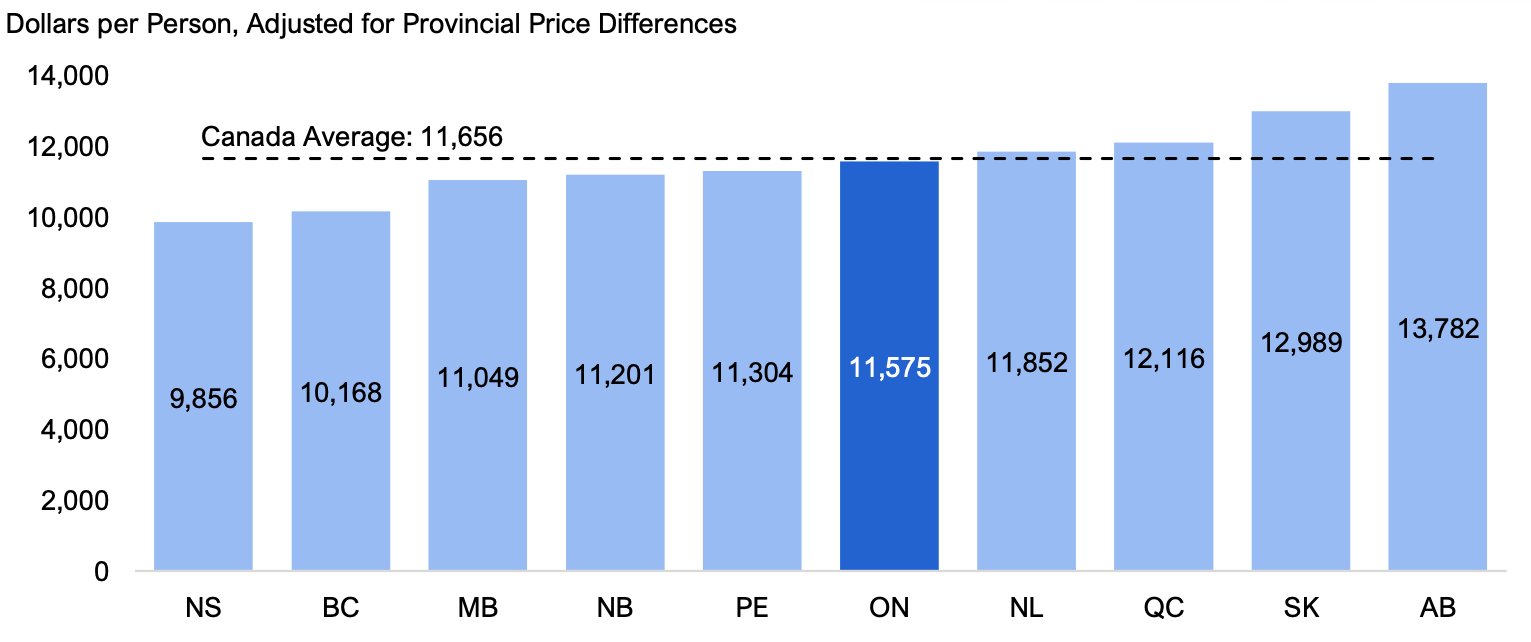
- The fifth highest average annual social assistance payments per recipient at $11,575, after adjusting for price differences across provinces, below the national average of $11,656 per recipient.
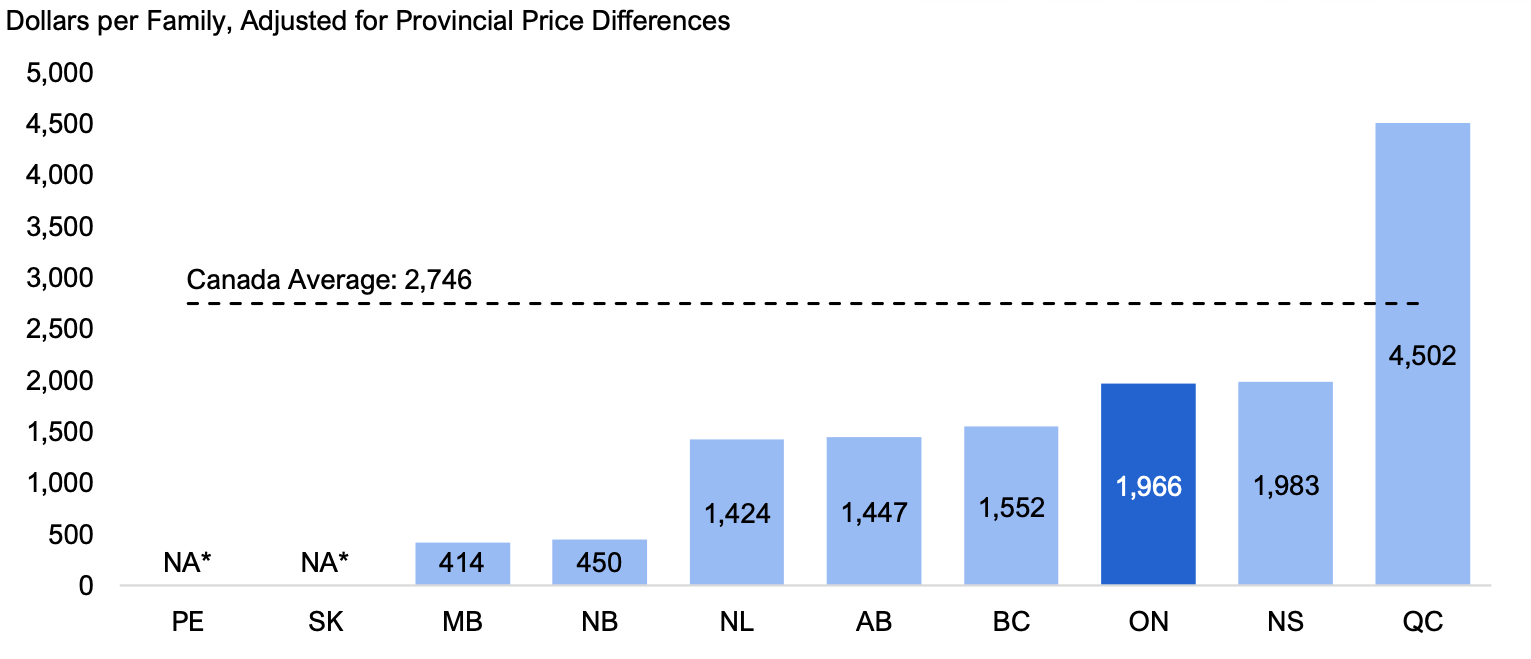
- Below average annual provincial child benefit payments per recipient family at $1,966, after adjusting for price differences across provinces, below the national average of $2,746 per recipient family.
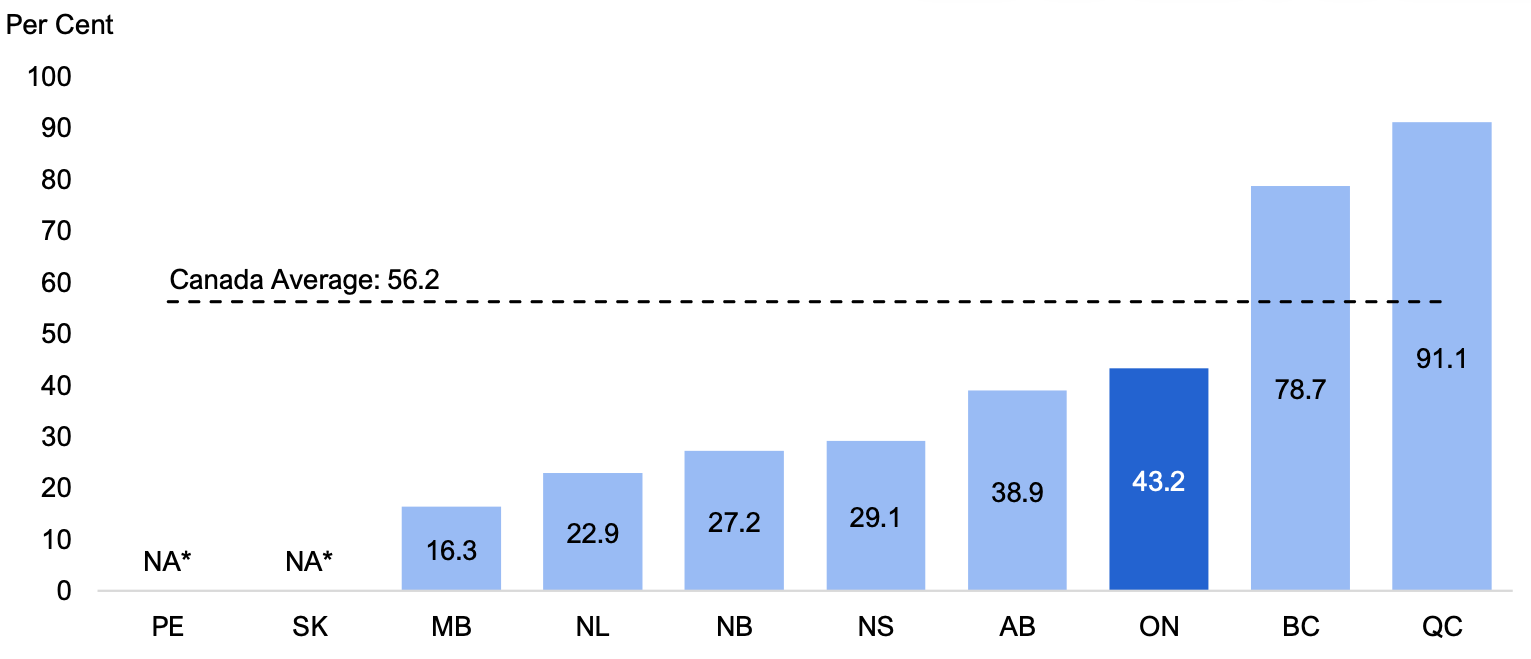
- A below average proportion of families with children under the age of 18 that received provincial child benefit payments at 43.2 per cent, below the national average of 56.2 per cent.
2. Introduction
This report reviews the Government of Ontario’s (the Province’s) Ministry of Children, Community and Social Services (MCCSS or ministry) spending plan as outlined in the 2026 Ontario Budget.
This analysis was undertaken in response to research requests from Members of Provincial Parliament and is part of a series that reviews the 2026 spending plans for five ministries: Children, Community and Social Services; Colleges, Universities, Research Excellence and Security; Education; Health; and Long-Term Care.
The report is organized as follows:
- Chapter 3 reviews the Province’s MCCSS spending plan in the 2026 Ontario Budget against historical MCCSS spending, the spending plan from the 2025 Ontario Budget, and estimated cost drivers. The cost driver analysis includes the FAO’s projection for MCCSS spending required to maintain current service levels.
- Chapter 4 estimates the impact of the Province’s MCCSS spending plan on select service levels.
- Chapter 5 provides an interprovincial comparison of spending on social assistance and child benefits.
For additional information on the Ministry of Children, Community and Social Services’ spending plan, see the FAO’s 2026-27 Expenditure Estimates Dashboard, which allows users to review the ministry’s 2026-27 Expenditure Estimates to the standard account level of detail and compare 2026-27 requested spending against spending between 2021-22 and 2025-26.
3. Spending Plan Overview
In the 2026 Ontario Budget, the Province projects that MCCSS spending will increase from $21.4 billion in 2025-26 to $21.7 billion in 2028-29, representing an average annual growth rate of 0.5 per cent. This is a significantly slower pace than the 5.7 per cent average annual growth over the previous three years from 2022-23 to 2025-26.
Figure 3.1 Ministry of Children, Community and Social Services spending plan in the 2026 Ontario Budget
Note: Historical values are not restated for program transfers or reclassifications, if any. 2025-26 historical value is an FAO estimate of unaudited spending and may contain differences from the final audited spending reported in the 2025-26 Public Accounts of Ontario.
Source: Ontario Public Accounts, the 2026 Ontario Budget and FAO analysis.
Accessible version
| 2022-23 to 2025-26 Historical | 2025-26 to 2028-29 2026 Ontario Budget |
|---|---|
| 5.7 | 0.5 |
| Historical | 2026 Ontario Budget | ||
|---|---|---|---|
| Historical | 2022-23 | 18.1 | |
| Historical | 2023-24 | 19.5 | |
| Historical | 2024-25 | 20.7 | |
| Historical | 2025-26 | 21.4 | |
| 2026 Budget Outlook | 2026-27 | 21.4 | |
| 2026 Budget Outlook | 2027-28 | 21.6 | |
| 2026 Budget Outlook | 2028-29 | 21.7 |
For context, over the 36-year period from 1990-91 to 2025-26, MCCSS spending grew at an average annual rate of 3.2 per cent.[1] The Province’s MCCSS spending plan in the 2026 budget calls for significantly slower spending growth compared to the 36-year average and if achieved, would be the slowest three-year growth rate since 1999-00 to 2002-03.
2026 Spending Plan Compared to 2025 Spending Plan
Compared to the MCCSS spending plan in the 2025 Ontario Budget, the MCCSS spending plan in the 2026 Ontario Budget has increased by a total of $3.3 billion from 2025-26 to 2027-28. This includes additional spending of $1.1 billion in 2025-26, $1.0 billion in 2026-27 and $1.2 billion in 2027-28.
Figure 3.2 Ministry of Children, Community and Social Services spending plan in the 2025 and 2026 Ontario Budgets
Note: Historical values are not restated for program transfers or reclassifications, if any. 2025-26 historical value is an FAO estimate of unaudited spending and may contain differences from the final audited spending reported in the 2025-26 Public Accounts of Ontario.
Source: Ontario Public Accounts, 2025 Ontario Budget, 2026 Ontario Budget and FAO analysis.
Accessible version
| Historical | 2026 Ontario Budget | 2025 Ontario Budget | |
|---|---|---|---|
| 2022-23 | 18.1 | ||
| 2023-24 | 19.5 | ||
| 2024-25 | 20.7 | ||
| 2025-26 | 21.4 | 20.4 | |
| 2026-27 | 21.4 | 20.4 | |
| 2027-28 | 21.6 | 20.4 | |
| 2028-29 | 21.7 |
Spending Plan Compared to Cost Drivers
At the request of the Members of Provincial Parliament, the FAO estimated MCCSS spending over the next three years that would be required to maintain 2025-26 service levels. Also known as a cost driver projection, this scenario does not recommend how spending should change but serves as a benchmark to show whether the 2026 budget’s MCCSS spending plan is likely to maintain, improve or reduce the quality and accessibility of ministry services.
Overall, the FAO estimates that MCCSS spending would need to grow by an average annual rate of 3.3 per cent over the next three years to maintain current ministry service levels. The components of the FAO’s cost driver projection vary by program area:[2]
- Ontario Disability Support Program (ODSP): The FAO estimates that ODSP spending would need to grow by an average annual rate of 4.4 per cent over the next three years to maintain service levels. This estimate is based on projected population growth, population aging (as ODSP utilization tends to increase with age but declines at age 65 when people are eligible for federal Old Age Security (OAS) payments), and inflation.
- Ontario Works (OW): The FAO estimates that OW spending would need to grow by an average annual rate of 2.8 per cent over the next three years to maintain service levels. This estimate is based on the FAO’s forecast for unemployment, which contributes to OW utilization, and inflation.
- Ontario Drug Benefit Program (ODBP): The FAO estimates that ODBP spending would need to grow by an average annual rate of 5.3 per cent over the next three years to maintain service levels. This estimate is based on the FAO’s forecast for ODSP and OW cases, which represent the majority of MCCSS-funded ODBP recipients, and drug price inflation.
- Ontario Child Benefit (OCB): The FAO estimates that OCB spending would need to grow by an average annual rate of 1.8 per cent over the next three years to maintain service levels. This estimate is based on the FAO’s forecast for the population of children aged zero to 17 years in Ontario and inflation.
- All other ministry programs: The FAO estimates that spending on all other ministry programs would need to grow by an average annual rate of 2.7 per cent over the next three years to maintain service levels. This estimate is based on population growth and inflation.
Figure 3.3 Comparing Ministry of Children, Community and Social Services spending growth, FAO cost driver projection vs. 2026 Ontario Budget, 2025-26 to 2028-29
Source: 2026 Ontario Budget and FAO analysis.
Accessible version
| FAO Cost Driver Projection | 2026 Ontario Budget |
|---|---|
| 3.3 | 0.5 |
As noted above, in the 2026 budget, the Province projects that MCCSS spending will increase at an average annual rate of 0.5 per cent from 2025-26 to 2028-29. Compared to the FAO’s cost driver projection, this results in a funding shortfall of $0.7 billion in 2026-27, $1.3 billion in 2027-28 and $1.9 billion in 2028-29.
Figure 3.4 Comparing Ministry of Children, Community and Social Services spending projections, FAO cost driver projection vs. 2026 Ontario Budget
Note: Historical values are not restated for program transfers or reclassifications, if any. 2025-26 historical value is an FAO estimate of unaudited spending and may contain differences from the final audited spending reported in the 2025-26 Public Accounts of Ontario.
Source: Ontario Public Accounts, 2026 Ontario Budget and FAO analysis.
Accessible version
| Historical | 2026 Ontario Budget | FAO Cost Driver Projection | ||
|---|---|---|---|---|
| Historical | 2022-23 | 18.1 | ||
| Historical | 2023-24 | 19.5 | ||
| Historical | 2024-25 | 20.7 | ||
| Historical | 2025-26 | 21.4 | ||
| Projection | 2026-27 | 21.4 | 22.2 | |
| Projection | 2027-28 | 21.6 | 22.9 | |
| Projection | 2028-29 | 21.7 | 23.6 |
The funding shortfall means that, to maintain current service levels, the Province will need to implement program efficiencies (i.e., provide the same level of services with less resources) and/or commit additional funding beyond what was planned in the 2026 Ontario Budget.
4. Spending Plan Analysis
At the request of the Members of Provincial Parliament, the FAO estimated the potential impact of the MCCSS spending plan in the 2026 budget on select service level indicators, including Ontario Disability Support Program and Ontario Works inflation-adjusted allowances and caseload capacity, and inflation-adjusted per‑person spending on other adult-focused and child/youth-focused ministry programs.
Ontario Disability Support Program – Financial Assistance
The Ontario Disability Support Program (ODSP) – Financial Assistance provides direct financial assistance to Ontarians with disabilities and their families. On an inflation-adjusted basis (i.e., real 2026-27 dollars), the FAO estimates that the average annual ODSP allowance per case was $16,530 in 2025-26.[3] The FAO projects that the average inflation-adjusted allowance will decrease to $16,413 in 2028-29, as components of the ODSP allowance are mandated to increase annually by the inflation observed in the 12-month period ending on September 30 of the previous year.[4]
Figure 4.1 Average annual Ontario Disability Support Program allowance, inflation-adjusted, 2016-17 to 2028-29
Note: The average annual ODSP allowance per case excludes payments for Assistance for Children with Severe Disabilities.
Source: Ontario Public Accounts, 2026 Ontario Budget and FAO analysis.
Accessible version
| Historical | FAO Forecast | ||
|---|---|---|---|
| Historical | 2016-17 | 17,251 | |
| Historical | 2017-18 | 17,196 | |
| Historical | 2018-19 | 17,123 | |
| Historical | 2019-20 | 17,019 | |
| Historical | 2020-21 | 16,772 | |
| Historical | 2021-22 | 15,878 | |
| Historical | 2022-23 | 15,527 | |
| Historical | 2023-24 | 16,137 | |
| Historical | 2024-25 | 16,560 | |
| Historical | 2025-26 | 16,530 | |
| FAO Forecast | 2026-27 | 16,520 | |
| FAO Forecast | 2027-28 | 16,451 | |
| FAO Forecast | 2028-29 | 16,413 |
In 2025-26, the average monthly number of ODSP cases was 376,915.[5] Going forward, based on the MCCSS spending plan in the 2026 budget and FAO projected allowance rates, the FAO estimates that there is a funded case capacity of 380,622 cases in 2026-27, 377,684 cases in 2027-28 and 393,109 cases in 2028‑29. This represents an average annual caseload growth rate of 1.4 per cent, lower than the 2.2 per cent average annual caseload growth rate estimated by the FAO. As a result, the FAO estimates a funded caseload shortfall of 4,468 cases in 2026-27, 16,365 cases in 2027-28 and 9,357 cases in 2028-29.
Figure 4.2 ODSP historical cases and funded ODSP case capacity in the 2026 Ontario Budget
Note: One case refers to a single individual or family unit on ODSP. Excludes Assistance for Children with Severe Disabilities cases.
Source: Government of Ontario Open Data: Social Assistance and Caseload Statistics, 2026 Ontario Budget and FAO analysis of information provided by the Province.
Accessible version
| Historical | 2026 Ontario Budget | ||
|---|---|---|---|
| Historical | 2016-17 | 346,070 | |
| Historical | 2017-18 | 359,330 | |
| Historical | 2018-19 | 370,674 | |
| Historical | 2019-20 | 378,441 | |
| Historical | 2020-21 | 378,145 | |
| Historical | 2021-22 | 371,462 | |
| Historical | 2022-23 | 367,828 | |
| Historical | 2023-24 | 368,052 | |
| Historical | 2024-25 | 372,681 | |
| Historical | 2025-26 | 376,915 | |
| 2026 Ontario Budget | 2026-27 | 380,622 | |
| 2026 Ontario Budget | 2027-28 | 377,684 | |
| 2026 Ontario Budget | 2028-29 | 393,109 |
Ontario Works – Financial Assistance
The Ontario Works (OW) – Financial Assistance program provides direct financial assistance to Ontarians facing barriers to employment. On an inflation-adjusted basis, the average annual OW allowance per case was $9,435 in 2025-26.[6] As OW allowance rates are currently frozen, the FAO estimates that the average inflation‑adjusted OW allowance will decline to $8,763 in 2028-29.
Figure 4.3 Average annual Ontario Works allowance, inflation-adjusted, 2016-17 to 2028-29
Note: The average annual OW allowance per case excludes payments for Temporary Care Assistance.
Source: Ontario Public Accounts, 2026 Ontario Budget and FAO analysis.
Accessible version
| Historical | FAO Forecast | ||
|---|---|---|---|
| Historical | 2016-17 | 11,589 | |
| Historical | 2017-18 | 11,498 | |
| Historical | 2018-19 | 11,882 | |
| Historical | 2019-20 | 11,768 | |
| Historical | 2020-21 | 11,775 | |
| Historical | 2021-22 | 10,841 | |
| Historical | 2022-23 | 10,527 | |
| Historical | 2023-24 | 10,242 | |
| Historical | 2024-25 | 9,853 | |
| Historical | 2025-26 | 9,435 | |
| FAO Forecast | 2026-27 | 9,178 | |
| FAO Forecast | 2027-28 | 8,955 | |
| FAO Forecast | 2028-29 | 8,763 |
In 2025-26, the average monthly number of Ontario Works cases was 291,605.[7] Going forward, based on the MCCSS spending plan in the 2026 budget and FAO projected allowance rates, the FAO estimates that there is a funded case capacity of 246,430 cases in 2026-27, 265,963 cases in 2027-28 and 268,587 cases in 2028-29. This represents an average annual caseload decline of 2.7 per cent, below the 1.3 per cent average annual caseload increase estimated by the FAO. As a result, the FAO estimates a funded caseload shortfall of 56,534 cases in 2026-27, 37,830 cases in 2027-28 and 34,196 cases in 2028‑29.
Figure 4.4 Historical OW cases and funded OW case capacity in the 2026 Ontario Budget
Note: One case refers to a single individual or family unit on OW. Excludes Temporary Care Assistance cases.
Source: Government of Ontario Open Data: Social Assistance and Caseload Statistics, 2026 Ontario Budget and FAO analysis of information provided by the Province.
Accessible version
| Historical | 2026 Ontario Budget | ||
|---|---|---|---|
| Historical | 2016-17 | 252,247 | |
| Historical | 2017-18 | 250,292 | |
| Historical | 2018-19 | 243,875 | |
| Historical | 2019-20 | 240,545 | |
| Historical | 2020-21 | 217,234 | |
| Historical | 2021-22 | 189,981 | |
| Historical | 2022-23 | 217,639 | |
| Historical | 2023-24 | 245,246 | |
| Historical | 2024-25 | 282,011 | |
| Historical | 2025-26 | 291,605 | |
| 2026 Ontario Budget | 2026-27 | 246,430 | |
| 2026 Ontario Budget | 2027-28 | 265,963 | |
| 2026 Ontario Budget | 2028-29 | 268,587 |
Other MCCSS Program Spending
MCCSS funds additional programs that provide targeted supports for adults, youth and children with disabilities; victims of violence; Indigenous peoples; children and youth at risk; youth in conflict with the law; and low-income families. The following analyzes planned spending in the 2026 budget per Ontarian aged 18 or over (adult) for programs targeted to adults and per Ontarian aged 17 or under (child/youth) for programs targeted to children and youth.
MCCSS programs targeted to adults include the Developmental Services Supportive Living Program, the Supportive Services Program, the Ontario Drug Benefit Program and Supports to Victims of Violence. In 2025‑26, inflation-adjusted per-adult spending on MCCSS programs targeted to adults was $414. Based on the MCCSS spending plan in the 2026 budget, the FAO estimates that inflation-adjusted per-adult spending will increase to $432 in 2026-27, and then decline to $429 in 2027-28 and $416 in 2028-29.
Figure 4.5 Ministry of Children, Community and Social Services per-adult spending on other adult programs, inflation-adjusted, 2017-18 to 2028-29
Note: Other adult programs include the Developmental Services Supportive Living Program, the Supportive Services Program, the Ontario Drug Benefit Program and Supports to Victims of Violence.
Source: Ontario Public Accounts, 2026 Ontario Budget and FAO analysis.
Accessible version
| Historical | 2026 Ontario Budget | ||
|---|---|---|---|
| Historical | 2017-18 | 442 | |
| Historical | 2018-19 | 438 | |
| Historical | 2019-20 | 435 | |
| Historical | 2020-21 | 428 | |
| Historical | 2021-22 | 444 | |
| Historical | 2022-23 | 436 | |
| Historical | 2023-24 | 421 | |
| Historical | 2024-25 | 414 | |
| Historical | 2025-26 | 414 | |
| 2026 Ontario Budget | 2026-27 | 432 | |
| 2026 Ontario Budget | 2027-28 | 429 | |
| 2026 Ontario Budget | 2028-29 | 416 |
MCCSS programs targeted to children and youth include Child Protective Services, the Ontario Child Benefit, the Autism Program, Youth Justice Services and Children’s Treatment and Rehabilitation Services. In 2025-26, inflation‑adjusted per-child/youth spending on MCCSS programs targeted to children and youth was $1,922. Based on the MCCSS spending plan in the 2026 budget, the FAO estimates that inflation-adjusted per-child/youth spending will increase to $1,940 in 2026-27, and then decline to $1,859 in 2027-28 and $1,819 in 2028-29.
Figure 4.6 Ministry of Children, Community and Social Services per-child/youth spending on child/youth programs, inflation-adjusted, 2017-18 to 2028-29
Note: Child and youth targeted programs include Child Protective Services, the Ontario Child Benefit, the Autism Program, Youth Justice Services and Children’s Treatment and Rehabilitation Services.
Source: Ontario Public Accounts, 2026 Ontario Budget and FAO analysis.
Accessible version
| Historical | 2026 Ontario Budget | ||
|---|---|---|---|
| Historical | 2017-18 | 1,783 | |
| Historical | 2018-19 | 1,773 | |
| Historical | 2019-20 | 1,815 | |
| Historical | 2020-21 | 1,939 | |
| Historical | 2021-22 | 1,818 | |
| Historical | 2022-23 | 1,787 | |
| Historical | 2023-24 | 1,847 | |
| Historical | 2024-25 | 1,889 | |
| Historical | 2025-26 | 1,922 | |
| 2026 Ontario Budget | 2026-27 | 1,940 | |
| 2026 Ontario Budget | 2027-28 | 1,859 | |
| 2026 Ontario Budget | 2028-29 | 1,819 |
5. Interprovincial Comparison
At the request of the Members of Provincial Parliament, this chapter compares Ontario’s social assistance and child benefit payments with the other provinces. The information is for the 2024 calendar year, the latest year with comparable data.
Social Assistance Payments
Social assistance refers to direct payments provided by provincial governments to eligible recipients, which in Ontario includes Ontario Works and the Ontario Disability Support Program. In 2024, Ontario ranked fifth highest in average annual social assistance payments per recipient[8] at $11,575, after adjusting for price differences across provinces.[9] Ontario’s average annual social assistance payments per recipient were $82 lower than the Canadian average of $11,656. Compared to other large provinces, Ontario’s average annual social assistance payments per recipient were lower than in Alberta ($13,782) and Quebec ($12,116) but higher than in British Columbia ($10,168).
Figure 5.1 Average annual social assistance payments per recipient by province, adjusted for provincial price differences, 2024
Note: Social assistance payments are adjusted for provincial differences in prices, using purchasing power parity indices, to provide a comparison of the purchasing power of social assistance payments (i.e., the amount of shelter, food, clothing and other goods/services that each province’s social assistance benefits could purchase). Canada average excludes territories.
Source: Statistics Canada Canadian Income Survey (2024), Purchasing Power Parities for Consumption and Household Income Across the Canadian Provinces and Territories, and FAO.
Accessible version
| Province | Dollars per Person, Adjusted for Provincial Price Differences |
|---|---|
| NS | 9,856 |
| BC | 10,168 |
| MB | 11,049 |
| NB | 11,201 |
| PE | 11,304 |
| ON | 11,575 |
| NL | 11,852 |
| QC | 12,116 |
| SK | 12,989 |
| AB | 13,782 |
| Canada Average | 11,656 |
Provincial Child Benefit Payments
Child benefit payments are provided by provincial governments to eligible families to help with the cost of raising children. In Ontario, payments are provided under the Ontario Child Benefit.[10] In 2024, Ontario’s average annual child benefit payments per recipient family[11] were $1,966, after adjusting for price differences across provinces.[12] Ontario’s average annual child benefit payments per recipient family were $780 lower than the Canadian average of $2,746. Compared to other large provinces, Ontario’s average annual child benefit payments per recipient family were higher than in Alberta ($1,447) and British Columbia ($1,552) but lower than in Quebec ($4,502).
Figure 5.2 Average annual provincial child benefit payments per recipient family by province, adjusted for provincial price differences, 2024
* Comparative data not available.
Note: A recipient family represents a parent or caregiver aged 15 and over who reported receiving child benefit payments in Statistics Canada’s Canadian Income Survey. One family may have multiple children who qualify for child benefit payments. Child benefit payments are adjusted for provincial differences in prices, using purchasing power parity indices, to provide a comparison of the purchasing power of child benefit payments (i.e., the amount of shelter, food, clothing and other goods/services that each province’s child benefit payments could purchase). Canada average excludes PEI, Saskatchewan and all territories.
Source: Statistics Canada Canadian Income Survey (2024), Purchasing Power Parities for Consumption and Household Income Across the Canadian Provinces and Territories and FAO.
Accessible version
| Province | Dollars per Family, Adjusted for Provincial Price Differences |
|---|---|
| PE | NA* |
| SK | NA* |
| MB | 414 |
| NB | 450 |
| NL | 1,424 |
| AB | 1,447 |
| BC | 1,552 |
| ON | 1,966 |
| NS | 1,983 |
| QC | 4,502 |
| Canada Average | 2,746 |
Provincial Child Benefit Recipient Share
In 2024, Ontario’s proportion of families with children under the age of 18 that received provincial child benefit payments was 43.2 per cent. This was 12.9 percentage points below the Canadian average of 56.2 per cent. This was also below British Columbia (78.7 per cent) and Quebec (91.1 per cent) but above Alberta (38.9 per cent).
Figure 5.3 Share of families with children under the age of 18 that received provincial child benefit payments by province, 2024
* Comparative data not available.
Note: Canada average excludes PEI, Saskatchewan and all territories.
Source: Statistics Canada Canadian Income Survey (2024), Table 39-10-0041-01: Census families with children by age of children and children by age groups and FAO.
Accessible version
| Province | Per Cent |
|---|---|
| PE | NA* |
| SK | NA* |
| MB | 16.3 |
| NL | 22.9 |
| NB | 27.2 |
| NS | 29.1 |
| AB | 38.9 |
| ON | 43.2 |
| BC | 78.7 |
| QC | 91.1 |
| Canada Average | 56.2 |
Footnotes
[1] FAO, Government Spending Trends: 1990 to 2023 and FAO calculations.
[2] For more information on MCCSS program areas, see FAO, Ministry of Children, Community and Social Services: Spending Plan Review.
[3] The average annual ODSP allowance per case excludes payments for Assistance for Children with Severe Disabilities.
[4] Ontario Regulation 2/23 made under the Ontario Disability Support Program Act, 1997.
[5] One case refers to a single individual or family unit on ODSP. Excludes Assistance for Children with Severe Disabilities cases.
[6] The average annual OW allowance per case excludes payments for Temporary Care Assistance.
[7] One case refers to a single individual or family unit on OW. Excludes Temporary Care Assistance cases.
[8] A recipient is an individual aged 15 and over who reported receiving social assistance income in Statistics Canada’s Canadian Income Survey.
[9] The FAO adjusted social assistance payments for provincial differences in prices, using purchasing power parity indices, to provide a comparison of the purchasing power of social assistance payments (i.e., the amount of shelter, food, clothing and other goods/services that each province’s social assistance benefits could purchase). Purchasing power parity indices are from Statistics Canada, Purchasing Power Parities for Consumption and Household Income Across the Canadian Provinces and Territories.
[10] Child benefits do not include subsidized child care or other in-kind supports.
[11] A recipient family represents a parent or caregiver aged 15 and over who reported receiving child benefit payments in Statistics Canada’s Canadian Income Survey. One family may have multiple children who qualify for child benefit payments.
[12] The FAO adjusted child benefit payments for provincial differences in prices, using purchasing power parity indices, to provide a comparison of the purchasing power of child benefit payments (i.e., the amount of shelter, food, clothing and other goods/services that each province’s child benefit payments could purchase). Purchasing power parity indices are from Statistics Canada, Purchasing Power Parities for Consumption and Household Income Across the Canadian Provinces and Territories.