


In August, Statistics Canada released international merchandise trade data for June 2016, marking the half-way point for the year and providing a clearer picture of how Ontario’s export performance is shaping up in 2016.[1] Ontario’s international trade performance is particularly important since most economic forecasters expect exports to be a primary driver of Ontario’s economic growth this year, benefiting from the lower Canadian dollar and solid U.S. growth.[2]
In current (or nominal) dollars, Ontario exports have grown strongly so far in 2016, rising to $103.3 billion over the first six months of the year, a 10% increase compared to the same period in 2015, led by the automotive and consumer goods sectors. As a result, it might appear that exports are providing a key support for Ontario economic growth in 2016.
However, as noted in a previous FAO Commentary,[3] some of the recent gains in nominal exports reflect the lower value of the Canadian dollar over the first six months of 2016, which depreciated 5.3% relative to the U.S. dollar, compared to a year earlier. Since Canadian exports destined for the U.S. are often priced in U.S. dollars, a lower exchange rate results in Ontario exporters receiving more Canadian dollars for the same volume of exports. The FAO has developed estimates of Ontario’s real international merchandise exports, which adjust for changes in export prices, including exchange rate movements, and provide a better indicator of the actual economic activity related to exports.[4]
Ontario Real International Merchandise Exports Post Sharp Decline in 2016 Q2
Source: Statistics Canada and FAO.
Accessible version
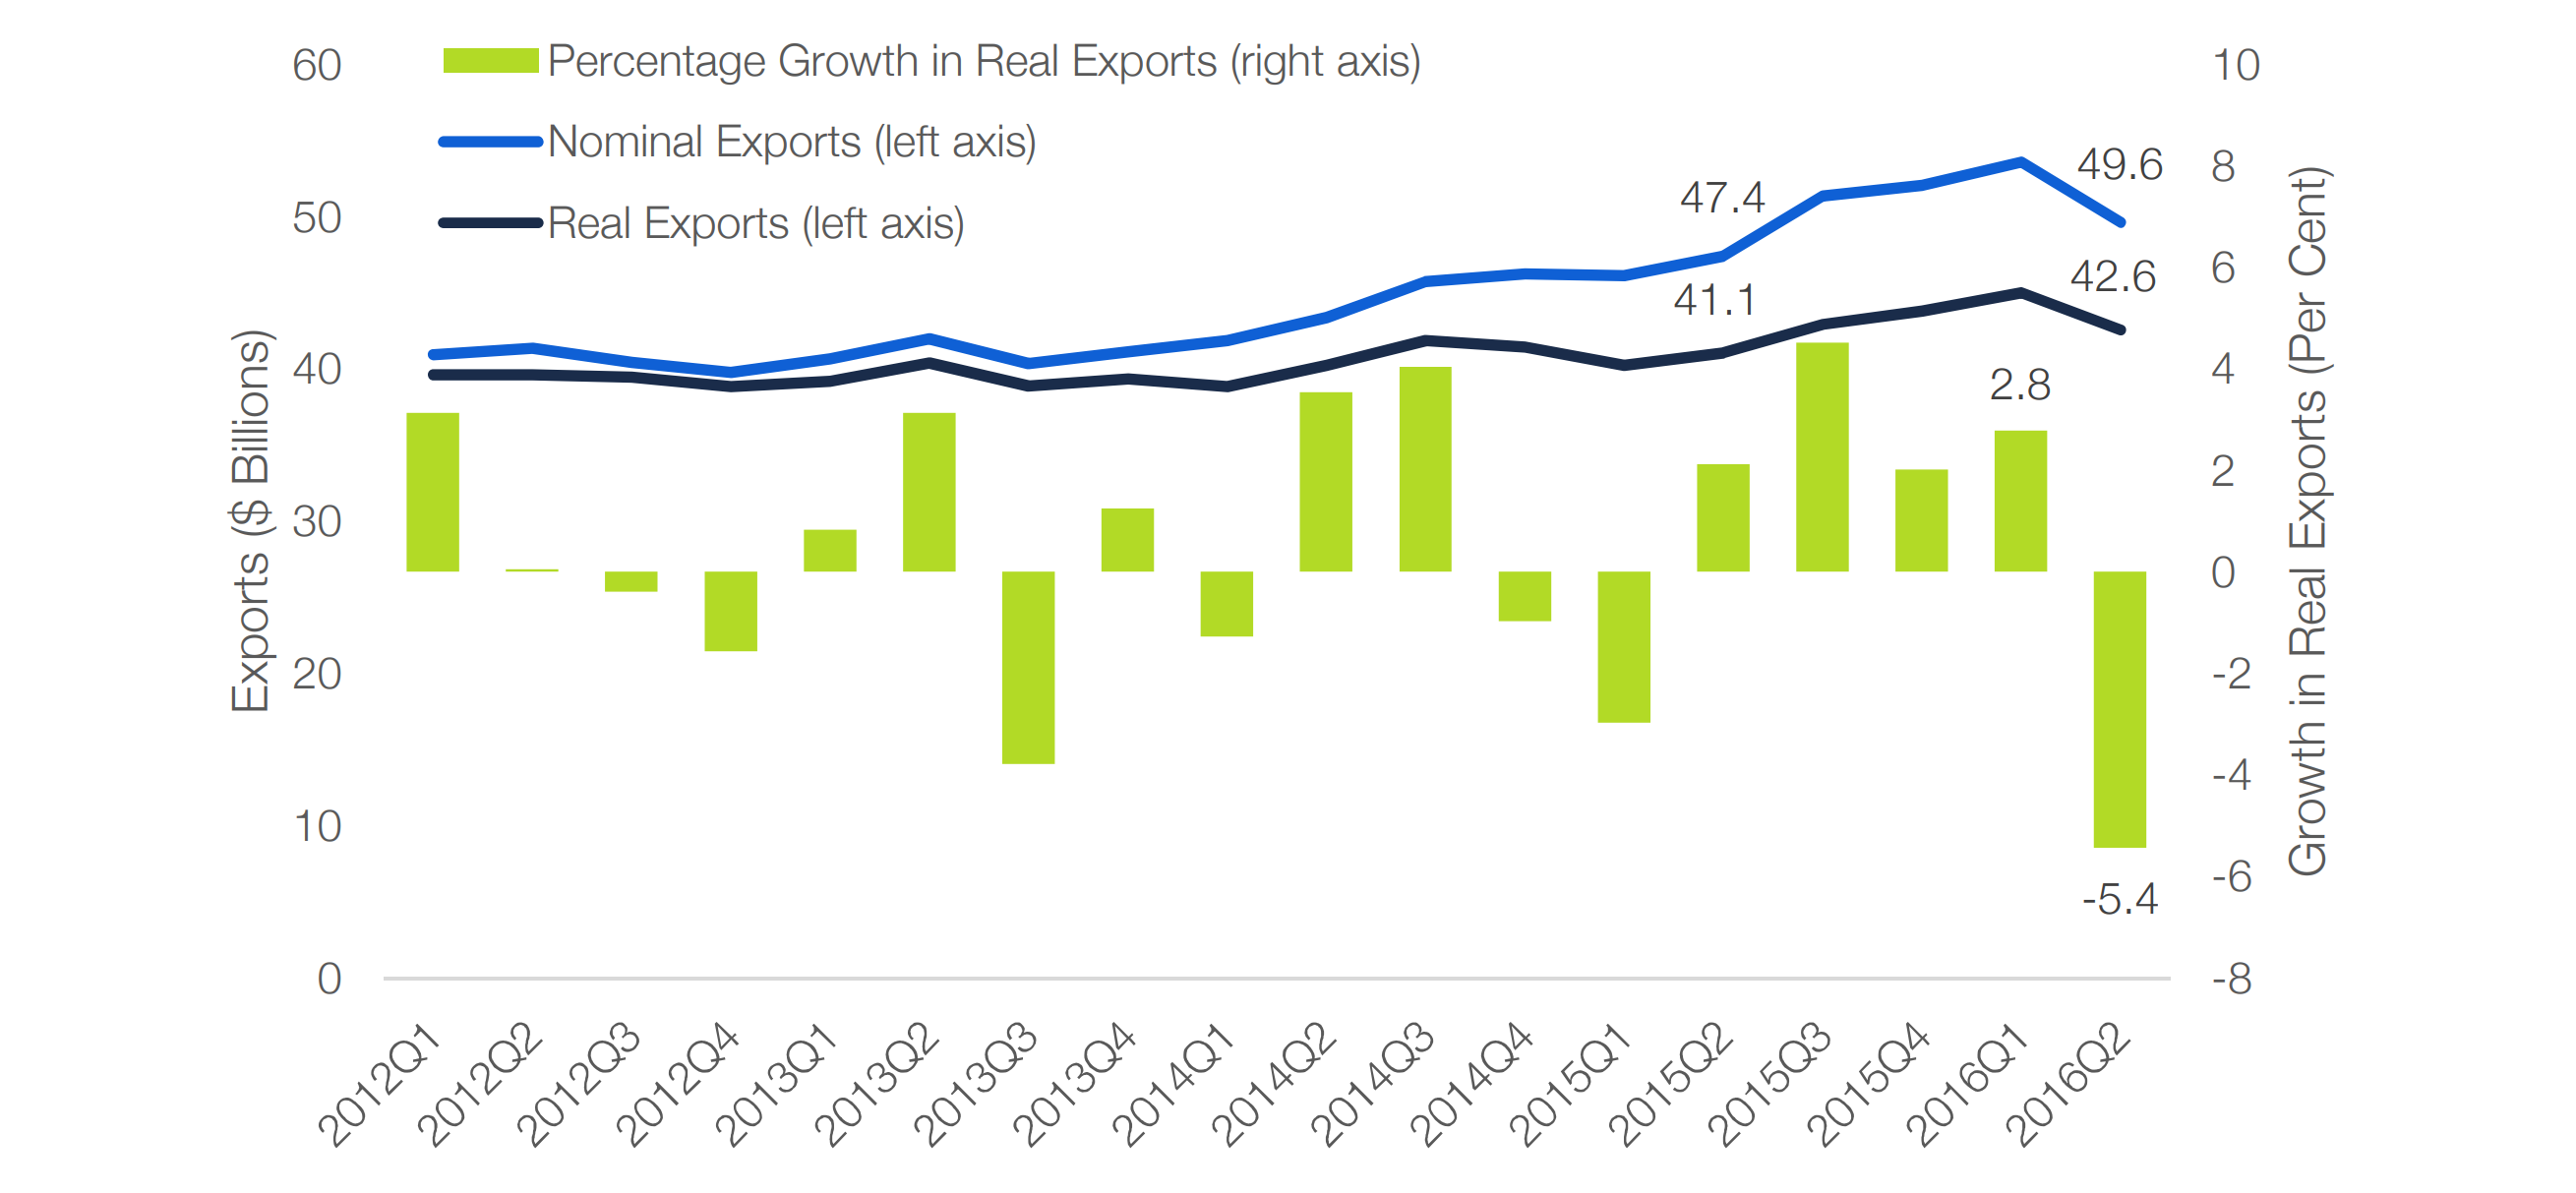
This chart shows a comparison between nominal exports and real exports. From Q2 2015 to Q2 2016 nominal exports have grown from 47.4 billion to 49.6 billion. During the same period real exports have grown from 41.1 to 42.6 billion. This chart also shows the quarter-to-quarter growth rates of real exports. In Q1 of 2016 real exports grew 2.8%, while in Q2 of 2016 they fell by 5.4%.
While Ontario’s real merchandise exports remain 3.6% above their level a year ago, the increase was largely a result of strong growth over the second half of 2015. On a quarter-to-quarter basis, real exports declined 5.4% in Q2, the largest quarterly drop since the 2008-2009 recession. In fact, Ontario real exports declined in four of the first six months of 2016.
The relative weakness over the first half of 2016 suggests that Ontario exports are not responding as strongly as hoped, given the favourable economic conditions provided by the lower dollar and a growing U.S. economy.
Auto Exports Higher in 2016 — But Relatively Flat Since 2012
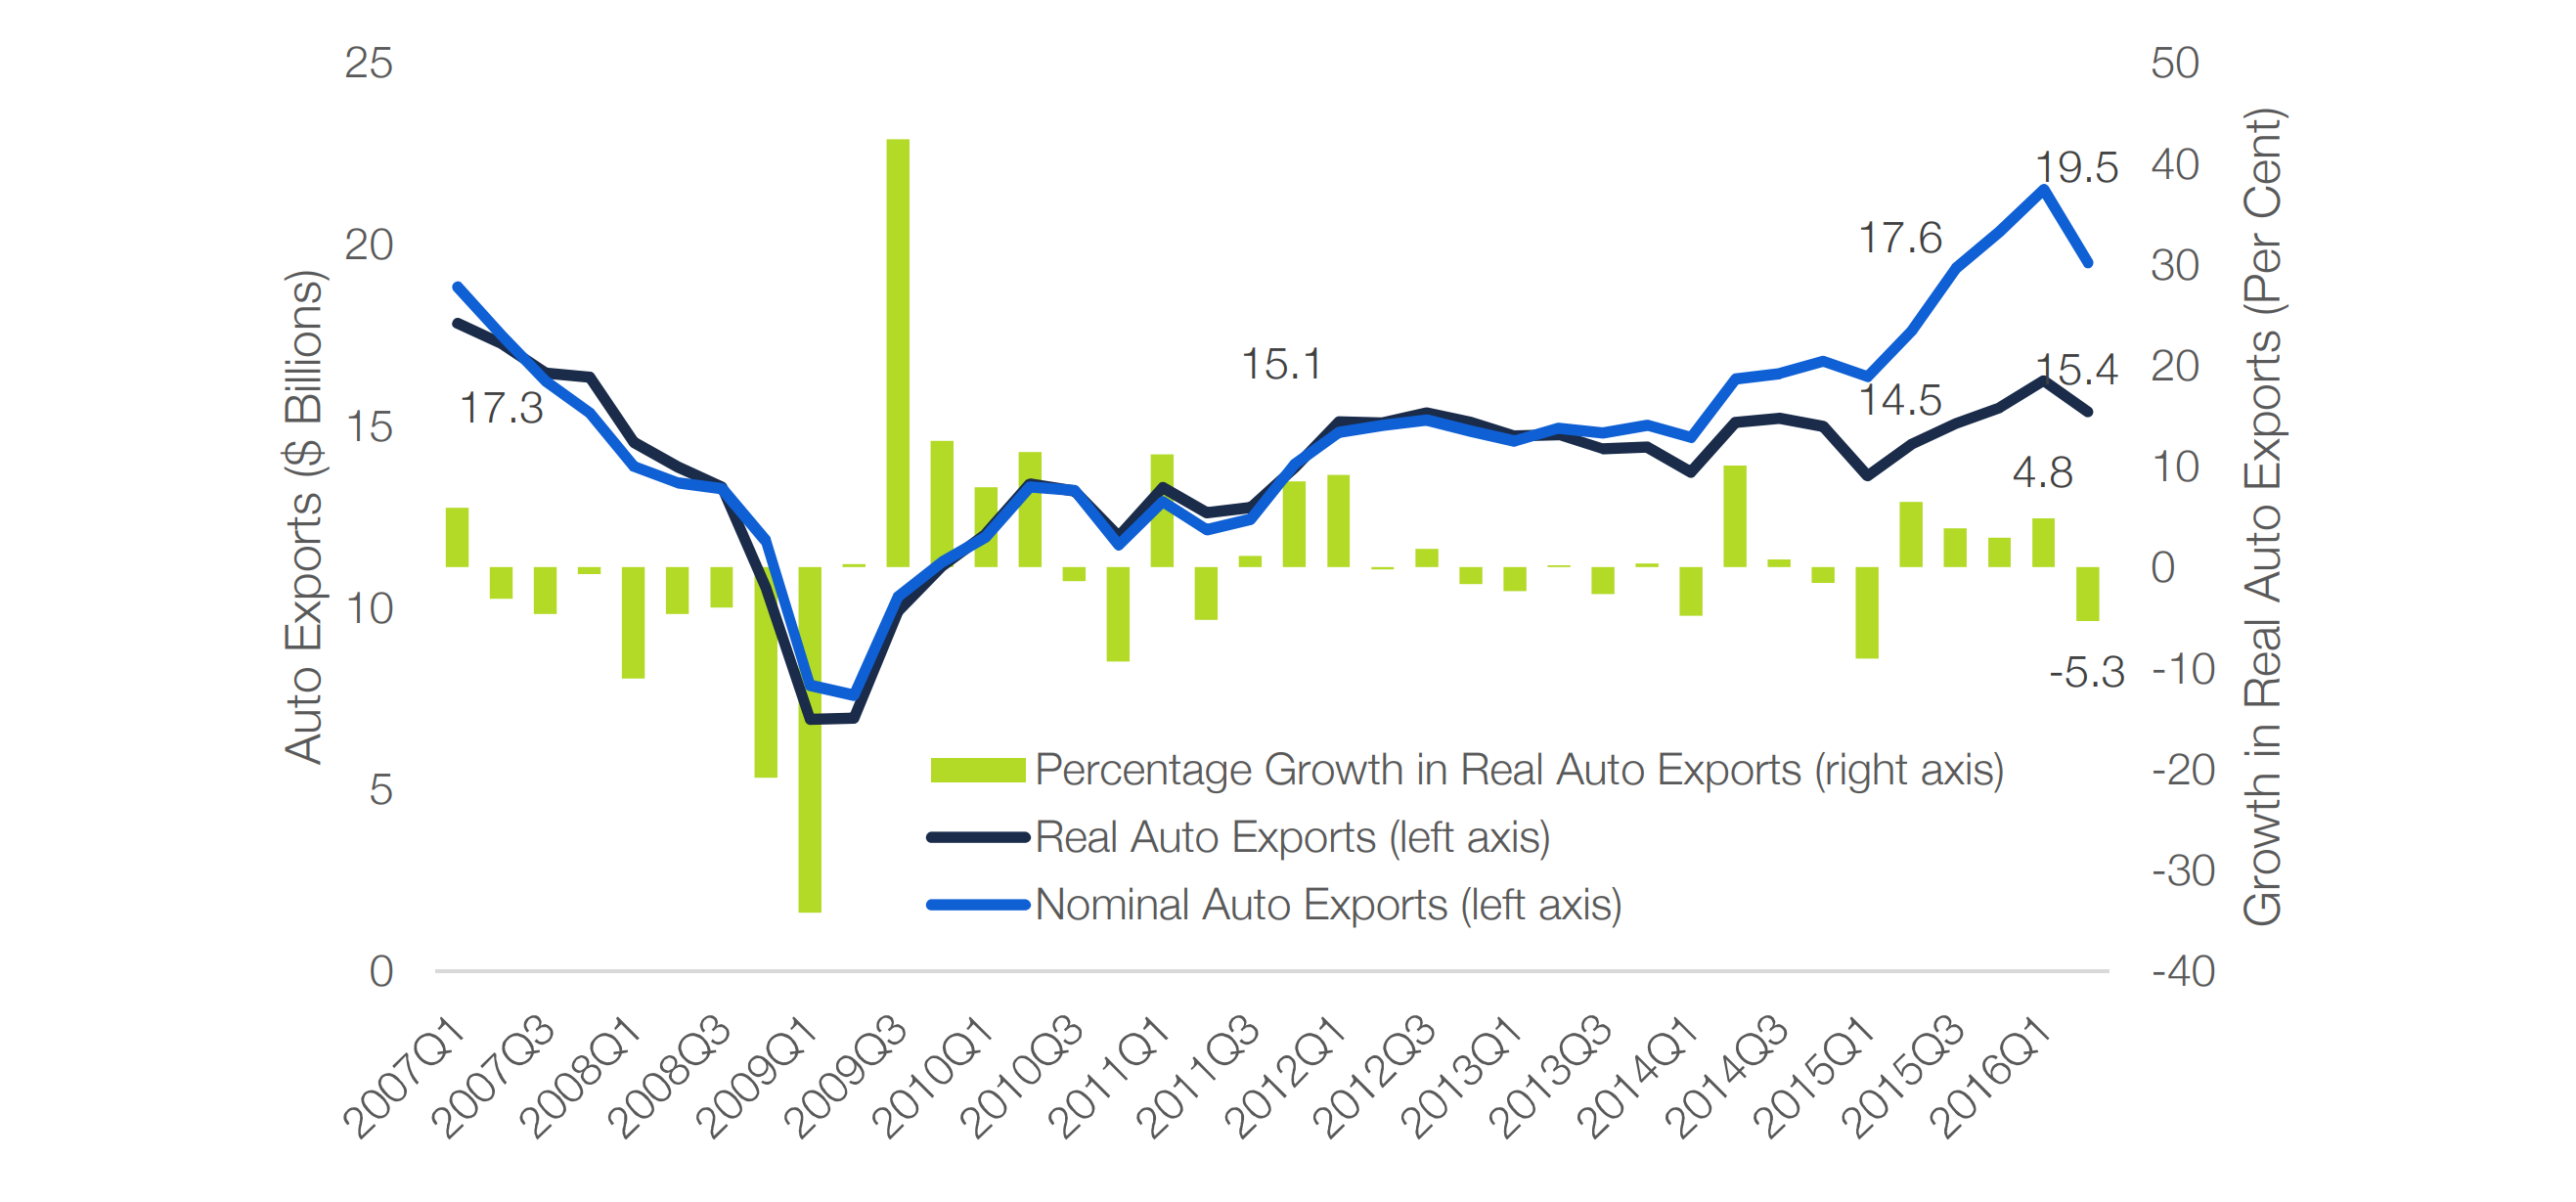
Auto sector exports continue to be Ontario’s largest single export category, accounting for over 37% of total merchandise exports last year.[5] On year-over-year basis, real auto exports were 6.1% higher in the second quarter of 2016, once again largely the result of strong growth over the second half of 2015. On a quarterly basis, a solid gain of 4.8% in the first quarter of 2016, was more than reversed by a 5.3% decline in Q2.
Stepping back from the recent quarter-to-quarter swings, the longer-term trend for the auto sector has been very sluggish with real exports increasing by only 2% in total over the past four years. Significantly, real auto exports remain almost 11% below their value in the second quarter of 2007, prior to the global recession. The extent to which Ontario’s auto exports continue to recover will depend crucially on new investment, since the sector is operating close to capacity.[6] However, according to Statistics Canada, investment in the sector is expected to decline in 2016.[7]
Real Auto Exports Remain Well Below Pre-Recession Levels
Source: Statistics Canada and FAO.
Accessible version
This chart shows a comparison between nominal auto exports and real auto exports. Nominal auto exports have increased from 17.6 billion in Q2 of 2015 to 19.5 billion in Q2 of 2016. During the same period real auto exports have grown from 14.5 billion to 15.4 billion. The chart shows that since Q1 of 2015 real exports have only increased from 15.1 billion to 15.4 in Q2 of 2016 and have not yet recovered to pre-recession levels of 17.3 billion in Q2 of 2007. The chart also shows quarter-to-quarter growth in real auto exports. Real auto exports grew 4.8% in Q1 of 2016 and fell 5.3% in Q2 of 2016.
| Total | Farm and Fishing Products | Energy | Metal Ores and Non-Metallic Minerals | Metal and Non-Metallic Mineral Products | Chemical, Plastic and Rubber Products | |||||||
|---|---|---|---|---|---|---|---|---|---|---|---|---|
| Value | % Change | Value | % Change | Value | % Change | Value | % Change | Value | % Change | Value | % Change | |
| 2015:Q1 | 40,224 | -3.0 | 881 | -5.1 | 627 | 49.0 | 258 | -5.5 | 8,395 | -4.9 | 3,002 | 1.5 |
| Q2 | 41,075 | 2.1 | 915 | 3.8 | 619 | -1.3 | 228 | -11.7 | 8,207 | -2.2 | 2,983 | -0.6 |
| Q3 | 42,931 | 4.5 | 1,031 | 12.7 | 494 | -20.3 | 273 | 19.7 | 7,927 | -3.4 | 3,032 | 1.6 |
| Q4 | 43,796 | 2.0 | 1,035 | 0.5 | 609 | 23.5 | 316 | 15.8 | 8,441 | 6.5 | 3,212 | 5.9 |
| 2016:Q1 | 45,013 | 2.8 | 883 | -14.7 | 623 | 2.2 | 314 | -0.5 | 8,471 | 0.4 | 3,251 | 1.2 |
| Q2 | 42,568 | -5.4 | 967 | 9.6 | 425 | -31.8 | 279 | -11.2 | 8,366 | -1.2 | 2,962 | -8.9 |
| 2012 | 157,576 | 6.1 | 2,833 | 16.0 | 1,739 | 25.1 | 705 | -3.8 | 31,194 | 0.9 | 11,216 | -7.1 |
| 2013 | 157,821 | 0.2 | 3,393 | 19.8 | 1,560 | -10.3 | 833 | 18.2 | 32,946 | 5.6 | 11,991 | 6.9 |
| 2014 | 162,421 | 2.9 | 3,533 | 4.1 | 1,721 | 10.4 | 973 | 16.7 | 33,902 | 2.9 | 11,268 | -6.0 |
| 2015 | 168,026 | 3.5 | 3,862 | 9.3 | 2,349 | 36.5 | 1,074 | 10.4 | 32,971 | -2.7 | 12,229 | 8.5 |
| Forestry Products and Building Materials | Industrial Machinery and Equipment | Electronic and Electrical Equipment | Automotive | Aircraft and Other Transport Equipment | Consumer Goods | |||||||
| Value | % Change | Value | % Change | Value | % Change | Value | % Change | Value | % Change | Value | % Change | |
| 2015:Q1 | 1,537 | 1.3 | 2,910 | 6.2 | 2,109 | -0.3 | 13,631 | -9.0 | 896 | 9.1 | 5,413 | -1.2 |
| Q2 | 1,595 | 3.8 | 2,924 | 0.5 | 2,150 | 1.9 | 14,510 | 6.4 | 782 | -12.8 | 5,606 | 3.6 |
| Q3 | 1,669 | 4.6 | 3,079 | 5.3 | 2,226 | 3.5 | 15,065 | 3.8 | 934 | 19.5 | 6,646 | 18.5 |
| Q4 | 1,765 | 5.7 | 3,079 | 0.0 | 2,182 | -2.0 | 15,508 | 2.9 | 840 | -10.1 | 6,049 | -9.0 |
| 2016:Q1 | 1,774 | 0.5 | 2,943 | -4.4 | 2,224 | 1.9 | 16,254 | 4.8 | 866 | 3.0 | 6,696 | 10.7 |
| Q2 | 1,725 | -2.7 | 3,052 | 3.7 | 2,169 | -2.5 | 15,389 | -5.3 | 894 | 3.3 | 5,752 | -14.1 |
| 2012 | 5,692 | -4.7 | 10,157 | 4.0 | 8,578 | -4.7 | 60,652 | 15.4 | 4,381 | 23.2 | 19,072 | 1.9 |
| 2013 | 5,509 | -3.2 | 10,141 | -0.2 | 8,104 | -5.5 | 58,293 | -3.9 | 3,445 | -21.4 | 20,105 | 5.4 |
| 2014 | 5,899 | 7.1 | 10,480 | 3.3 | 8,056 | -0.6 | 59,037 | 1.3 | 3,678 | 6.8 | 21,982 | 9.3 |
| 2015 | 6,566 | 11.3 | 11,993 | 14.4 | 8,666 | 7.6 | 58,714 | -0.5 | 3,453 | -6.1 | 23,713 | 7.9 |
Footnotes
[1] International merchandise exports accounted for approximately 54% of Ontario’s total exports in 2015, the remainder of which was made up of international service exports (12%) and interprovincial exports (34%).
[2] The United States accounted for approximately 80% of Ontario’s international merchandise exports in 2015.
[3] See FAO’s February 2016 commentary: Ontario Export Performance Disappoints in 2015.
[4] The FAO’s estimates of real exports are based on seasonally adjusting Statistics Canada’s customs-based trade data and then applying Canada-level price indices to each trade category to remove the effects of price inflation (including the effects of exchange rate movements).
[5] Based on nominal export data.
[6] Based on Statistics Canada’s estimates of capacity utilization, the Canadian Transportation Equipment sector (which includes motor vehicle and parts manufacturing) was operating at 94.8% of its capacity in the first quarter of 2016, a record high.
[7] Based on Statistics Canada’s survey of public and private investment, investment in the Ontario Transportation Equipment sector is expected to decline sharply in 2016, following a strong increase in 2015. Investment in the sector remains well below levels before the 2008-2009 recession.