


Summary
This report provides a review of Ontario’s labour market performance in 2025. It presents a summary of the overall labour market in the province, and information for demographic groups, industries, occupations, major cities, other provinces and wage growth compared to inflation.
Ontario’s labour market continued to moderate in 2025
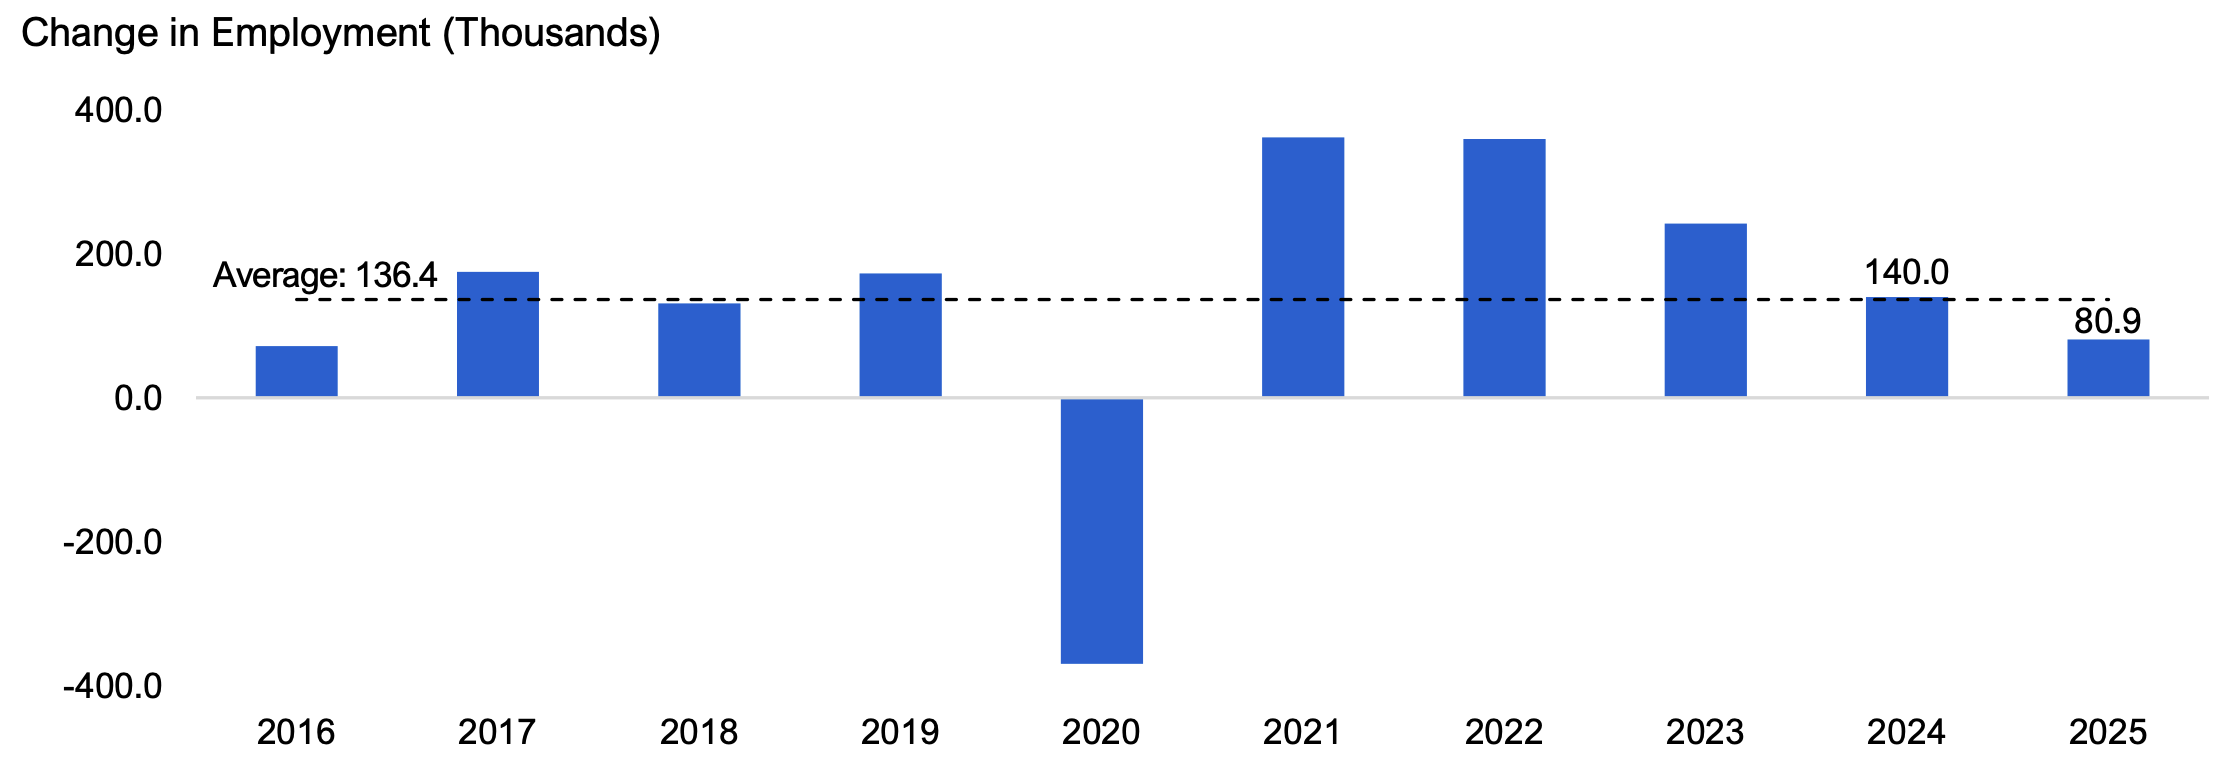
- The pace of Ontario’s job creation continued to slow in 2025, with employment rising by 80,900 (1.0 per cent), down from 140,000 jobs (1.7 per cent) added in 2024 and the slowest pace of job creation since 2015 excluding the pandemic.
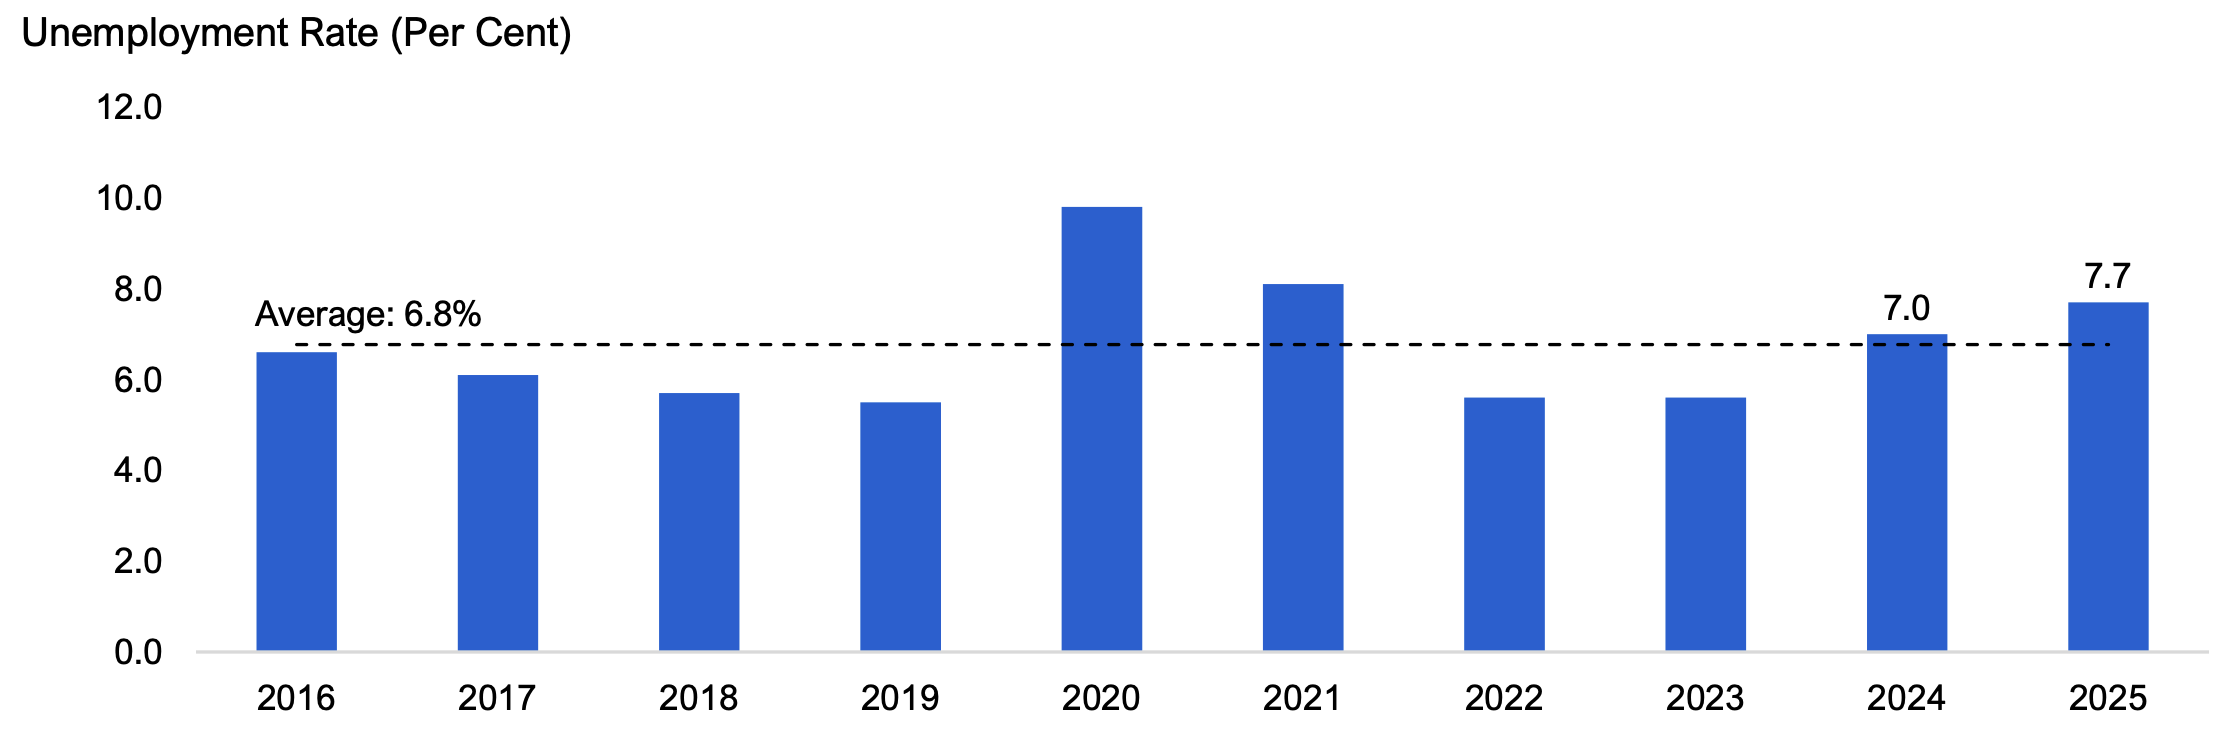
- Job creation did not keep pace with the increase in the number of people looking for work, causing Ontario’s unemployment rate to increase to 7.7 per cent in 2025, up from 7.0 per cent in 2024 and the highest since 2012 excluding the pandemic.
Most groups of workers saw job gains
- In 2025, core-aged workers (aged 25-54) and youth (aged 15-24) experienced job gains of 1.0 per cent and 2.5 per cent, respectively. Employment among older workers (aged 55 years and over) was little changed, with job losses[1] for older workers concentrated among men.
- Employment grew across all major job categories except for public sector workers (-0.1 per cent). The slowdown in public sector employment in 2025 followed four consecutive years of strong gains and partly reflected the downsizing of the federal public-sector workforce and lower international student enrolment, which affected employment in the public administration and education sectors.
- Employment in full-time positions (0.6 per cent) grew at a slower pace than part-time positions (2.8 per cent), which is generally characteristic of periods of slow economic growth. Employment growth in temporary positions (7.0 per cent) outpaced that in permanent jobs (0.4 per cent).
- Of the 16 major industries in Ontario, eight saw an increase in employment, with most of the gains in industries that pay below-average wages. Job losses were recorded in industries highly affected by tariffs, including manufacturing (-8,400), agriculture (-6,400) and transportation and warehousing (‑3,700).
Job vacancies continued to trend lower in 2025
- Job vacancies declined by 11.1 per cent in 2025, and the overall job vacancy rate[2] fell from 2.9 per cent in 2024 to 2.6 per cent in 2025.
- Job vacancies declined in all industries in 2025. Of the 16 major industries in Ontario, health care and social assistance had the highest number of job vacancies (36,500) for the fourth year in a row and the highest job vacancy rate (4.0 per cent).
Unemployment rate increased in all but one Census Metropolitan Area and in most provinces
- The unemployment rate increased in all Ontario Census Metropolitan Areas (CMAs) except St. Catharines-Niagara, and employment increased in 12 out of the 15 CMAs in Ontario. Peterborough had the fastest pace of job creation (6.0 per cent) and Guelph experienced the sharpest decline in employment (-5.3 per cent).
- Nine out of 10 provinces experienced job gains in 2025, and the unemployment rate increased in eight provinces. Ontario’s employment growth (1.0 per cent) was the third slowest among all provinces. Ontario recorded the third highest unemployment rate (7.7 per cent) and largest increase in the unemployment rate in the country for the second consecutive year.
Wage growth in Ontario outpaced inflation in 2025 for most groups of workers
- The average hourly wage of Ontarians increased 3.5 per cent to $37.72 in 2025, faster than the 1.9 per cent annual consumer price index (CPI) inflation rate. Average wage growth was above the annual inflation rate for all major groups of workers, in 12 out of 16 industry groups and for 28 out of 34 occupations.
Ontario’s labour market continued to moderate in 2025
The pace of Ontario’s job creation continued to slow in 2025, with employment rising by 80,900 (1.0 per cent), down from 140,000 jobs (1.7 per cent) added in 2024 and the slowest pace of job creation since 2015 excluding the pandemic. Job gains in 2025 were concentrated among core-aged workers and youth, in eight out of 16 major industries and in 12 out of the province’s 15 major cities.
Figure 1 Ontario’s job creation slowed to 80,900 in 2025
Source: Statistics Canada: Labour Force Survey: Table 14-10-0327-01
Accessible version
| Year | Change in Employment (Thousands) |
|---|---|
| 2016 | 71.8 |
| 2017 | 174.7 |
| 2018 | 131.2 |
| 2019 | 172.5 |
| 2020 | -369.5 |
| 2021 | 361.4 |
| 2022 | 359.3 |
| 2023 | 242.0 |
| 2024 | 140.0 |
| 2025 | 80.9 |
| Average | 136.4 |
Job creation did not keep pace with the increase in the number of people looking for work, causing Ontario’s unemployment rate[3] to increase to 7.7 per cent in 2025, up from 7.0 per cent in 2024 and the highest since 2012 excluding the pandemic.
Figure 2 Unemployment rate in Ontario increased to 7.7 per cent in 2025
Source: Statistics Canada: Labour Force Survey: Table 14-10-0327-01.
Accessible version
| Year | Unemployment Rate (Per Cent) |
|---|---|
| 2016 | 6.6 |
| 2017 | 6.1 |
| 2018 | 5.7 |
| 2019 | 5.5 |
| 2020 | 9.8 |
| 2021 | 8.1 |
| 2022 | 5.6 |
| 2023 | 5.6 |
| 2024 | 7.0 |
| 2025 | 7.7 |
| Average | 6.8 |
Ontario’s labour force participation rate[4] declined modestly from 65.3 per cent in 2024 to 65.0 per cent in 2025 as labour force[5] growth (1.8 per cent) trailed the increase in Ontario’s population aged 15 years and older (2.1 per cent). Ontario’s employment rate[6] also declined from 60.7 per cent in 2024 to 60.0 per cent in 2025, the lowest since 1996 excluding the pandemic, as employment growth (1.0 per cent) was less than half the pace of growth in Ontario’s population aged 15 years and older (2.1 per cent). The employment rate has generally trended lower since the mid-2000s, reflecting in part ongoing retirements as the province’s population has aged.
Figure 3 Ontario’s labour force participation rate declined in 2025
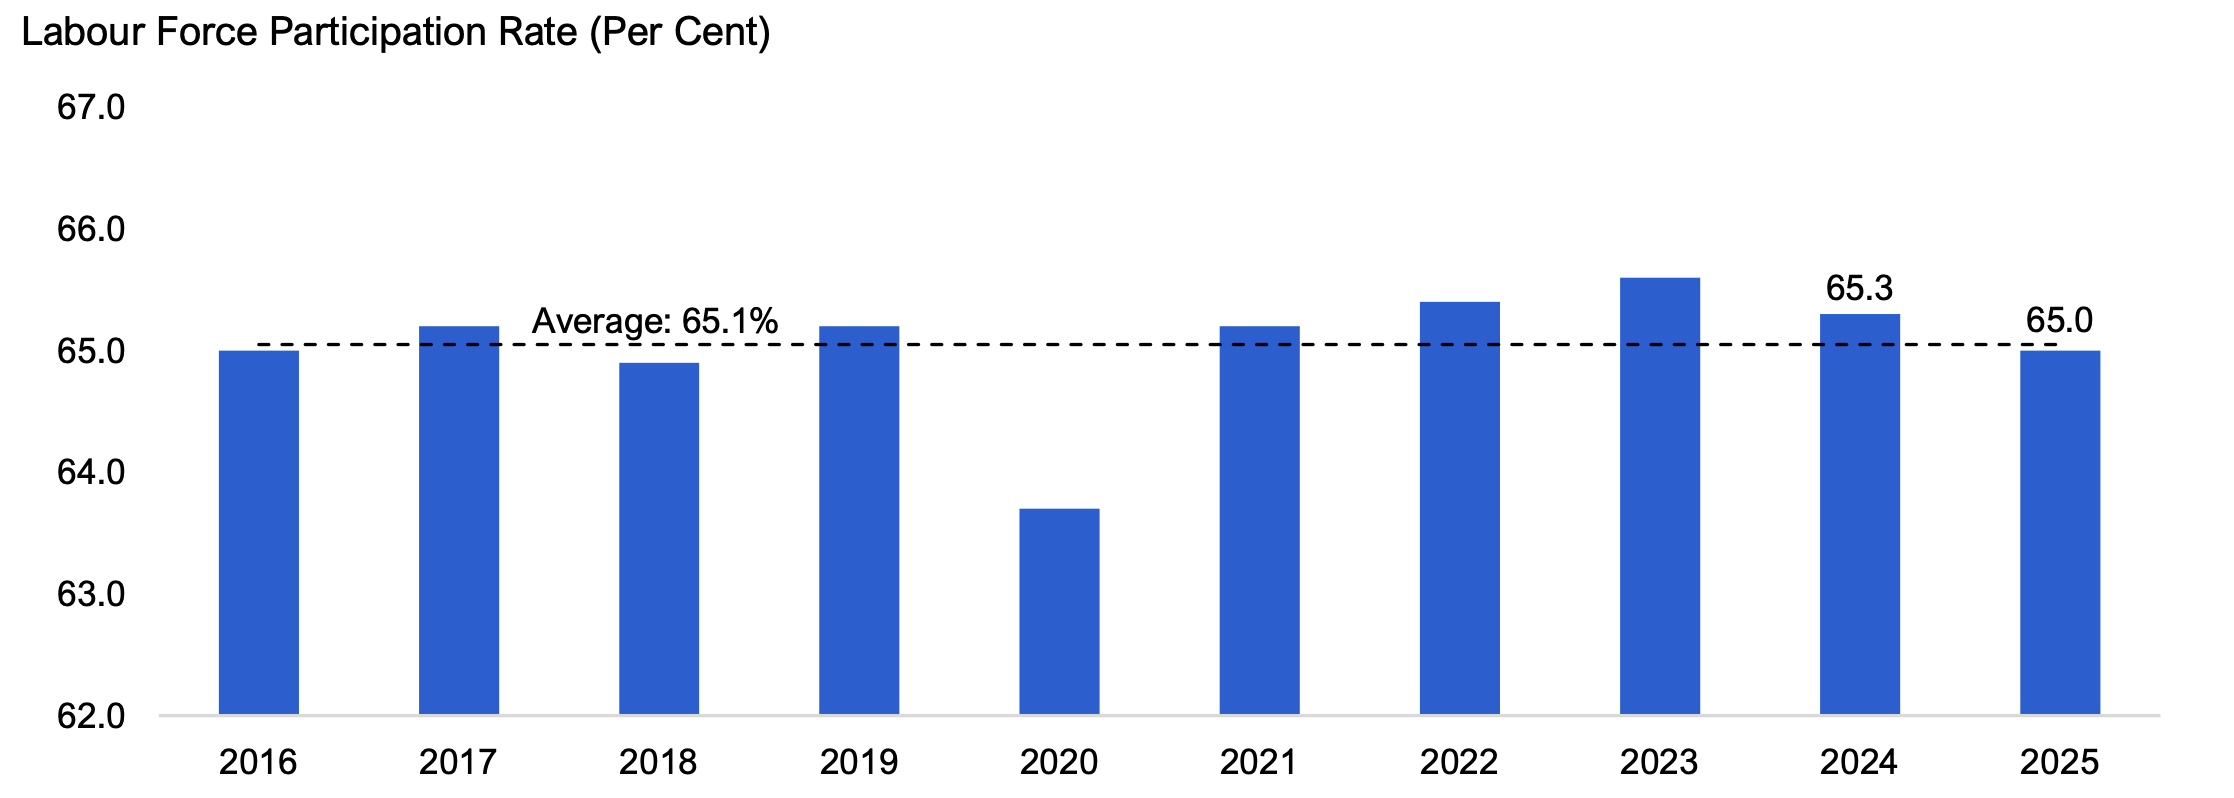
Note: The labour force participation rate is the percentage of the working-age population (15 years and older) who are participating in the labour market whether employed or unemployed and looking for work.
Source: Statistics Canada: Labour Force Survey: Table 14-10-0327-01
Accessible version
| Year | Labour Force Participation Rate (Per Cent) |
|---|---|
| 2016 | 65.0 |
| 2017 | 65.2 |
| 2018 | 64.9 |
| 2019 | 65.2 |
| 2020 | 63.7 |
| 2021 | 65.2 |
| 2022 | 65.4 |
| 2023 | 65.6 |
| 2024 | 65.3 |
| 2025 | 65.0 |
| Average | 65.1 |
Core-aged workers and youth experienced job gains while older male workers saw job losses
In 2025, core-aged workers (aged 25-54) and youth (aged 15-24) experienced job gains, while employment was essentially flat for older workers (aged 55 years and over), with job losses[7] for older workers concentrated among men.
Core-aged workers experienced employment growth of 1.0 per cent in 2025, with job gains for males (1.1 per cent) slightly faster than for females (0.9 per cent). Many of the jobs gained by core-aged workers were in industries that pay below-average wages.[8] Employment among older workers was little changed, as job gains for older females (0.7 per cent) were offset by losses for older males (-0.7 per cent).
Youth employment increased by 2.5 per cent, led by a 4.8 per cent increase in male youth employment. Job gains across most service industries drove this rise in male youth employment, which more than offset 6,100 fewer positions in manufacturing. In contrast, female youth job growth was only 0.1 per cent. Although the youth employment rate (50.7 per cent) and labour force participation rate (60.3 per cent) in 2025 improved from record lows (excluding the pandemic) in 2024, both rates were still the lowest among the provinces in 2025 and have been below the Canada average for more than 20 years.
The unemployment rate of core-aged workers increased by almost a full percentage point, rising from 5.8 per cent in 2024 to 6.7 per cent in 2025. For young workers, the unemployment rate increased by 0.3 percentage points to 16.0 per cent, the highest since 2012 excluding the pandemic. In periods of slow economic growth, the gap between the youth and core-age unemployment rates typically widens. During the 2024-2025 period, when Ontario’s economy grew slower than its longer-term average, the province’s youth unemployment rate averaged 9.6 percentage points higher than that of core-aged workers, the second largest two-year gap on record back to 1976 excluding the pandemic.[9] Older workers saw their unemployment rate increase from 4.7 per cent in 2024 to 5.2 per cent in 2025.
| Age and Gender | Annual Employment Change in 2025 (Thousands) |
Annual Employment Change in 2025 (Per Cent) |
Unemployment Rate (Per Cent) |
||
|---|---|---|---|---|---|
| 2023 | 2024 | 2025 | |||
| Youth (15-24 years) | 25.7 | 2.5 | 12.5 | 15.7 | 16.0 |
| Males | 25.2 | 4.8 | 12.7 | 17.6 | 16.8 |
| Females | 0.4 | 0.1 | 12.2 | 13.6 | 15.1 |
| Core (25-54 years) | 55.7 | 1.0 | 4.7 | 5.8 | 6.7 |
| Males | 31.6 | 1.1 | 4.4 | 5.9 | 6.8 |
| Females | 24.1 | 0.9 | 5.0 | 5.7 | 6.5 |
| Older (55 years and over) | -0.5 | 0.0 | 4.1 | 4.7 | 5.2 |
| Males | -6.2 | -0.7 | 4.2 | 4.9 | 5.4 |
| Females | 5.7 | 0.7 | 4.0 | 4.5 | 5.0 |
| Total | 80.9 | 1.0 | 5.6 | 7.0 | 7.7 |
Ontario saw job gains across most types of employment categories
Employment grew across all major job categories in 2025 except for public sector workers. For the second year in a row, employment in full-time positions (0.6 per cent) grew at a slower pace than part-time positions (2.8 per cent), which is generally characteristic of periods of slow economic growth. Full-time employment growth was weak for both core-aged (0.5 per cent) and older (0.3 per cent) workers.
Employment in the private sector increased by 1.4 per cent in 2025, while employment in the public sector declined by 0.1 per cent. The slowdown in public sector employment in 2025 followed four consecutive years of strong gains and partly reflected the downsizing of the federal public-sector workforce and lower international student enrolment, which affected employment in the public administration and education sectors.
The number of self-employed Ontarians increased by 0.4 per cent in 2025, after a 3.1 per cent gain in 2024. Higher self-employment in 2025 occurred in information, culture and recreation (15,600) and other services[10] (8,500), coinciding with losses in construction (-14,400) as home building slowed; business, building and other support services (-8,800); and agriculture (-3,500). Despite recording increases in the past two years, self‑employment in Ontario in 2025 was 2.7 per cent below its 2019 pre‑pandemic level.
Employment growth in temporary positions (7.0 per cent) outpaced that in permanent jobs (0.4 per cent) in 2025. Employment in permanent positions was held back by losses in trade-exposed industries,[11] including manufacturing (-9,000), transportation and warehousing (-3,600) and agriculture (-2,800), as well as other services (-16,300) and business, building and other support services (-4,600). The number of temporary workers expanded the most in wholesale and retail trade (13,300) and health care and social assistance (11,200), while job losses were concentrated in educational services (-5,600).
| Job Category | Annual Employment Change in 2025 (Thousands) |
Annual Employment Change in 2025 (Per Cent) |
|---|---|---|
| Type of Employment | ||
| Full-time | 40.6 | 0.6 |
| Part-time | 40.3 | 2.8 |
| Class of Workers | ||
| Private | 77.3 | 1.4 |
| Public | -1.3 | -0.1 |
| Self-employed | 4.8 | 0.4 |
| Job Permanency of Paid Employment* | ||
| Permanent | 22.3 | 0.4 |
| Temporary | 53.7 | 7.0 |
| Total | 80.9 | 1.0 |
Half of Ontario’s industries saw job growth
Of the 16 major industries in Ontario, eight saw an increase in employment in 2025, with gains concentrated in industries that pay below-average wages. Information, culture and recreation recorded the largest increase in employment (26,700), followed by wholesale and retail trade (25,200), accommodation and food services (18,700), health care and social assistance (14,700) and finance, insurance, real estate, rental and leasing (14,500).
The United States imposed tariffs on Canadian exports in 2025, adversely affecting industries that export a significant share of their production.[12] As a result, job losses in Ontario were recorded in industries highly affected by tariffs, including manufacturing (-8,400), agriculture (-6,400) and transportation and warehousing (-3,700). Ontario also saw lower employment in business, building and other support services (-12,200), reflecting in part low office occupancy and the continuation of hybrid work. Smaller job losses were recorded in educational services (-4,400), construction (-1,400) and public administration (-1,000).
| Industry | Annual Employment Change in 2025 (Thousands) |
Annual Employment Change in 2025 (Per Cent) |
|---|---|---|
| Information, culture and recreation | 26.7 | 8.2 |
| Wholesale and retail trade | 25.2 | 2.2 |
| Accommodation and food services | 18.7 | 4.4 |
| Health care and social assistance | 14.7 | 1.5 |
| Finance, insurance, real estate, rental and leasing | 14.5 | 2.1 |
| Professional, scientific and technical services | 11.1 | 1.2 |
| Utilities | 6.8 | 11.4 |
| Forestry, fishing, mining, quarrying, oil and gas | 1.3 | 3.0 |
| Other services | -0.8 | -0.3 |
| Public administration | -1.0 | -0.2 |
| Construction | -1.4 | -0.2 |
| Transportation and warehousing | -3.7 | -0.9 |
| Educational services | -4.4 | -0.7 |
| Agriculture | -6.4 | -8.9 |
| Manufacturing | -8.4 | -1.0 |
| Business, building and other support services | -12.2 | -4.2 |
Job vacancies continued to trend lower in 2025
In tandem with the slower pace of employment gains, job vacancies declined by 22,100 (-11.1 per cent) in 2025, and the overall job vacancy rate[13] fell from 2.9 per cent in 2024 to 2.6 per cent in 2025. Job vacancies have steadily trended lower since 2022, and the unemployment-to-job vacancy ratio[14] increased from 3.1 in 2024 to 3.9 in 2025, indicating softer labour market conditions.
Job vacancies declined in all industries in 2025. Of the 16 major industries in Ontario, health care and social assistance had the highest number of job vacancies (36,500) for the fourth year in a row and the highest job vacancy rate (4.0 per cent), followed by wholesale and retail trade (23,900) and accommodation and food services (17,900). The utilities sector had the lowest number of job vacancies (600), while educational services had the lowest job vacancy rate (1.2 per cent).
| Industry | Annual Change in Job Vacancies in 2025 (Thousands) |
Job Vacancies in 2025 (Thousands) |
Job Vacancy Rate in 2025 (Per Cent) |
|---|---|---|---|
| Health care and social assistance | -7.8 | 36.5 | 4.0 |
| Transportation and warehousing | -2.7 | 7.5 | 2.3 |
| Construction | -2.2 | 9.0 | 2.2 |
| Accommodation and food services | -1.9 | 17.9 | 3.6 |
| Educational services | -1.6 | 6.8 | 1.2 |
| Wholesale and retail trade | -1.5 | 23.9 | 2.2 |
| Business, building and other support services | -1.5 | 12.4 | 2.9 |
| Manufacturing | -1.3 | 12.0 | 1.7 |
| Finance, insurance, real estate, rental and leasing | -0.5 | 11.7 | 2.1 |
| Agriculture, forestry, fishing and hunting | -0.4 | 2.2 | 3.4 |
| Information, culture and recreation | -0.3 | 6.5 | 2.4 |
| Utilities | -0.2 | 0.6 | 1.2 |
| Public administration | -0.2 | 4.9 | 2.1 |
| Professional, scientific and technical services | -0.1 | 15.4 | 2.7 |
| Other services | -0.1 | 8.3 | 3.9 |
| Mining, quarrying, and oil and gas extraction | 0.0 | 0.9 | 2.9 |
| All Industries | -22.1 | 176.4 | 2.6 |
Unemployment rate increased in all but one Census Metropolitan Area
Employment increased in 12 out of the 15 census metropolitan areas (CMAs) in Ontario in 2025.[15] Peterborough (6.0 per cent) had the fastest pace of job creation, particularly in accommodation and food services, and wholesale and retail trade. In contrast, Guelph experienced the sharpest decline in employment (-5.3 per cent), with job losses concentrated in manufacturing, public administration, and accommodation and food services.[16] Employment also declined in Barrie (-1.6 per cent) and Ottawa-Gatineau (-0.7 per cent).
The unemployment rate increased in all but one Ontario CMA. Across the CMAs, the highest unemployment rates in 2025 were recorded in Windsor (9.7 per cent), Oshawa (8.7 per cent) and Toronto (8.6 per cent). Thunder Bay recorded the lowest unemployment rate (4.8 per cent), followed by Greater Sudbury (6.0 per cent) and Ottawa-Gatineau (6.5 per cent).
CMAs with greater exposure to industries exporting to the United States and therefore most likely to experience negative impacts from US tariffs generally saw larger increases in their unemployment rates than the Ontario average in 2025. The unemployment rates for Brantford (+2.6 percentage points; from 5.4 to 8.0 per cent), Guelph (+2.1 percentage points; from 5.0 to 7.1 per cent), Oshawa (+1.9 per cent points; from 6.8 to 8.7 per cent) and Windsor (+1.4 percentage points; from 8.3 to 9.7 per cent) all increased at a faster pace than the Ontario average (+0.7 percentage points; from 7.0 to 7.7 per cent). The unemployment rate for St. Catharines-Niagara declined from 7.5 per cent in 2024 to 6.9 per cent in 2025.
| Census Metropolitan Area | Annual Employment Change in 2025 (Per Cent) |
Unemployment Rate (Per Cent) |
||
|---|---|---|---|---|
| 2023 | 2024 | 2025 | ||
| Peterborough | 6.0 | 4.6 | 4.8 | 7.7 |
| Greater Sudbury | 5.8 | 4.9 | 5.5 | 6.0 |
| Oshawa | 3.1 | 5.6 | 6.8 | 8.7 |
| Thunder Bay | 2.8 | 4.1 | 4.3 | 4.8 |
| St. Catharines-Niagara | 2.5 | 5.8 | 7.5 | 6.9 |
| Brantford | 2.3 | 4.6 | 5.4 | 8.0 |
| Hamilton | 2.1 | 5.4 | 6.8 | 7.0 |
| London | 2.1 | 5.2 | 6.6 | 6.7 |
| Kitchener-Cambridge-Waterloo | 2.0 | 6.0 | 7.2 | 7.7 |
| Toronto | 1.8 | 6.3 | 8.0 | 8.6 |
| Kingston | 1.7 | 4.7 | 6.3 | 6.7 |
| Windsor | 0.4 | 6.2 | 8.3 | 9.7 |
| Ottawa-Gatineau, Ontario part | -0.7 | 4.5 | 5.7 | 6.5 |
| Barrie | -1.6 | 4.8 | 6.1 | 7.7 |
| Guelph | -5.3 | 4.5 | 5.0 | 7.1 |
Unemployment rate increased in most provinces
Nine out of 10 provinces experienced job gains in 2025. Alberta had the fastest pace of job creation (2.8 per cent), while Newfoundland and Labrador had the weakest performance, recording a small employment loss (‑0.1 per cent). Ontario’s employment growth (1.0 per cent) was the third slowest among all provinces.
In 2025, the unemployment rate increased in eight provinces. Newfoundland and Labrador continued to have the highest unemployment rate among the provinces (10.1 per cent), while Saskatchewan had the lowest (5.2 per cent) and was the only province to see a decline in its unemployment rate. Ontario recorded the third highest unemployment rate (7.7 per cent) and largest increase in the unemployment rate in the country for the second consecutive year.
| Province | Annual Employment Change in 2025 (Per Cent) |
Unemployment Rate (Per Cent) |
||
|---|---|---|---|---|
| 2023 | 2024 | 2025 | ||
| Alberta | 2.8 | 5.9 | 7.0 | 7.2 |
| Saskatchewan | 2.5 | 4.7 | 5.4 | 5.2 |
| Quebec | 1.7 | 4.5 | 5.3 | 5.6 |
| Manitoba | 1.6 | 4.9 | 5.4 | 5.9 |
| New Brunswick | 1.3 | 6.6 | 7.0 | 7.1 |
| British Columbia | 1.1 | 5.2 | 5.6 | 6.2 |
| Prince Edward Island | 1.1 | 7.2 | 8.0 | 8.0 |
| Ontario | 1.0 | 5.6 | 7.0 | 7.7 |
| Nova Scotia | 0.4 | 6.4 | 6.5 | 6.6 |
| Newfoundland and Labrador | -0.1 | 9.9 | 10.0 | 10.1 |
| Canada | 1.4 | 5.4 | 6.3 | 6.8 |
Wage growth in Ontario outpaced inflation in 2025
The average hourly wage of Ontarians increased 3.5 per cent to $37.72 in 2025, faster than the 1.9 per cent annual consumer price index (CPI) inflation rate. Ontario’s average hourly wage gains exceeded the CPI inflation rate for the third year in a row.
Figure 4 Average hourly wage growth outpaced inflation in 2025
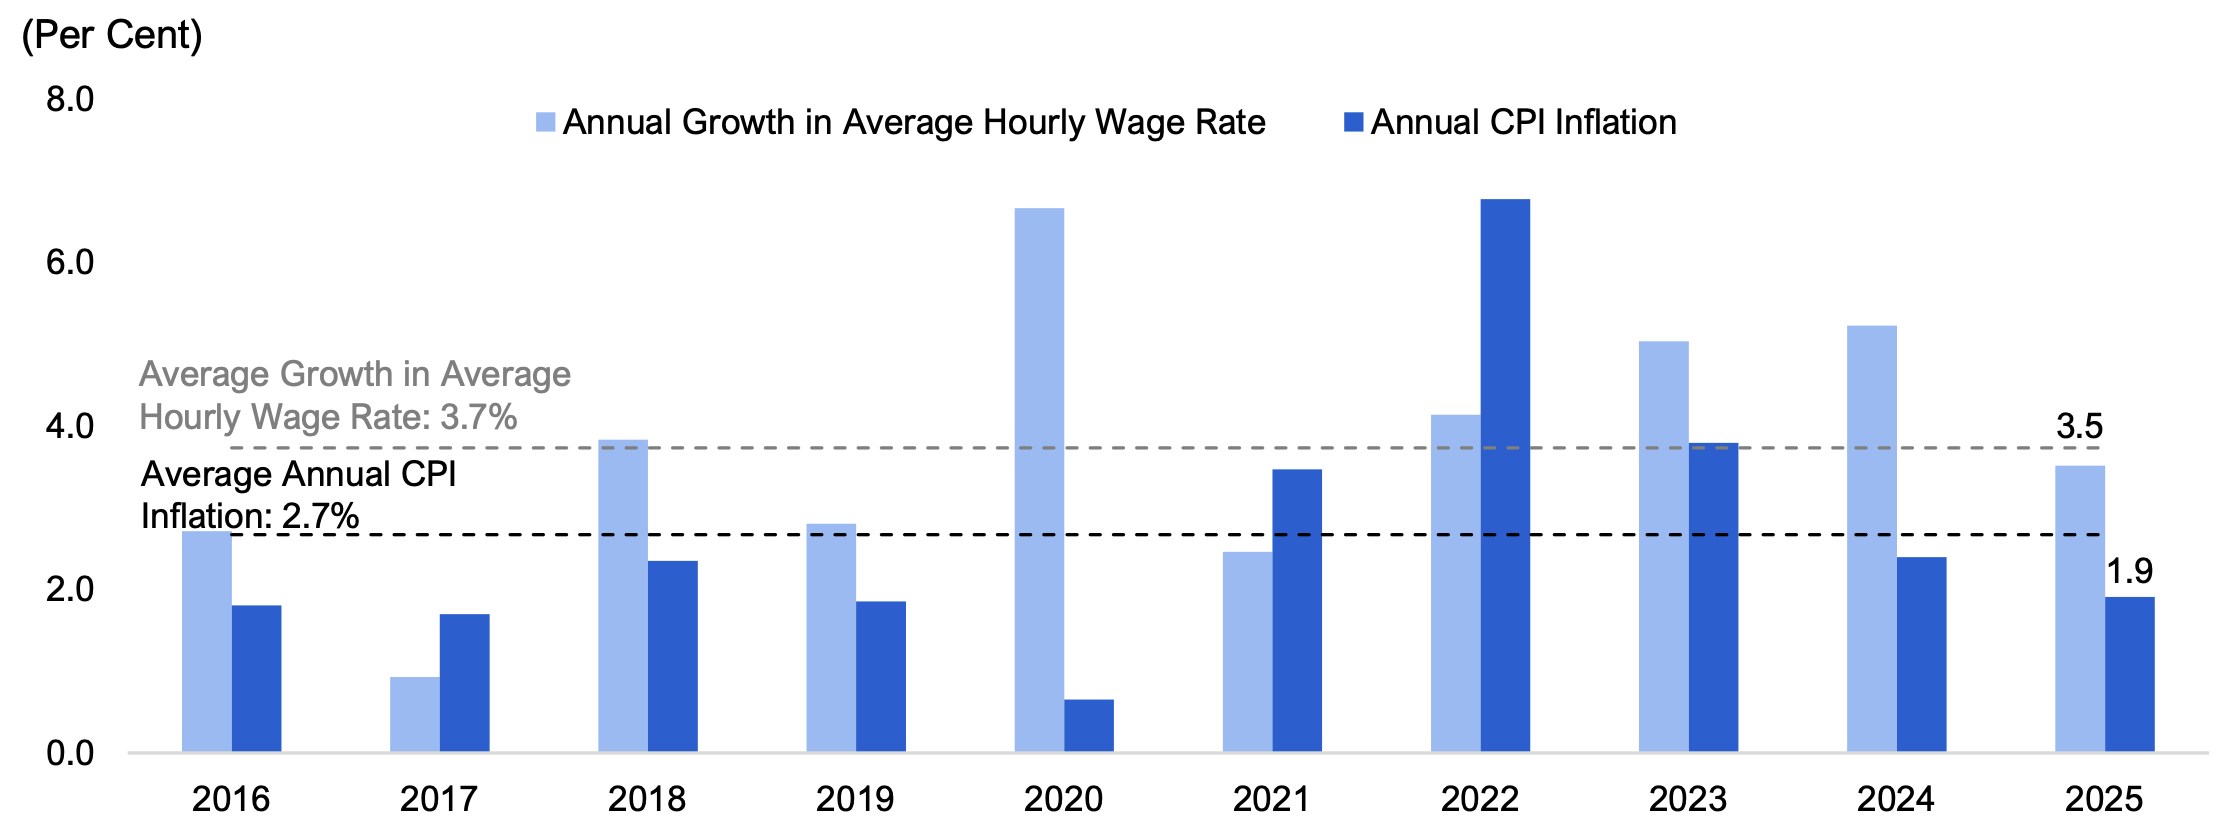
Source: Statistics Canada: Labour Force Survey: Table 14-10-0064-01 and Consumer Price Index: Table 18-10-0005-01
Accessible version
| Year | Annual Growth in Average Hourly Wage Rate (Per Cent) |
Annual CPI Inflation (Per Cent) |
|---|---|---|
| 2016 | 2.7 | 1.8 |
| 2017 | 0.9 | 1.7 |
| 2018 | 3.8 | 2.4 |
| 2019 | 2.8 | 1.9 |
| 2020 | 6.7 | 0.7 |
| 2021 | 2.5 | 3.5 |
| 2022 | 4.1 | 6.8 |
| 2023 | 5.0 | 3.8 |
| 2024 | 5.2 | 2.4 |
| 2025 | 3.5 | 1.9 |
| Average | 3.7 | 2.7 |
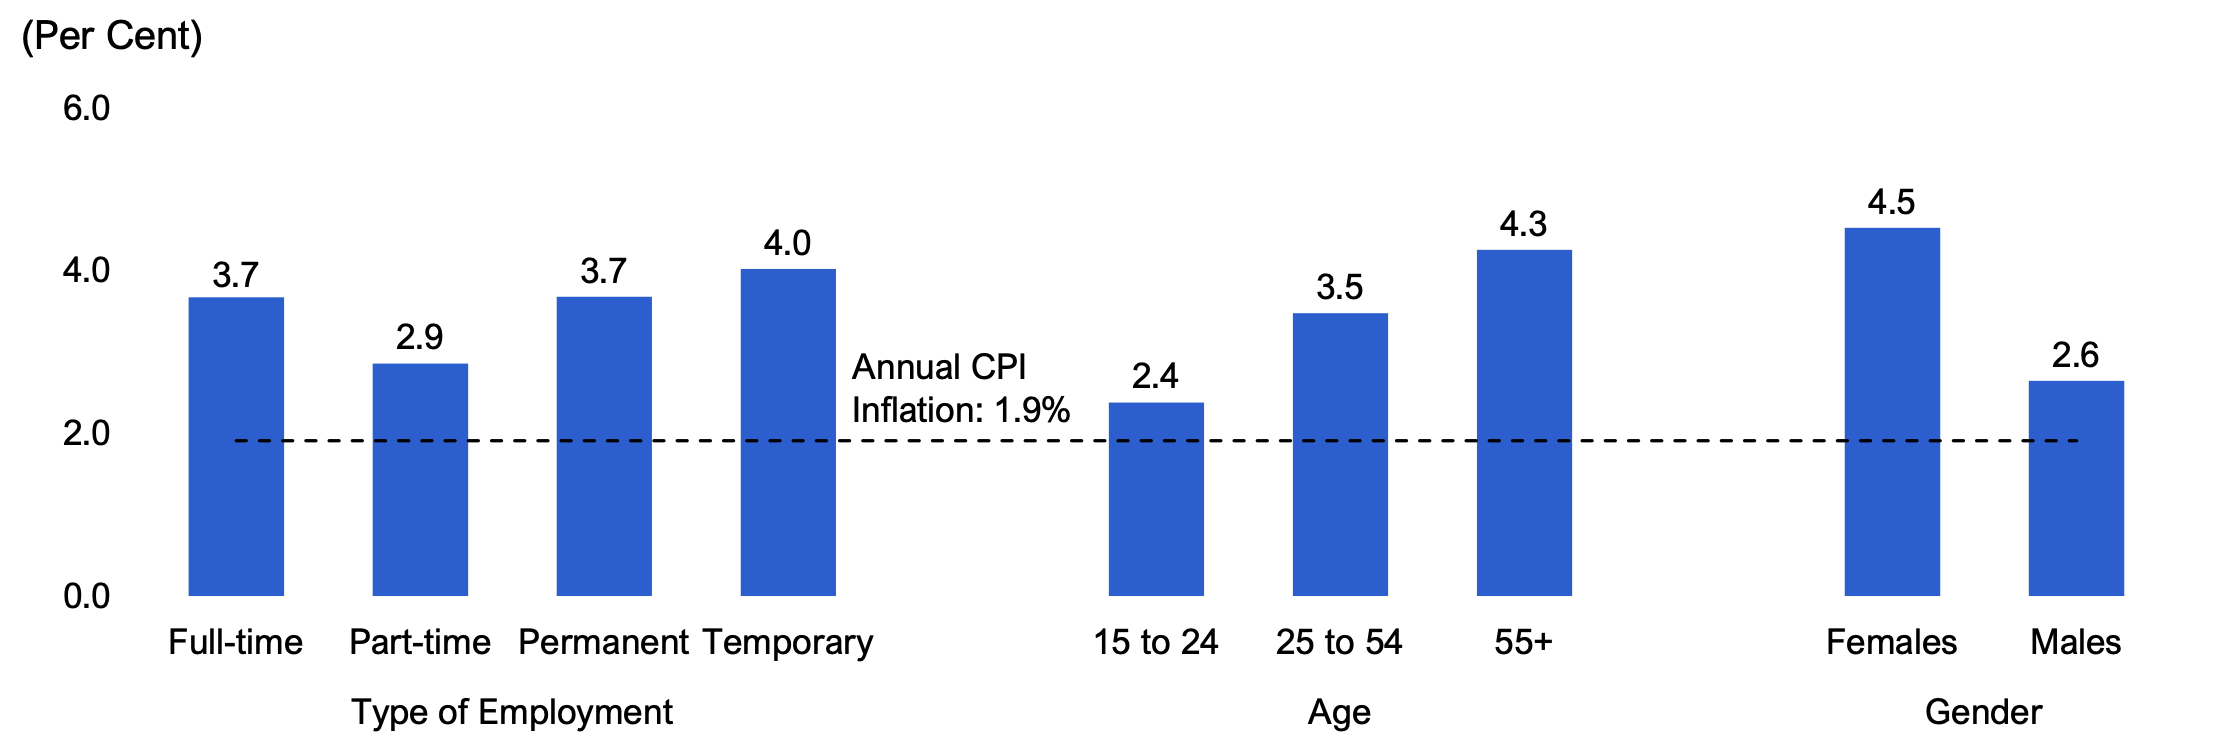
Average wage growth was above the 1.9 per cent inflation rate for all major groups of workers. Wages for full time employees increased by 3.7 per cent, faster than the 2.9 per cent gain among part-time workers. Wages for permanent workers increased by 3.7 per cent, slightly below the 4.0 per cent gain among temporary workers. Across the broader age groups, older workers saw the fastest average wage gains at 4.3 per cent, followed by core-aged workers (3.5 per cent) and youth (2.4 per cent). Average wage growth for female workers (4.5 per cent) outpaced that for male workers (2.6 per cent).
Figure 5 Average hourly wage growth was above inflation for all major groups in 2025
Source: Statistics Canada: Labour Force Survey: Tables 14-10-0064-01 and 14-10-0066-01, and Consumer Price Index: Table 18-10-0005-01
Accessible version
| Annual Growth in Average Hourly Wage Rate (Per Cent) |
Annual CPI Inflation (Per Cent) |
||
|---|---|---|---|
| Type of Employment | Full-time | 3.7 | 1.9 |
| Part-time | 2.9 | ||
| Permanent | 3.7 | ||
| Temporary | 4.0 | ||
| Age | 15 to 24 | 2.4 | |
| 25 to 54 | 3.5 | ||
| 55+ | 4.3 | ||
| Gender | Females | 4.5 | |
| Males | 2.6 |
Wage growth in most industries and occupation groups exceeded inflation
The average hourly wage rate increased at a faster pace than inflation in 12 of 16 major industry groups in 2025. Workers in trade-exposed industries such as transportation and warehousing, manufacturing, and wholesale and retail trade saw some of the slowest growth in average hourly wage rates among all industries in 2025.
| Industry | Average Hourly Wage Rate in 2025 ($) |
Annual Change in Average Hourly Wage Rate in 2025 (Per Cent) |
|---|---|---|
| Business, building and other support services | 29.13 | 11.2 |
| Information, culture and recreation | 36.46 | 9.2 |
| Educational services | 43.38 | 5.2 |
| Utilities | 59.95 | 4.9 |
| Public administration | 48.81 | 4.6 |
| Health care and social assistance | 35.93 | 4.4 |
| Professional, scientific and technical services | 51.41 | 3.5 |
| Accommodation and food services | 21.15 | 3.2 |
| Finance, insurance, real estate, rental and leasing | 46.39 | 3.1 |
| Other services | 32.10 | 3.0 |
| Agriculture | 25.21 | 2.7 |
| Construction | 38.43 | 2.5 |
| Wholesale and retail trade | 28.46 | 1.4 |
| Manufacturing | 35.17 | 1.2 |
| Transportation and warehousing | 33.43 | 0.6 |
| Forestry, fishing, mining, quarrying, oil and gas | 46.65 | 0.5 |
| Total employees, all industries | 37.72 | 3.5 |
Across 34 different occupation groups, the average hourly wage for 28 occupations increased above inflation in 2025. Those with the strongest wage growth were occupations in art, culture and sport; administrative and financial supervisors and specialized administrative occupations; and technical occupations related to natural and applied sciences. Average hourly wages in four groups declined in 2025: middle management occupations in retail and wholesale trade and customer services; care providers and public protection support occupations and student monitors, crossing guards and related occupations; middle management occupations in trades, transportation, production and utilities; and labourers in processing, manufacturing and utilities.
| National Occupational Classification (NOC) |
Average Hourly Wage Rate in 2025 ($) |
Annual Change in Average Hourly Wage Rate in 2025 (Per Cent) |
|---|---|---|
| Management occupations | 63.66 | -0.1 |
| Legislative and senior management occupations | 102.11 | 5.5 |
| Specialized middle management occupations | 67.46 | 2.3 |
| Middle management occupations in retail and wholesale trade and customer services | 49.22 | -5.3 |
| Middle management occupations in trades, transportation, production and utilities | 58.48 | -1.7 |
| Business, finance and administration occupations except management | 37.05 | 5.6 |
| Professional occupations in finance and business | 47.26 | 5.4 |
| Administrative and financial supervisors and specialized administrative occupations | 38.68 | 9.7 |
| Administrative occupations and transportation logistics occupations | 33.09 | 7.8 |
| Administrative and financial support and supply chain logistics occupations | 26.72 | 4.1 |
| Natural and applied sciences and related occupations except management | 50.50 | 5.4 |
| Professional occupations in natural and applied sciences | 55.47 | 5.1 |
| Technical occupations related to natural and applied sciences | 39.75 | 9.6 |
| Health occupations except management | 38.64 | 5.1 |
| Professional occupations in health | 48.09 | 5.5 |
| Technical occupations in health | 38.32 | 4.8 |
| Assisting occupations in support of health services | 25.75 | 3.2 |
| Occupations in education, law and social, community and government services except management | 43.55 | 5.1 |
| Professional occupations in law, education, social, community and government services | 50.39 | 6.6 |
| Front-line public protection services and paraprofessional occupations in legal, social, community, education services | 33.63 | 3.1 |
| Assisting occupations in education and in legal and public protection | 31.65 | 6.7 |
| Care providers and public protection support occupations and student monitors, crossing guards and related occupations | 21.48 | -3.4 |
| Occupations in art, culture, recreation and sport except management | 31.06 | 3.4 |
| Professional occupations in art and culture | 42.98 | 3.7 |
| Technical occupations in art, culture and sport | 35.14 | 3.0 |
| Occupations in art, culture and sport | 27.99 | 19.3 |
| Support occupations in art, culture and sport | 22.23 | 4.9 |
| Sales and service occupations except management | 24.30 | 3.4 |
| Retail sales and service supervisors and specialized occupations in sales and services | 30.96 | 4.6 |
| Occupations in sales and services | 26.96 | 1.9 |
| Sales and service representatives and other customer and personal services occupations | 25.65 | 4.4 |
| Sales and service support occupations | 19.68 | 3.3 |
| Trades, transport and equipment operators and related occupations except management | 32.85 | 4.4 |
| Technical trades and transportation officers and controllers | 38.35 | 5.0 |
| General trades | 30.36 | 5.5 |
| Mail and message distribution, other transport equipment operators and related maintenance workers | 28.91 | 4.3 |
| Helpers and labourers and other transport drivers, operators and labourers | 25.11 | 3.1 |
| Natural resources, agriculture and related production occupations except management | 27.94 | 3.6 |
| Supervisors and occupations in natural resources, agriculture and related production | 41.16 | 9.1 |
| Workers and labourers in natural resources, agriculture and related production | 23.23 | 3.9 |
| Occupations in manufacturing and utilities except management | 28.39 | -0.1 |
| Supervisors, central control and process operators in processing, manufacturing and utilities and aircraft assemblers and inspectors | 40.50 | 0.7 |
| Machine operators, assemblers and inspectors in processing, manufacturing and printing | 26.18 | 0.7 |
| Labourers in processing, manufacturing and utilities | 22.14 | -0.4 |
| Total employees, all occupations | 37.72 | 3.5 |
Footnotes
[1] Job losses include layoffs and dismissals as well as voluntary exits such as retiring.
[2] Defined as the number of job vacancies expressed as a percentage of labour demand, that is, all occupied and vacant jobs.
[3] Defined as the percentage of the labour force who are unemployed and looking for work.
[4] Defined as the percentage of the working-age population (15 years and older) who are participating in the labour market whether employed or unemployed and looking for work.
[5] Defined as the working-age population (15 years and older) who are employed or unemployed and looking for work.
[6] Defined as the percentage of the working-age population (15 years and older) who are employed.
[7] Job losses include layoffs and dismissals as well as voluntary exits such as retiring.
[8] For example, accommodation and food services (18,800), information, culture and recreation (12,500) and transportation and warehousing (11,500).
[9] The youth unemployment rate averaged 9.7 percentage points higher than the core-aged rate in 2012 to 2013.
[10] Other services include industries related to repair and maintenance of motor vehicles, machinery and equipment and other products; personal care services, funeral services, laundry services, and other services to individuals; religious, grant-making, civic, and professional and similar organizations; as well as private households engaged in employing workers, such as cooks, maids, gardeners or caretakers, and babysitting services. For details, see North American Industry Classification System (NAICS) Canada 2022 Version 1.0.
[11] See the FAO’s report The Potential Impacts of US Tariffs on the Ontario Economy, April 2025.
[12] Ibid.
[13] Defined as the number of job vacancies expressed as a percentage of labour demand, that is, all occupied and vacant jobs.
[14] The ratio can be interpreted as the number of unemployed people per job vacancy.
[15] The CMA Belleville–Quinte West was excluded due to high volatility in its labour market data.
[16] Statistics Canada: Labour Force Survey: Table 14-10-0468-01.