

1. Summary
At the request of Members of Provincial Parliament, this report reviews the Government of Ontario’s (the Province’s) Ministry of Colleges, Universities, Research Excellence and Security (MCURES or ministry) spending plan as outlined in the 2026 Ontario Budget.
Spending Plan Overview
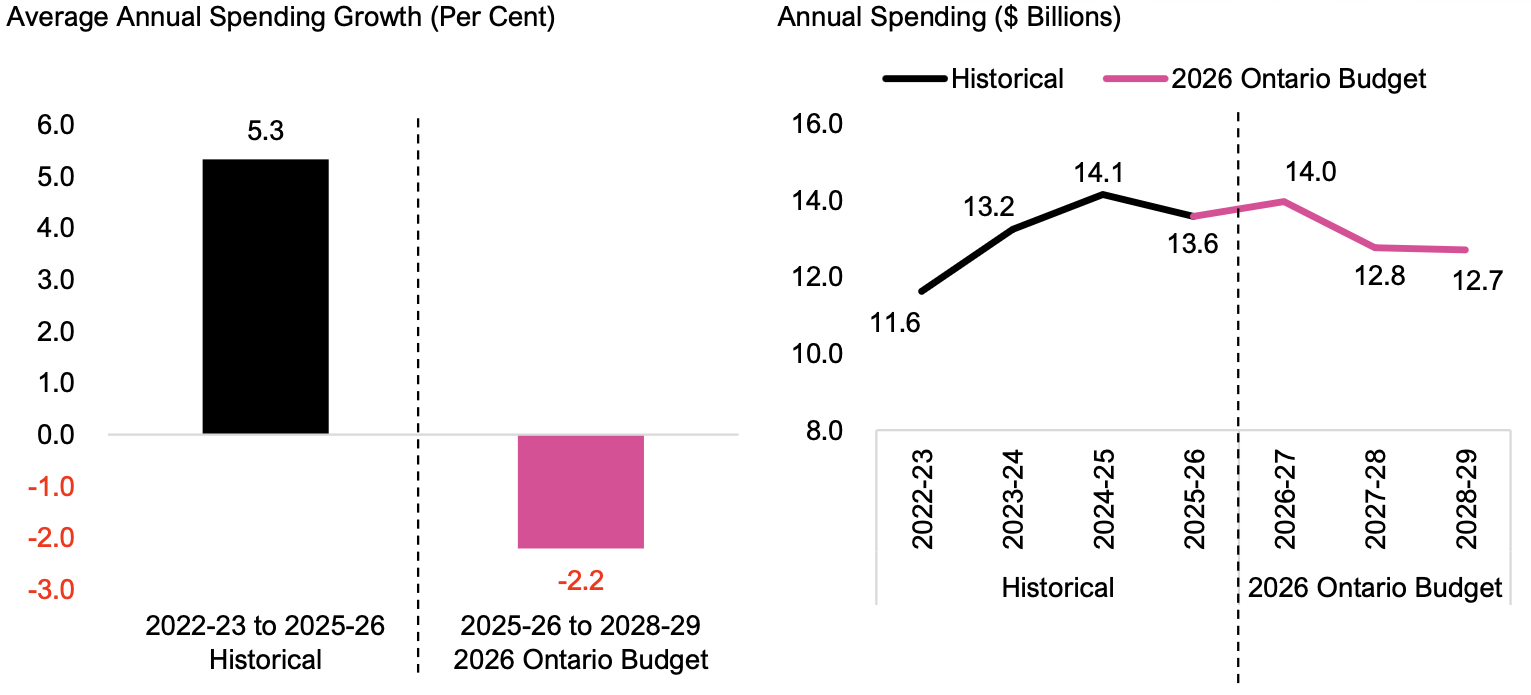
- In the 2026 Ontario Budget, the Province projects that MCURES spending will decrease at an average annual rate of 2.2 per cent, from $13.6 billion in 2025-26 to $12.7 billion in 2028-29.
- By comparison, MCURES spending grew at an average annual rate of 5.3 per cent over the previous three years from 2022-23 to 2025-26.
- For context, over the 36-year period from 1990-91 to 2025-26, MCURES spending grew at an average annual rate of 4.0 per cent. If the Province’s MCURES spending plan in the 2026 budget is achieved, it would be the slowest three-year growth rate since 2017-18 to 2020-21.
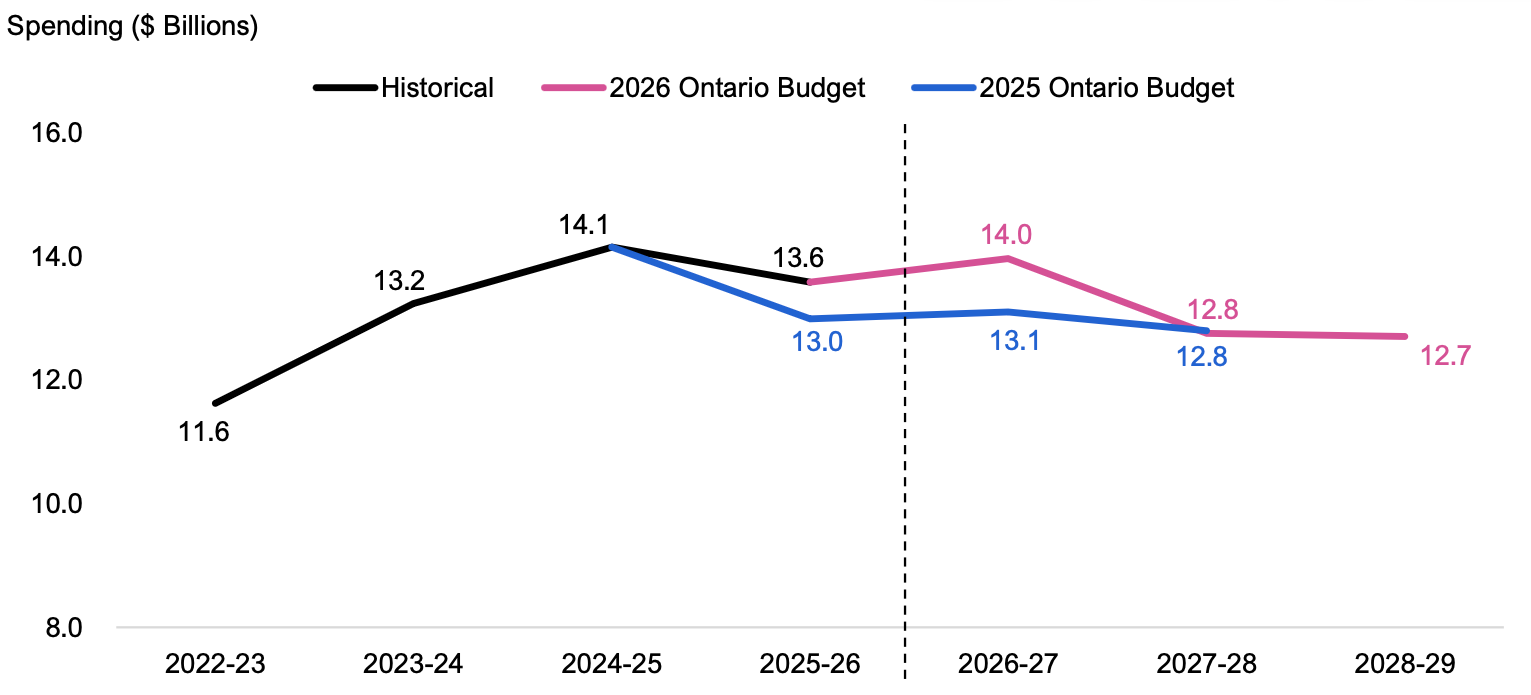
- Compared to the MCURES spending plan in the 2025 Ontario Budget, the MCURES spending plan in the 2026 Ontario Budget has increased by a total of $1.4 billion from 2025-26 to 2027-28. This includes additional spending of $0.6 billion in 2025-26 and $0.9 billion in 2026-27.
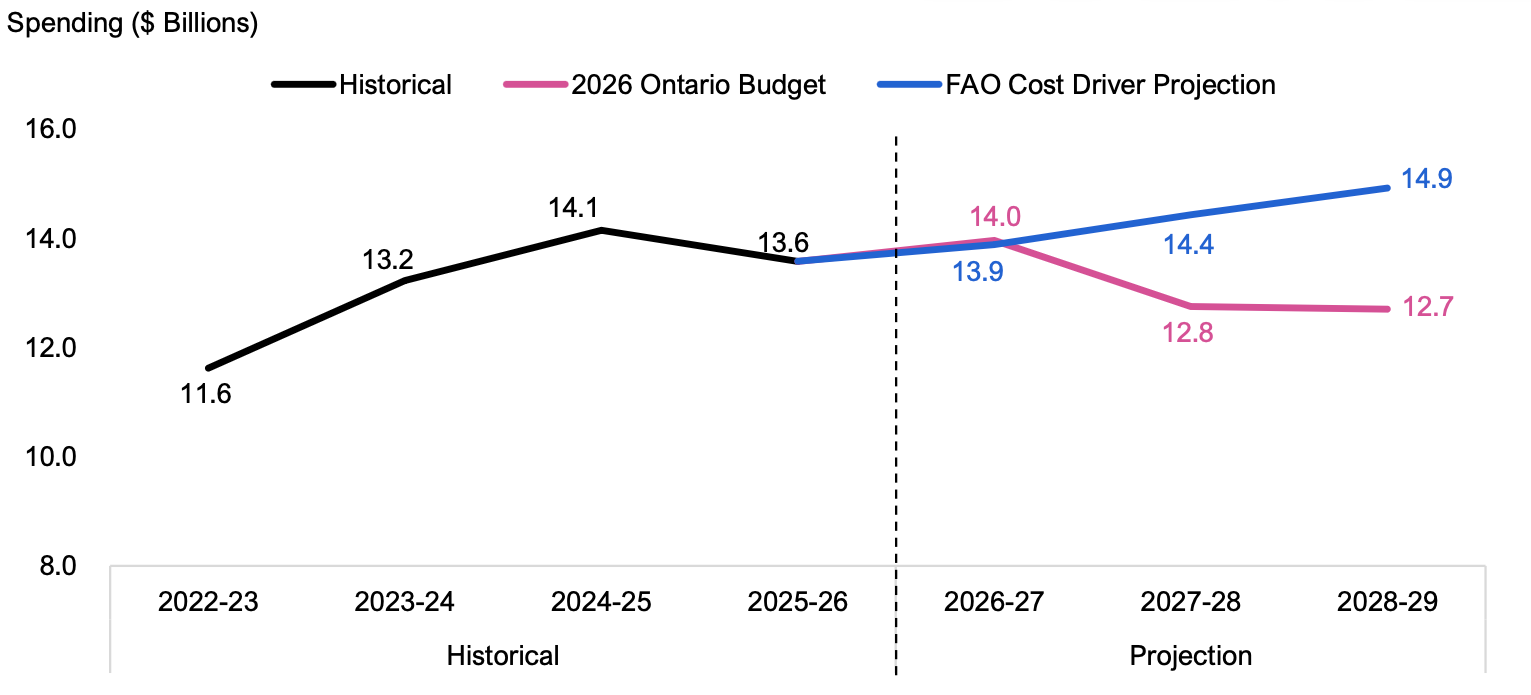
- The FAO estimated MCURES spending from 2026-27 to 2028-29 that would be required to maintain 2025-26 service levels. Also known as a cost driver projection, this scenario does not recommend how spending should change but serves as a benchmark to show whether the 2026 budget’s MCURES spending plan is likely to maintain, improve or reduce the quality and accessibility of ministry services.
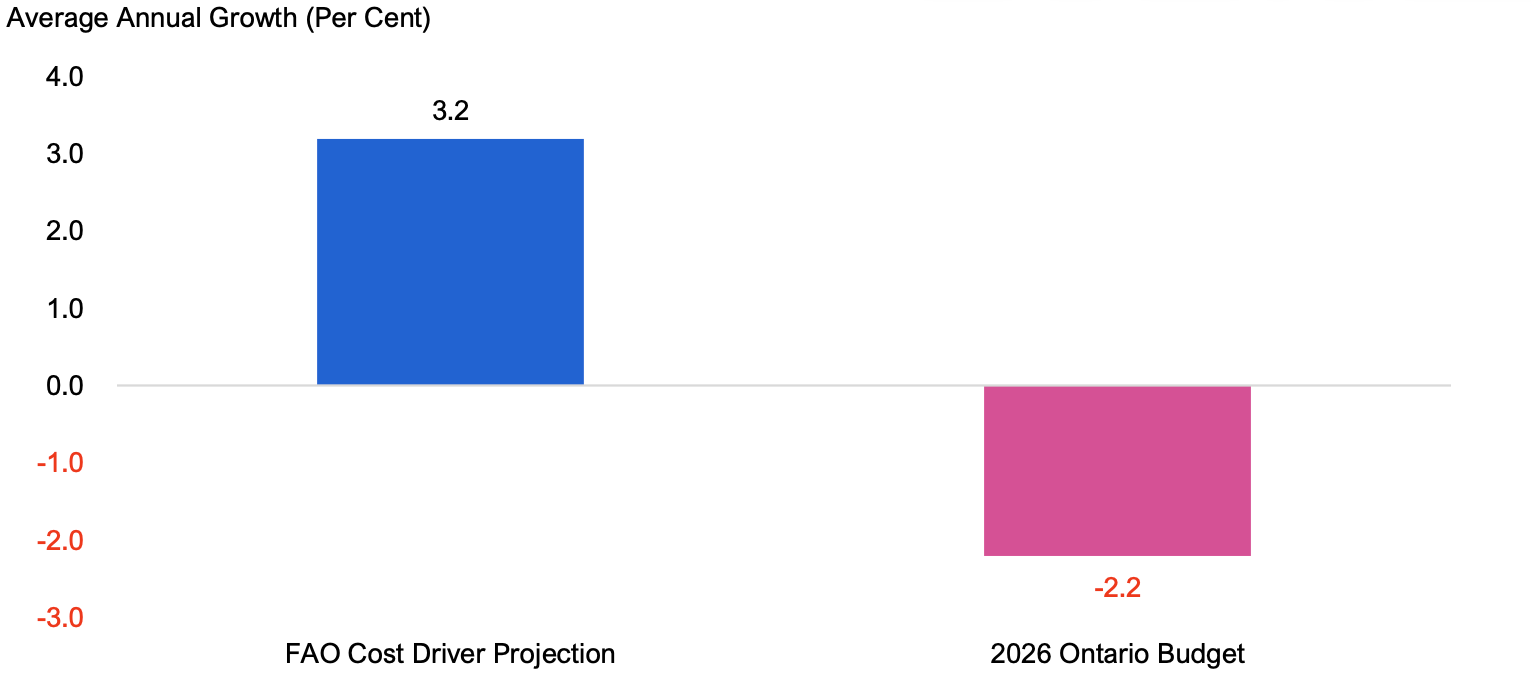
- Overall, the FAO estimates that MCURES spending would need to grow by an average annual rate of 3.2 per cent over the next three years to maintain current service levels.
- The 2026 budget spending plan is above the FAO’s cost driver projection by $0.1 billion in 2026‑27, and below the FAO’s cost driver projection by $1.7 billion in 2027-28 and $2.2 billion in 2028‑29. The funding shortfall starting in 2027-28 means that, to maintain current service levels, the Province will need to implement program efficiencies (i.e., provide the same level of services with less resources) and/or commit additional funding beyond what was planned in the 2026 Ontario Budget.
Spending Plan Analysis
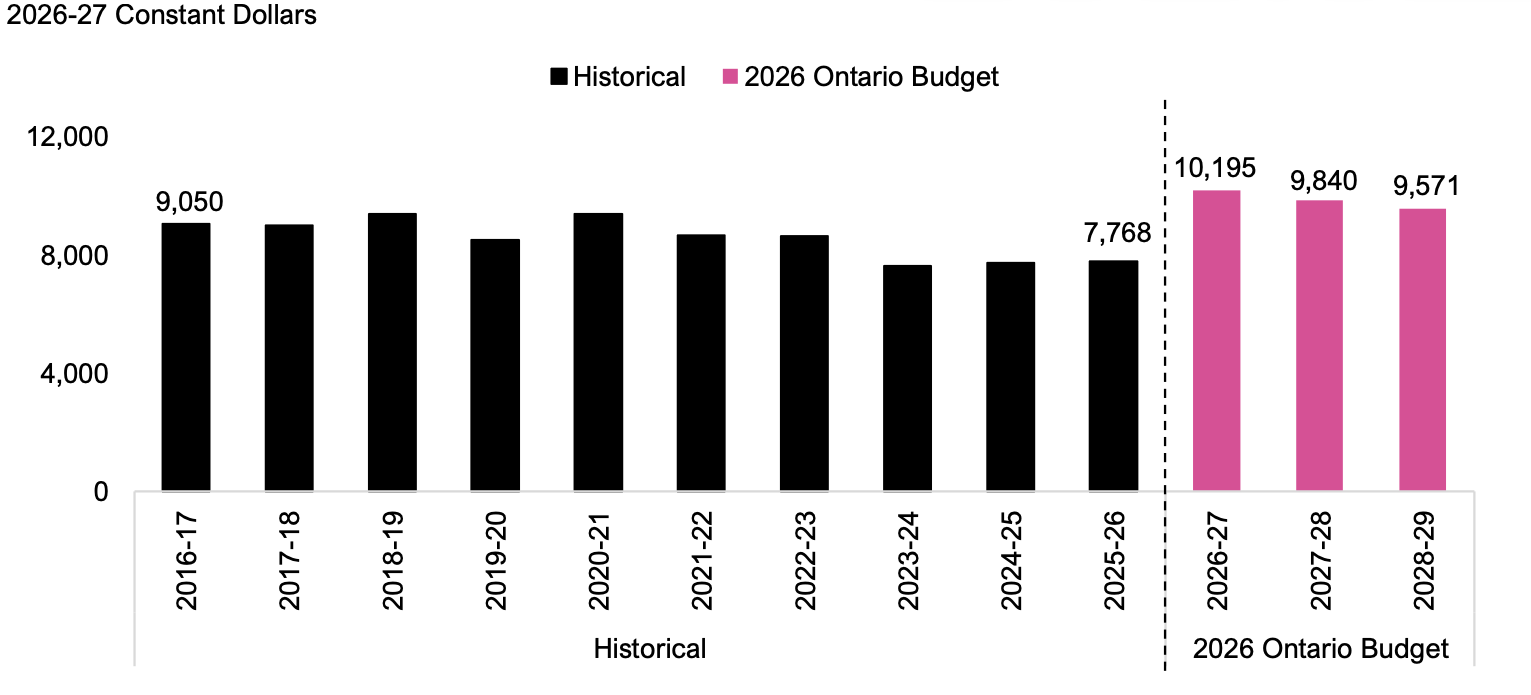
- Colleges: The ministry provides funding to Ontario’s 24 public colleges to support domestic students. On an inflation-adjusted basis (i.e., real 2026-27 dollars), the FAO estimates that the Province provided $7,768 in operating funding to colleges per full-time equivalent (FTE) domestic student in 2025-26. Based on the 2026 budget spending plan, the FAO estimates that real provincial funding to colleges will increase to $10,195 per FTE domestic student in 2026-27, and then decline to $9,840 in 2027-28 and $9,571 in 2028-29.
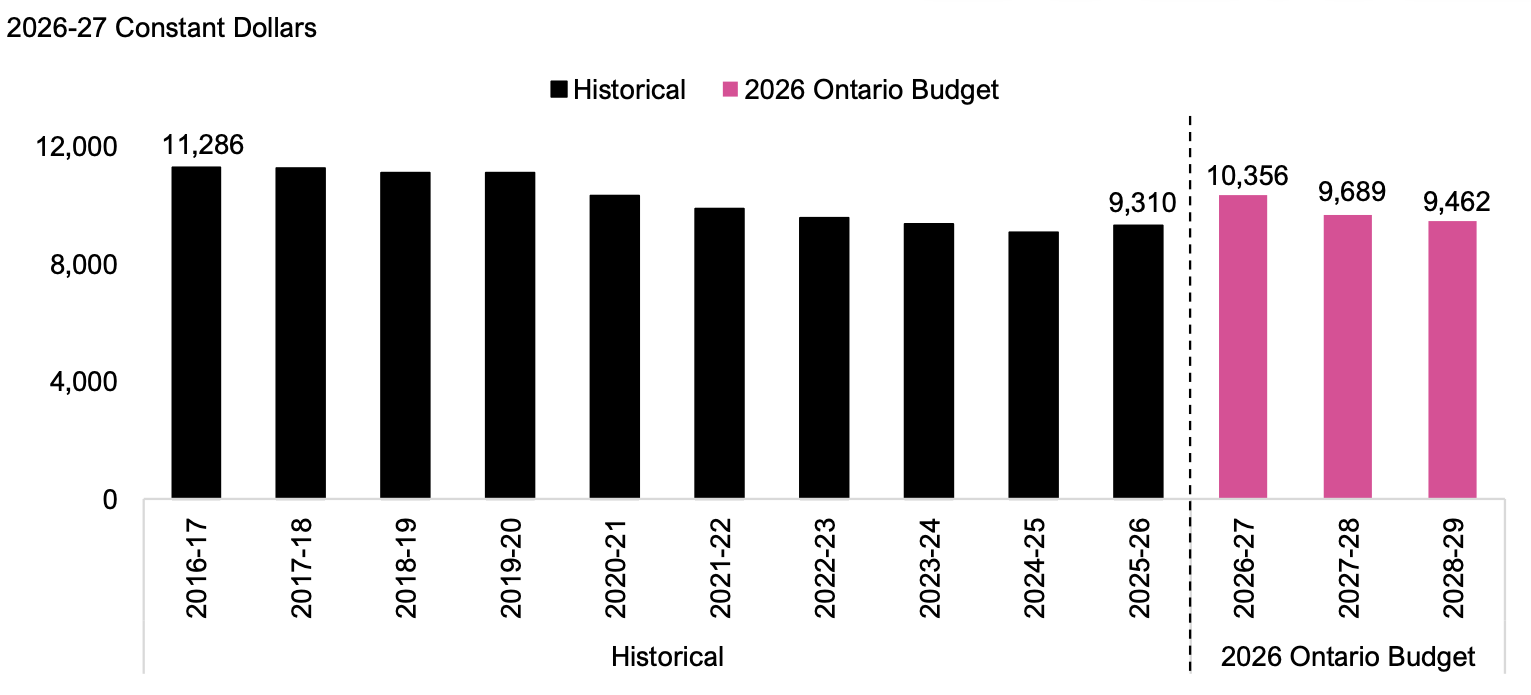
- Universities: The ministry provides operating funding to Ontario’s 23 public universities to support domestic students. On an inflation-adjusted basis, provincial operating funding to universities was $9,310 per FTE domestic student in 2025-26. Based on the 2026 budget spending plan, the FAO estimates that real provincial operating funding to universities per FTE domestic student will increase to $10,356 in 2026-27, and then decline to $9,689 in 2027-28 and $9,462 in 2028-29.
- Student Financial Assistance Programs: The ministry’s student financial assistance programs are comprised of loans, grants, scholarships and repayment assistance. Of the grants available to postsecondary students, the Ontario Student Grant (OSG) forms the largest share at 91.7 per cent in 2025-26.[1] Beginning in the 2026-27 academic year, the Province implemented changes to student financial assistance programs, including reducing the amount of funding that students enrolled in public colleges and universities may be eligible to receive as provincial grants, and eliminating provincial grants for students enrolled in private career colleges.
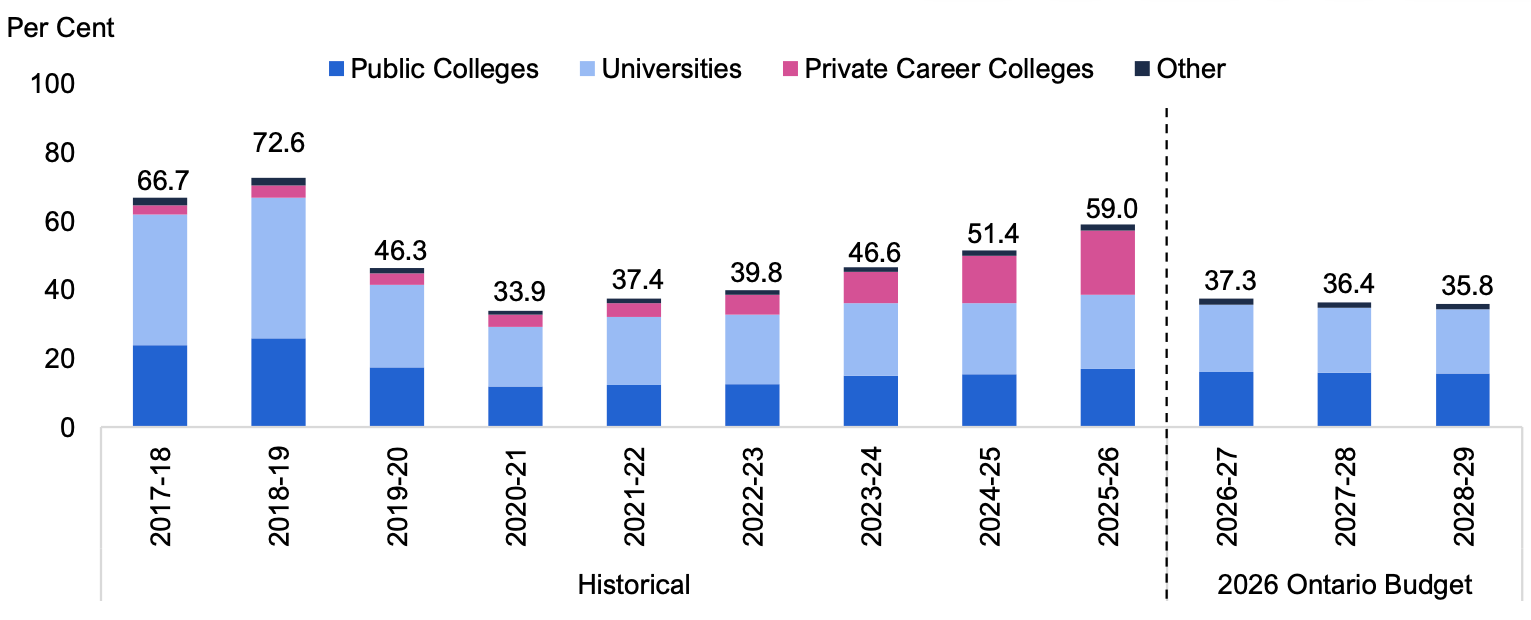
- In the 2025-26 academic year, the FAO estimates that 59.0 per cent of Ontario-resident postsecondary students received the OSG. Based on the change in OSG funding eligibility announced by the Province, the FAO estimates that the share of Ontario-resident postsecondary students who will receive the OSG will decrease to 37.3 per cent in 2026-27, 36.4 per cent in 2027-28 and 35.8 per cent in 2028-29.
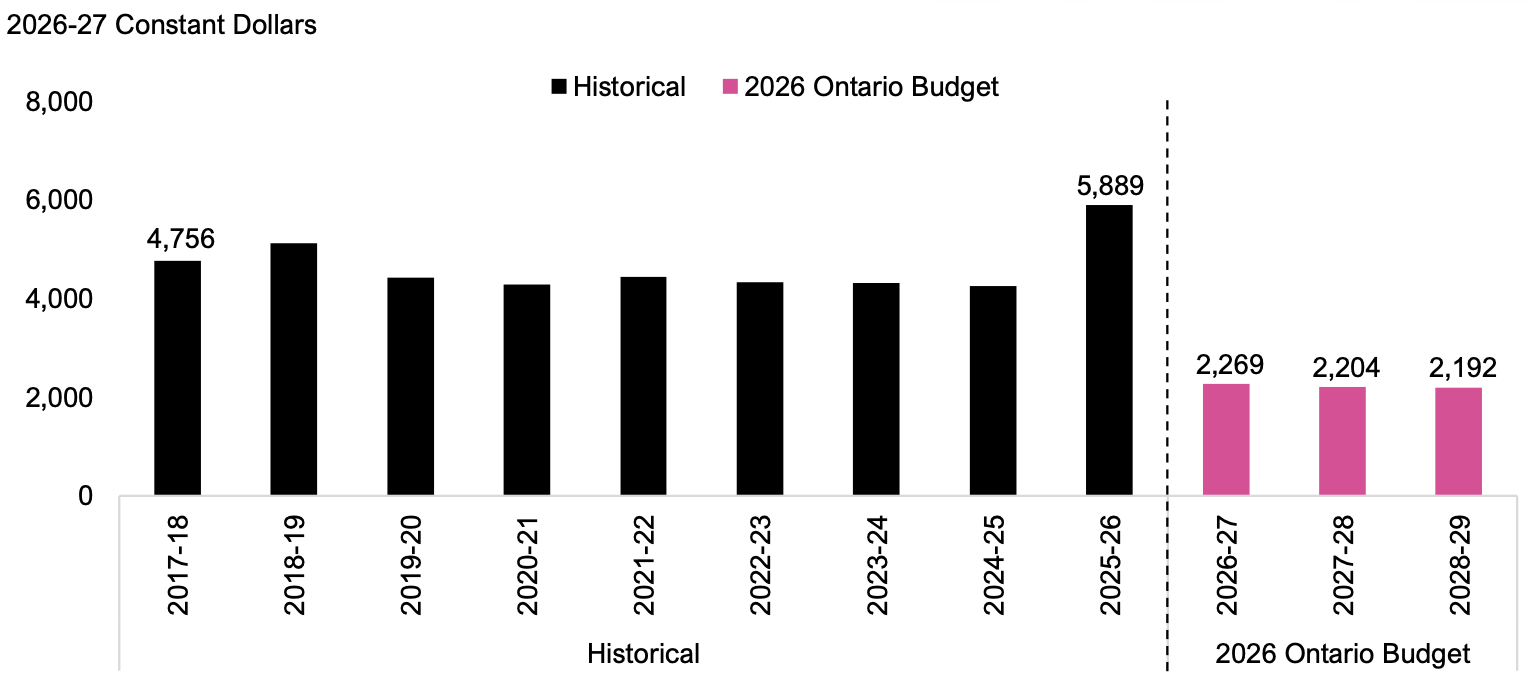
- In the 2025-26 academic year, the average OSG per recipient enrolled full-time in Ontario’s public colleges was $5,889, after adjusting for inflation. Based on the changes to OSG funding announced by the Province, the FAO estimates that the average real OSG per recipient enrolled full-time in Ontario’s public colleges will decline to $2,269 in 2026-27, $2,204 in 2027-28 and $2,192 in 2028-29.
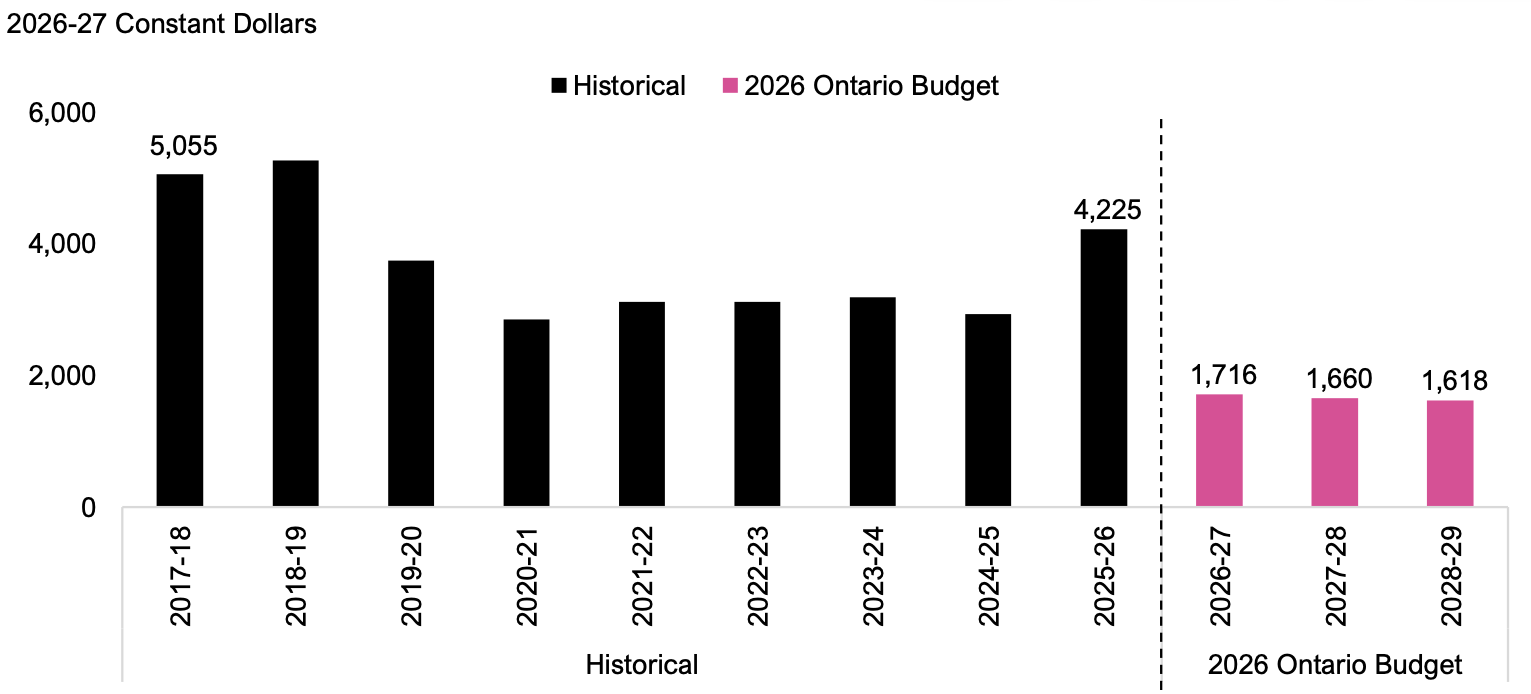
- In the 2025-26 academic year, the average OSG per recipient enrolled full-time in Ontario’s public universities was $4,225, after adjusting for inflation. Based on the changes to OSG funding announced by the Province, the FAO estimates that the average real OSG per recipient enrolled full-time in Ontario’s public universities will decline to $1,716 in 2026-27, $1,660 in 2027-28 and $1,618 in 2028-29.
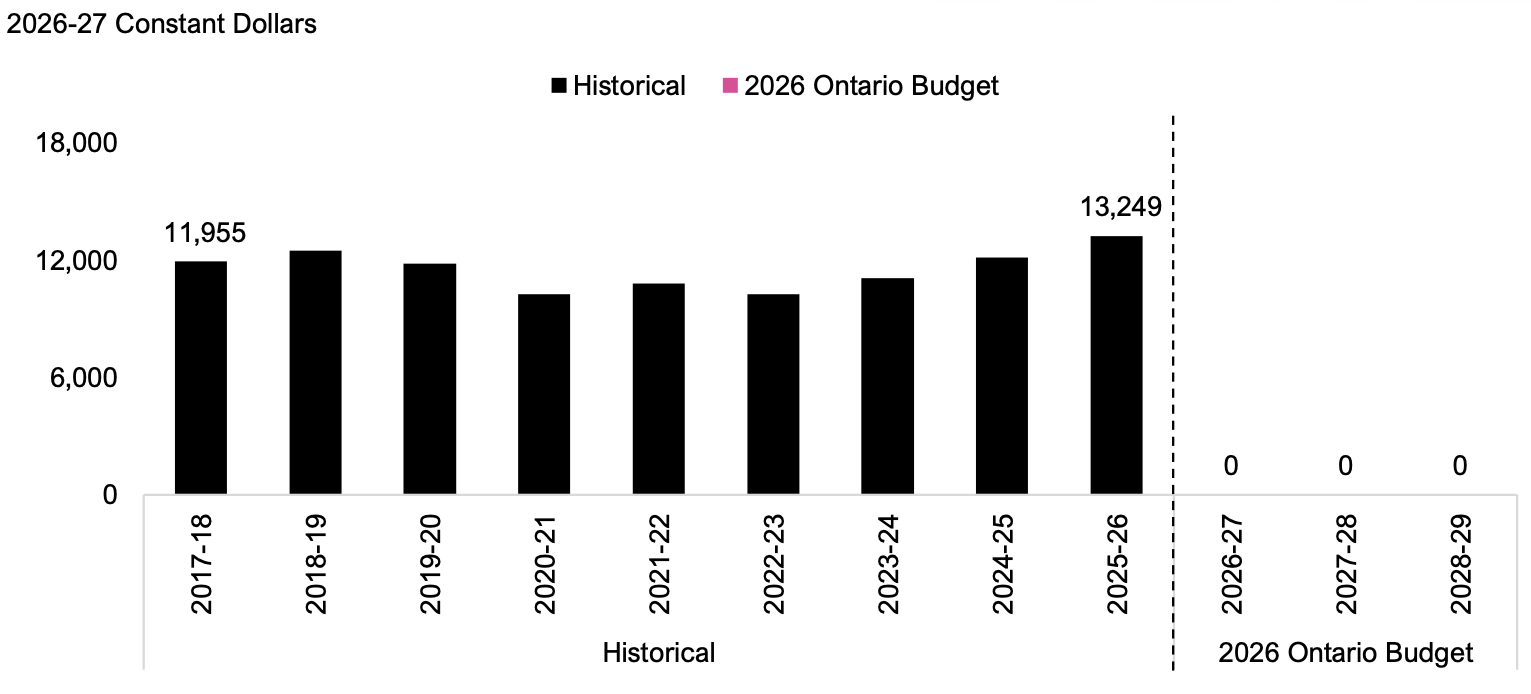
- In the 2025-26 academic year, the average OSG per recipient enrolled full-time in Ontario’s private career colleges was $13,249, after adjusting for inflation. Based on the change in OSG funding eligibility announced by the Province, the FAO estimates that the average real OSG per recipient enrolled full-time in Ontario’s private career colleges will decline to $0 starting in the 2026-27 academic year.
Interprovincial Comparison
- In 2023-24, compared to the other provinces Ontario had:
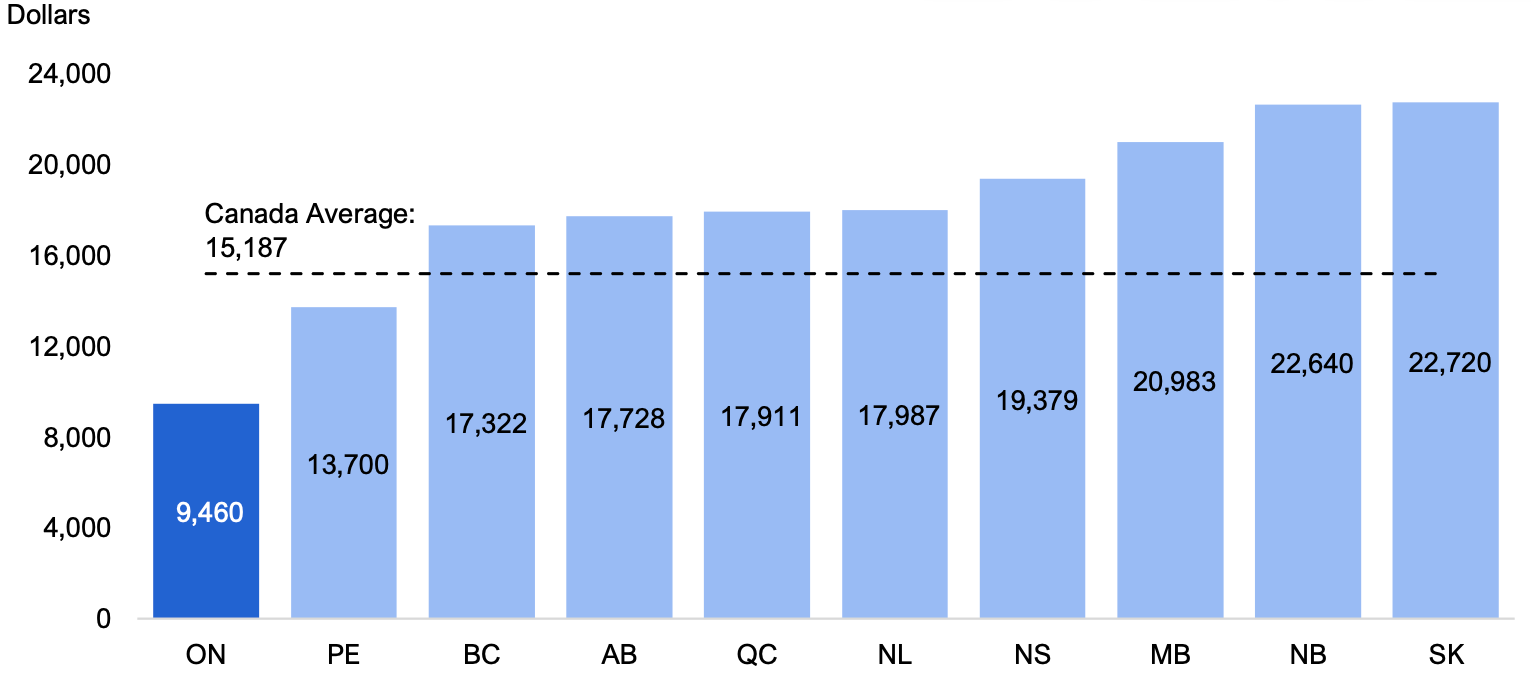
- The lowest provincial funding for public colleges per FTE domestic student, at $9,460, below the national average of $15,187.
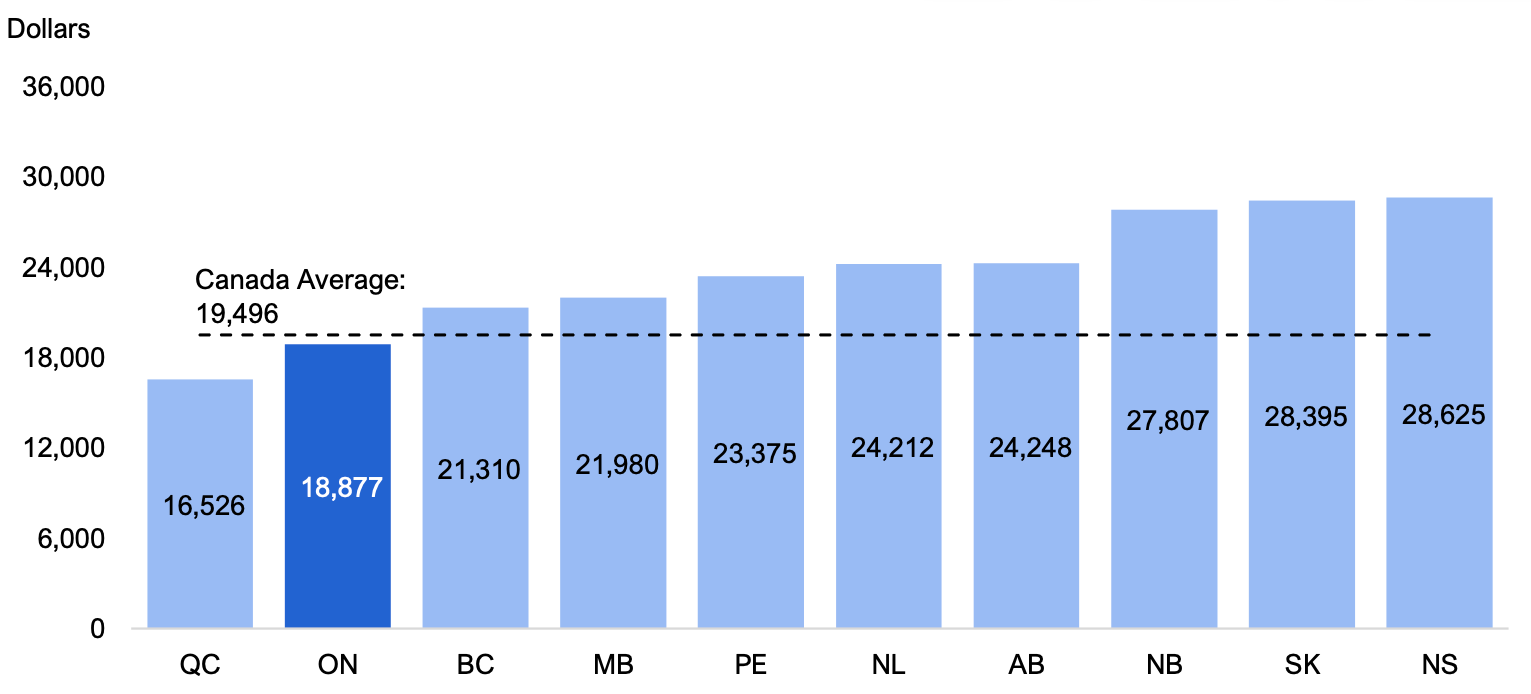
- The second lowest public colleges spending per FTE student (including domestic and international students), at $18,877, below the national average of $19,496.
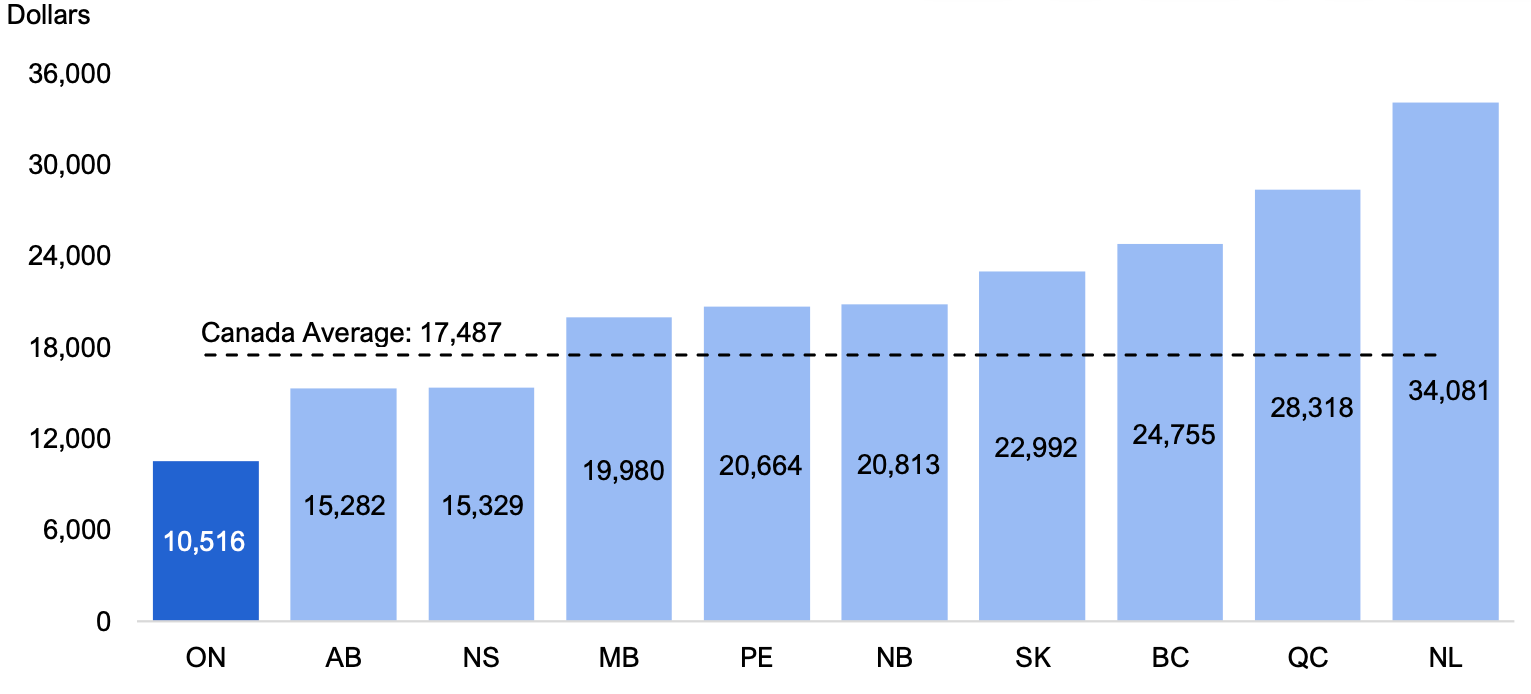
- The lowest provincial funding for universities per FTE domestic student, at $10,516, below the national average of $17,487.
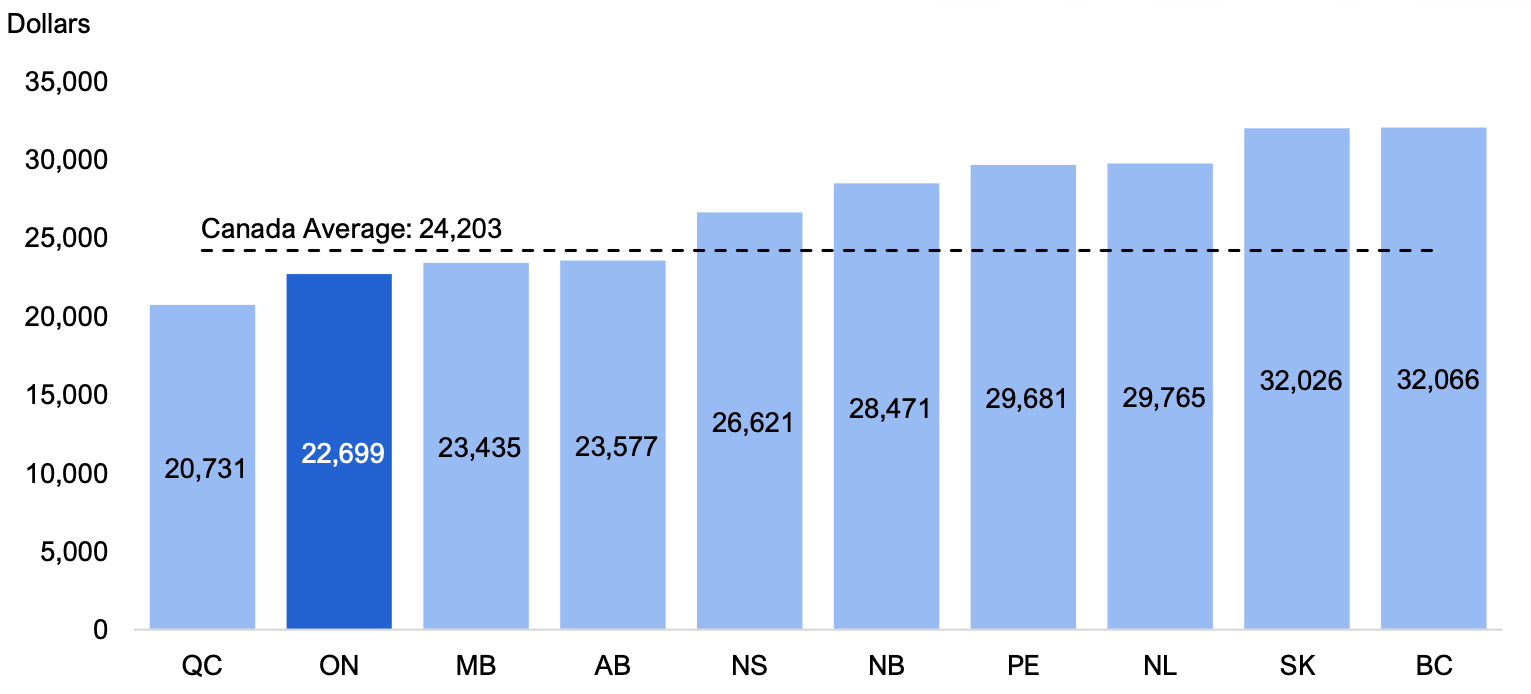
- The second lowest universities spending per FTE student (including domestic and international students), at $22,699, below the national average of $24,203.
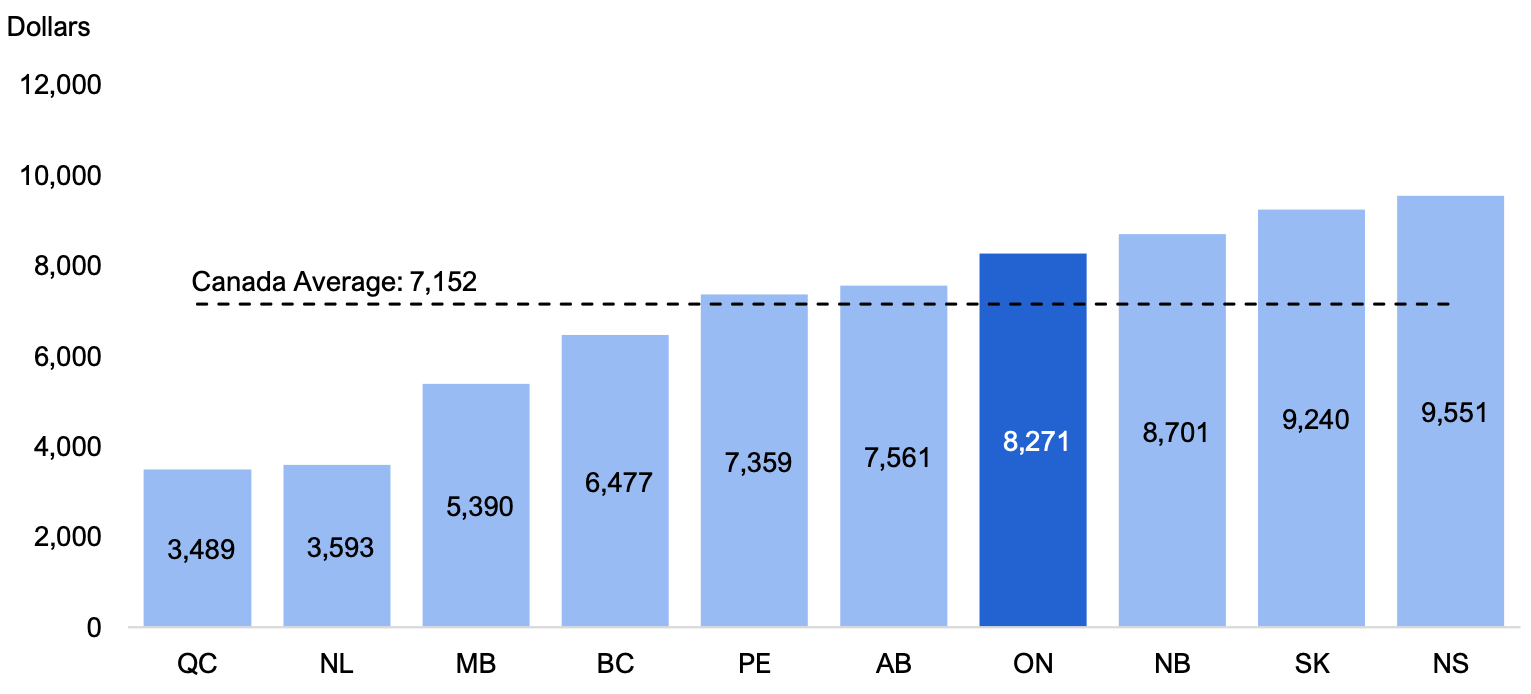
- The fourth highest average domestic tuition fees per university and college undergraduate full‑time domestic student, at $8,271, above the national average of $7,152.
2. Introduction
This report reviews the Government of Ontario’s (the Province’s) Ministry of Colleges, Universities, Research Excellence and Security (MCURES or ministry) spending plan as outlined in the 2026 Ontario Budget.
This analysis was undertaken in response to research requests from Members of Provincial Parliament and is part of a series that reviews the 2026 spending plans for five ministries: Children, Community and Social Services; Colleges, Universities, Research Excellence and Security; Education; Health; and Long-Term Care.
The report is organized as follows:
- Chapter 3 compares the Province’s MCURES spending plan in the 2026 Ontario Budget against historical ministry spending, the spending plan from the 2025 Ontario Budget, and estimated cost drivers. The cost driver analysis includes the FAO’s projection for MCURES spending required to maintain current service levels.
- Chapter 4 estimates the impact of the Province’s MCURES spending plan on select service levels.
- Chapter 5 provides an interprovincial comparison of postsecondary education funding, spending and tuition fees.
For additional information on the Ministry of Colleges, Universities, Research Excellence and Security’s spending plan, see the FAO’s 2026-27 Expenditure Estimates Dashboard, which allows users to review the ministry’s 2026-27 Expenditure Estimates to the standard account level of detail and compare 2026-27 requested spending against spending between 2021-22 and 2025-26.
3. Spending Plan Overview
In the 2026 Ontario Budget, the Province projects that MCURES spending will decline from $13.6 billion in 2025-26 to $12.7 billion in 2028-29, representing an average annual decrease of 2.2 per cent. By comparison, MCURES spending grew at an average annual rate of 5.3 per cent over the previous three years from 2022-23 to 2025-26.
Figure 3.1 Ministry of Colleges, Universities, Research Excellence and Security spending plan in the 2026 Ontario Budget
Note: Historical values are not restated for program transfers or reclassifications, if any. 2025-26 value is an FAO estimate of unaudited spending and may contain differences from the final audited spending reported in the 2025-26 Public Accounts of Ontario.
Source: Ontario Public Accounts, the 2026 Ontario Budget and FAO analysis.
Accessible version
| 2022-23 to 2025-26 Historical |
2025-26 to 2028-29 2026 Ontario Budget |
|---|---|
| 5.3 | -2.2 |
| Historical | 2026 Ontario Budget | ||
|---|---|---|---|
| Historical | 2022-23 | 11.6 | |
| Historical | 2023-24 | 13.2 | |
| Historical | 2024-25 | 14.1 | |
| Historical | 2025-26 | 13.6 | |
| 2026 Ontario Budget | 2026-27 | 14.0 | |
| 2026 Ontario Budget | 2027-28 | 12.8 | |
| 2026 Ontario Budget | 2028-29 | 12.7 |
For context, over the 36-year period from 1990-91 to 2025-26, MCURES spending grew at an average annual rate of 4.0 per cent.[2] The Province’s MCURES spending plan in the 2026 budget calls for significantly slower spending growth compared to the 36-year average and if achieved, would be the slowest three-year growth rate since 2017-18 to 2020-21.
2026 Spending Plan Compared to 2025 Spending Plan
Compared to the MCURES spending plan in the 2025 Ontario Budget, the MCURES spending plan in the 2026 Ontario Budget has increased by a total of $1.4 billion from 2025-26 to 2027-28. This includes additional spending of $0.6 billion in 2025-26 and $0.9 billion in 2026-27.
Figure 3.2 Ministry of Colleges, Universities, Research Excellence and Security spending plan in the 2025 and 2026 Ontario Budgets
Note: Historical values are not restated for program transfers or reclassifications, if any. 2025-26 historical value is an FAO estimate of unaudited spending and may contain differences from the final audited spending reported in the 2025-26 Public Accounts of Ontario.
Source: Ontario Public Accounts, 2025 Ontario Budget, 2026 Ontario Budget and FAO analysis.
Accessible version
| Historical | 2026 Ontario Budget | 2025 Ontario Budget | |
|---|---|---|---|
| 2022-23 | 11.6 | ||
| 2023-24 | 13.2 | ||
| 2024-25 | 14.1 | 14.1 | |
| 2025-26 | 13.6 | 13.6 | 13.0 |
| 2026-27 | 14.0 | 13.1 | |
| 2027-28 | 12.8 | 12.8 | |
| 2028-29 | 12.7 |
Spending Plan Compared to Cost Drivers
At the request of the Members of Provincial Parliament, the FAO estimated MCURES spending over the next three years that would be required to maintain 2025-26 service levels. Also known as a cost driver projection, this scenario does not recommend how spending should change but serves as a benchmark to show whether the 2026 budget’s MCURES spending plan is likely to maintain, improve or reduce the quality and accessibility of ministry services.
Overall, the FAO estimates that MCURES spending would need to grow by an average annual rate of 3.2 per cent over the next three years to maintain current ministry service levels. The components of the FAO’s cost driver projection vary by program area:
- Colleges: The FAO estimates that operating spending would need to grow at an average annual rate of 1.0 per cent over the next three years to maintain service levels. This estimate is based on projected college domestic and international student enrolment and postsecondary education sector inflation, which reflects the rising costs of compensation, supplies and services.
- Universities: The FAO estimates that operating funding would need to grow by an average annual rate of 5.7 per cent over the next three years to maintain service levels. This estimate is based on projected domestic university enrolment and postsecondary sector inflation, which reflects the rising costs of compensation, supplies and services.
- Student financial assistance: The FAO estimates that spending would need to grow by an average annual rate of 3.0 per cent to maintain service levels. This estimate is based on projected growth in recipients, inflation and changes in household income.
- All other ministry programs: Other programs include capital expenses, ministry operations, grants to postsecondary institutions for research and capital investments, funding for Indigenous institutions, funding for intellectual property research, and other expenses. The FAO estimates that spending would need to grow by an average annual rate of 4.2 per cent to maintain 2025-26 service levels. This estimate is largely based on enrolment or population growth, and inflation.
Figure 3.3 Comparing Ministry of Colleges, Universities, Research Excellence and Security spending growth, FAO cost driver projection vs. 2026 Ontario Budget, 2025-26 to 2028-29
Source: 2026 Ontario Budget and FAO analysis.
Accessible version
| FAO Cost Driver Projection | 2026 Ontario Budget |
|---|---|
| 3.2 | -2.2 |
As noted above, in the 2026 budget, the Province projects that MCURES spending will decrease at an average annual rate of 2.2 per cent from 2025-26 to 2028-29. Compared to the FAO’s cost driver projection, this results in excess funding of $0.1 billion in 2026-27 and funding shortfalls of $1.7 billion in 2027-28 and $2.2 billion in 2028‑29.
Figure 3.4 Comparing Ministry of Colleges, Universities, Research Excellence and Security spending projections, FAO cost driver projection vs. 2026 Ontario Budget
Note: Historical values are not restated for program transfers or reclassifications, if any. 2025-26 historical value is an FAO estimate of unaudited spending and may contain differences from the final audited spending reported in the 2025-26 Public Accounts of Ontario.
Source: Ontario Public Accounts, 2026 Ontario Budget and FAO analysis.
Accessible version
| Historical | 2026 Ontario Budget | FAO Cost Driver Projection | ||
|---|---|---|---|---|
| Historical | 2022-23 | 11.6 | ||
| Historical | 2023-24 | 13.2 | ||
| Historical | 2024-25 | 14.1 | ||
| Historical | 2025-26 | 13.6 | 13.6 | 13.6 |
| Projection | 2026-27 | 14.0 | 13.9 | |
| Projection | 2027-28 | 12.8 | 14.4 | |
| Projection | 2028-29 | 12.7 | 14.9 |
The funding shortfall starting in 2027-28 means that, to maintain current service levels, the Province will need to implement program efficiencies (i.e., provide the same level of services with less resources) and/or commit additional funding beyond what was planned in the 2026 Ontario Budget.
4. Spending Plan Analysis
At the request of the Members of Provincial Parliament, this chapter reviews the FAO’s estimate of the impact of the Ministry of Colleges, Universities, Research Excellence and Security (MCURES) spending plan in the 2026 budget on select service level indicators, including inflation-adjusted funding per-domestic student to public colleges and universities, Ontario Student Grant recipients as a share of Ontario-resident postsecondary students and the average inflation-adjusted Ontario Student Grant per recipient.
Provincial Operating Funding to Public Colleges
MCURES provides funding to Ontario’s 24 public colleges to support domestic students. In 2025-26, the FAO estimates that the ministry provided $7,768 in operating funding per full-time equivalent (FTE) domestic student, on an inflation-adjusted basis (i.e., in real 2026-27 dollars). Based on the MCURES spending plan in the 2026 budget, the FAO estimates that real ministry funding will increase to $10,195 per FTE domestic student in 2026-27, and then decline to $9,840 in 2027-28 and $9,571 in 2028-29.
Figure 4.1 Provincial operating funding to public colleges per FTE domestic student, inflation-adjusted, 2016-17 to 2028-29
Source: Ontario Public Accounts, 2026 Ontario Budget and FAO analysis of information provided by the Province.
Accessible version
| Historical | 2026 Ontario Budget | ||
|---|---|---|---|
| Historical | 2016-17 | 9,050 | |
| Historical | 2017-18 | 9,006 | |
| Historical | 2018-19 | 9,375 | |
| Historical | 2019-20 | 8,514 | |
| Historical | 2020-21 | 9,388 | |
| Historical | 2021-22 | 8,649 | |
| Historical | 2022-23 | 8,638 | |
| Historical | 2023-24 | 7,625 | |
| Historical | 2024-25 | 7,720 | |
| Historical | 2025-26 | 7,768 | |
| 2026 Ontario Budget | 2026-27 | 10,195 | |
| 2026 Ontario Budget | 2027-28 | 9,840 | |
| 2026 Ontario Budget | 2028-29 | 9,571 |
Provincial Operating Funding to Universities
MCURES provides funding to the province’s 23 public universities to support domestic students. Ministry operating funding to universities was $9,310 per FTE domestic student in 2025-26, on an inflation-adjusted basis (i.e., in real 2026-27 dollars). Based on the MCURES spending plan in the 2026 budget, the FAO estimates that real ministry operating funding to universities per FTE domestic student will increase to $10,356 in 2026-27, and then decline to $9,689 in 2027-28 and $9,462 in 2028-29.
Figure 4.2 Provincial operating funding to public universities per FTE domestic student, inflation-adjusted, 2016-17 to 2028-29
Source: Ontario Public Accounts, 2026 Ontario Budget and FAO analysis of information provided by the Province.
Accessible version
| Historical | 2026 Ontario Budget | ||
|---|---|---|---|
| Historical | 2016-17 | 11,286 | |
| Historical | 2017-18 | 11,277 | |
| Historical | 2018-19 | 11,108 | |
| Historical | 2019-20 | 11,107 | |
| Historical | 2020-21 | 10,335 | |
| Historical | 2021-22 | 9,875 | |
| Historical | 2022-23 | 9,586 | |
| Historical | 2023-24 | 9,373 | |
| Historical | 2024-25 | 9,085 | |
| Historical | 2025-26 | 9,310 | |
| 2026 Ontario Budget | 2026-27 | 10,356 | |
| 2026 Ontario Budget | 2027-28 | 9,689 | |
| 2026 Ontario Budget | 2028-29 | 9,462 |
Student Financial Assistance Programs
The ministry’s student financial assistance programs are comprised of loans, grants, scholarships and repayment assistance. Of the grants available to postsecondary students, the Ontario Student Grant (OSG) forms the largest share at 91.7 per cent in 2025-26. The OSG is an income-tested, needs-based grant available to all postsecondary students who are residents of Ontario[3] taking an eligible course load in an approved program. Other grants such as disability grants and the Ontario Learn and Stay Grant are available to students with more targeted eligibility.
Beginning in the 2026-27 academic year, the Province implemented changes to student financial assistance programs, including reducing the amount of funding that students enrolled in public colleges and universities may be eligible to receive as provincial grants, and eliminating provincial grants for students enrolled in private career colleges.[4]
Ontario Student Grant Recipients as a Share of Ontario-resident Postsecondary Students
In the 2025-26 academic year, the FAO estimates that 59.0 per cent of Ontario-resident postsecondary students received the OSG. Based on the change in OSG funding eligibility announced by the Province, the FAO estimates that the share of Ontario-resident postsecondary students who will receive the OSG will decrease to 37.3 per cent in 2026-27, 36.4 per cent in 2027-28 and 35.8 per cent in 2028-29.
Figure 4.3 Share of Ontario-resident postsecondary students who receive the Ontario Student Grant, 2017-18 to 2028-29 academic years
Note: Other includes Ontario-resident students attending a postsecondary institution outside of Ontario.
Source: 2026 Ontario Budget, and FAO analysis of information provided by the Province and custom tabulation from Statistics Canada’s Postsecondary Student Information System (PSIS).
Accessible version
| Public Colleges | Universities | Private Career Colleges | Other | Total | ||
|---|---|---|---|---|---|---|
| Historical | 2017-18 | 23.8 | 38.0 | 2.9 | 2.0 | 66.7 |
| Historical | 2018-19 | 25.8 | 40.9 | 3.6 | 2.3 | 72.6 |
| Historical | 2019-20 | 17.4 | 24.1 | 3.2 | 1.6 | 46.3 |
| Historical | 2020-21 | 11.8 | 17.3 | 3.6 | 1.2 | 33.9 |
| Historical | 2021-22 | 12.4 | 19.6 | 4.1 | 1.3 | 37.4 |
| Historical | 2022-23 | 12.4 | 20.3 | 5.7 | 1.4 | 39.8 |
| Historical | 2023-24 | 14.8 | 21.2 | 9.1 | 1.4 | 46.6 |
| Historical | 2024-25 | 15.4 | 20.6 | 13.9 | 1.4 | 51.4 |
| Historical | 2025-26 | 16.9 | 21.7 | 18.8 | 1.6 | 59.0 |
| 2026 Ontario Budget | 2026-27 | 16.1 | 19.6 | – | 1.6 | 37.3 |
| 2026 Ontario Budget | 2027-28 | 15.7 | 19.1 | – | 1.6 | 36.4 |
| 2026 Ontario Budget | 2028-29 | 15.5 | 18.8 | – | 1.5 | 35.8 |
Average Ontario Student Grant Per Recipient Enrolled Full-time in Public Colleges
In the 2025-26 academic year, the average OSG per recipient enrolled full-time in Ontario’s public colleges was $5,889, after adjusting for inflation (i.e., real 2026-27 dollars).[5] Based on the changes to OSG funding announced by the Province, the FAO estimates that the average real OSG per recipient enrolled full-time in Ontario’s public colleges will decline to $2,269 in 2026-27, $2,204 in 2027-28 and $2,192 in 2028-29.
Figure 4.4 Average Ontario Student Grant per recipient enrolled full-time in Ontario’s public colleges, inflation‑adjusted, 2017-18 to 2028-29 academic years
Note: Historical data is based on information provided by MCURES. 2025-26 value is based on preliminary information as of September 9, 2026 and is subject to change once academic year-end data is finalized.
Source: 2026 Ontario Budget and FAO analysis of information provided by the Province.
Accessible version
| Historical | 2026 Ontario Budget | ||
|---|---|---|---|
| Historical | 2017-18 | 4,756 | |
| Historical | 2018-19 | 5,116 | |
| Historical | 2019-20 | 4,428 | |
| Historical | 2020-21 | 4,279 | |
| Historical | 2021-22 | 4,443 | |
| Historical | 2022-23 | 4,326 | |
| Historical | 2023-24 | 4,314 | |
| Historical | 2024-25 | 4,259 | |
| Historical | 2025-26 | 5,889 | |
| 2026 Ontario Budget | 2026-27 | 2,269 | |
| 2026 Ontario Budget | 2027-28 | 2,204 | |
| 2026 Ontario Budget | 2028-29 | 2,192 |
Average Ontario Student Grant Per Recipient Enrolled Full-time in Universities
In the 2025-26 academic year, the average OSG per recipient enrolled full-time in Ontario’s public universities was $4,225, after adjusting for inflation (i.e., real 2026-27 dollars).[6] Based on the changes to OSG funding announced by the Province, the FAO estimates that the average real OSG per recipient enrolled full-time in Ontario’s public universities will decline to $1,716 in 2026-27, $1,660 in 2027-28 and $1,618 in 2028-29.
Figure 4.5 Average Ontario Student Grant per recipient enrolled full-time in Ontario’s public universities, inflation‑adjusted, 2017-18 to 2028-29 academic years
Note: Historical data is based on information provided by MCURES. 2025-26 value is based on preliminary information as of September 9, 2026 and is subject to change once academic year-end data is finalized.
Source: 2026 Ontario Budget and FAO analysis of information provided by the Province.
Accessible version
| Historical | 2026 Ontario Budget | ||
|---|---|---|---|
| Historical | 2017-18 | 5,055 | |
| Historical | 2018-19 | 5,273 | |
| Historical | 2019-20 | 3,747 | |
| Historical | 2020-21 | 2,850 | |
| Historical | 2021-22 | 3,120 | |
| Historical | 2022-23 | 3,122 | |
| Historical | 2023-24 | 3,190 | |
| Historical | 2024-25 | 2,931 | |
| Historical | 2025-26 | 4,225 | |
| 2026 Ontario Budget | 2026-27 | 1,716 | |
| 2026 Ontario Budget | 2027-28 | 1,660 | |
| 2026 Ontario Budget | 2028-29 | 1,618 |
Average Ontario Student Grant Per Recipient Enrolled Full-time in Private Career Colleges
In the 2025-26 academic year, the average OSG per recipient enrolled full-time in Ontario’s private career colleges was $13,249, after adjusting for inflation (i.e., real 2026-27 dollars).[7] Based on the change in OSG funding eligibility announced by the Province, the FAO estimates that the average real OSG per recipient enrolled full-time in Ontario’s private career colleges will decline to $0 starting in the 2026-27 academic year.
Figure 4.6 Average Ontario Student Grant per recipient enrolled full-time in Ontario’s private career colleges, inflation adjusted, 2017-18 to 2028-29 academic years
Note: Historical data is based on information provided by MCURES. 2025-26 value is based on preliminary information as of September 9, 2026 and is subject to change once academic year-end data is finalized.
Source: 2026 Ontario Budget and FAO analysis of information provided by the Province.
Accessible version
| Historical | 2026 Ontario Budget | ||
|---|---|---|---|
| Historical | 2017-18 | 11,955 | |
| Historical | 2018-19 | 12,492 | |
| Historical | 2019-20 | 11,820 | |
| Historical | 2020-21 | 10,277 | |
| Historical | 2021-22 | 10,809 | |
| Historical | 2022-23 | 10,251 | |
| Historical | 2023-24 | 11,071 | |
| Historical | 2024-25 | 12,143 | |
| Historical | 2025-26 | 13,249 | |
| 2026 Ontario Budget | 2026-27 | – | |
| 2026 Ontario Budget | 2027-28 | – | |
| 2026 Ontario Budget | 2028-29 | – |
5. Interprovincial Comparison
At the request of the Members of Provincial Parliament, this chapter compares provincial funding to colleges and universities with funding in other provinces. It also compares colleges and universities spending and average domestic tuition fees across provinces.
Public Colleges
Provincial Funding to Public Colleges
In 2023-24, Ontario had the lowest provincial funding for public colleges per full-time equivalent (FTE) domestic student, at $9,460, which was $5,727 below the national average of $15,187. Compared to other large provinces, Ontario’s per FTE domestic student colleges funding was lower than in British Columbia ($17,322), Alberta ($17,728) and Quebec ($17,911).
Figure 5.1 Provincial funding to public colleges per FTE domestic student, by province, 2023-24
Note: The FAO estimates full-time equivalent college enrolment as full-time enrolment, plus part-time enrolment divided by 2.0. Canada average does not include territories. Quebec college funding includes direct subsidies to lower “in province” domestic student tuition fees.
Source: Statistics Canada, “Revenues of colleges by type of revenues and funds”, Table: 37-10-0028-01 and “Postsecondary enrolments, by registration status, institution type, status of student in Canada and gender”, Table: 37-10-0018-01.
Accessible version
| Province | Funding per FTE Domestic Student |
|---|---|
| ON | 9,460 |
| PE | 13,700 |
| BC | 17,322 |
| AB | 17,728 |
| QC | 17,911 |
| NL | 17,987 |
| NS | 19,379 |
| MB | 20,983 |
| NB | 22,640 |
| SK | 22,720 |
| Canada Average | 15,187 |
Public Colleges Spending
In 2023-24, Ontario had the second lowest public colleges spending per FTE student (including domestic and international students), at $18,877, which was $619 below the national average of $19,496. Compared to other large provinces, Ontario’s colleges spending per FTE student was higher than in Quebec ($16,526) but lower than in British Columbia ($21,310) and Alberta ($24,248).
Figure 5.2 Public colleges spending per FTE student, by province, 2023-24
Note: The FAO estimates full-time equivalent college enrolment as full-time enrolment, plus part-time enrolment divided by 2.0. Canada average does not include territories.
Source: Statistics Canada, “Canadian Classification of Functions of Government (CCOFOG) by consolidated government component”, Table: 10-10-0005-01 and “Postsecondary enrolments, by registration status, institution type, status of student in Canada and gender”, Table: 37-10-0018-01.
Accessible version
| Province | Spending per FTE Student |
|---|---|
| QC | 16,526 |
| ON | 18,877 |
| BC | 21,310 |
| MB | 21,980 |
| PE | 23,375 |
| NL | 24,212 |
| AB | 24,248 |
| NB | 27,807 |
| SK | 28,395 |
| NS | 28,625 |
| Canada Average | 19,496 |
Universities
Provincial Funding to Universities
In 2023-24, Ontario had the lowest provincial funding for universities per FTE domestic student, at $10,516, which was $6,971 below the national average of $17,487. Compared to other large provinces, Ontario’s universities funding per FTE domestic student was lower than in Alberta ($15,282), British Columbia ($24,755) and Quebec ($28,318).
Figure 5.3 Provincial funding to universities per FTE domestic student, by province, 2023-24
Note: The FAO estimates full-time equivalent university enrolment as full-time enrolment, plus part-time enrolment divided by 3.8. Canada average does not include territories. Quebec and Nova Scotia university funding includes direct subsidies to lower “in province” domestic student tuition fees.
Source: Statistics Canada, “Revenues of universities by type of revenues and funds”, Table: 37-10-0026-01 and “Postsecondary enrolments, by registration status, institution type, status of student in Canada and gender”, Table: 37-10-0018-01.
Accessible version
| Province | Funding per FTE Domestic Student |
|---|---|
| ON | 10,516 |
| AB | 15,282 |
| NS | 15,329 |
| MB | 19,980 |
| PE | 20,664 |
| NB | 20,813 |
| SK | 22,992 |
| BC | 24,755 |
| QC | 28,318 |
| NL | 34,081 |
| Canada Average | 17,487 |
Universities Spending
In 2023-24, Ontario had the second lowest universities spending per FTE student (including domestic and international students), at $22,699, which was $1,504 below the national average of $24,203. Compared to other large provinces, Ontario’s universities spending per FTE student was higher than in Quebec ($20,731) but lower than in Alberta ($23,577) and British Columbia ($32,066).
Figure 5.4 Universities spending per FTE student, by province, 2023-24
Note: The FAO estimates full-time equivalent university enrolment as full-time enrolment, plus part-time enrolment divided by 3.8. Canada average does not include territories.
Source: Statistics Canada, “Canadian Classification of Functions of Government (CCOFOG) by consolidated government component”, Table: 10-10-0005-01 and “Postsecondary enrolments, by registration status, institution type, status of student in Canada and gender”, Table: 37-10-0018-01.
Accessible version
| Province | Spending per FTE Student |
|---|---|
| QC | 20,731 |
| ON | 22,699 |
| MB | 23,435 |
| AB | 23,577 |
| NS | 26,621 |
| NB | 28,471 |
| PE | 29,681 |
| NL | 29,765 |
| SK | 32,026 |
| BC | 32,066 |
| Canada Average | 24,203 |
Domestic Tuition Fees
In 2023-24, Ontario had the fourth highest average domestic tuition per university and college undergraduate full-time domestic student, at $8,271, which was $1,119 above the national average of $7,152. Compared to other large provinces, Ontario’s full-time domestic tuition fees were higher than in Quebec ($3,489), British Columbia ($6,477) and Alberta ($7,561).
Figure 5.5 Average tuition for undergraduate full-time domestic students in public postsecondary education programs, by province, 2023-24
Note: Canada average excludes all territories except Yukon. Quebec, Nova Scotia, and Newfoundland and Labrador average tuition accounts for different fees paid by "in province" and "out of province" Canadian students. Quebec average excludes tuition fees for students enrolled in CEGEP.
Source: Statistics Canada, “Canadian undergraduate tuition fees by field of study”, Table: 37-10-0003-01.
Accessible version
| Province | Average Fees per Undergraduate Full-time Domestic Student |
|---|---|
| QC | 3,489 |
| NL | 3,593 |
| MB | 5,390 |
| BC | 6,477 |
| PE | 7,359 |
| AB | 7,561 |
| ON | 8,271 |
| NB | 8,701 |
| SK | 9,240 |
| NS | 9,551 |
| Canada Average | 7,152 |
Footnotes
[1] The OSG is an income-tested, needs-based grant available to all postsecondary students who are residents of Ontario taking an eligible course load in an approved program.
[2] FAO, Government Spending Trends: 1990 to 2023 and FAO calculations.
[3] Residents are postsecondary students who are Canadian citizens, permanent residents or protected persons where Ontario is the most recent province in which they have resided for 12 consecutive months, not including any time as a full-time postsecondary student.
[4] Beginning in the 2026-27 school year, the Ontario Student Assistance Program (OSAP) funding composition was altered so that the maximum funding students will be eligible to receive as grants will decrease from 85 per cent to 25 per cent, with the remainder provided as loans. In addition, students at private career colleges will no longer be eligible for OSAP grants. Government of Ontario, Ontario Investing $6.4 Billion to Support Postsecondary Sector’s Long-Term Success and Sustainability, February 12, 2026.
[5] Based on preliminary information provided by MCURES as of September 9, 2026 and is subject to change once academic year-end data is finalized.
[6] Based on preliminary information provided by MCURES as of September 9, 2026 and is subject to change once academic year-end data is finalized.
[7] Based on preliminary information provided by MCURES as of September 9, 2026 and is subject to change once academic year-end data is finalized.