


Assessing Ontario’s Fiscal Sustainability: 2021-2050
1 | Summary
The Long-Term Budget Outlook provides the FAO’s projection of the government’s fiscal position over the 2021-22 to 2050-51 period. The report provides an assessment of Ontario’s long-term fiscal sustainability based on the analysis of four key budget indicators. This is followed by a discussion of the factors that will affect the government’s program expenditures and revenue performance over the next three decades. Finally, details on the FAO’s economic projection are provided, including analysis of the underlying demographic trends over the projection period.
Overall, the FAO expects Ontario’s finances will be manageable as its fiscal position improves over the 2020s. However, the government’s fiscal flexibility will be constrained over the longer term as ongoing health care expenditures boost program spending growth above revenue gains.
Lower deficits result in stable finances in the 2020s
- Ontario’s deficits are expected to improve in the 2020s as the province recovers from the COVID-19 pandemic and the economy rebounds strongly. As a result, the government’s budget balance as a share of nominal GDP is projected to remain stable over this period.
- The net debt-to-GDP ratio is projected to decline from its current level of 41 per cent in 2021-22 to 35 per cent by the early 2030s. Interest on debt as a share of revenue, a measure of budget flexibility, is projected to decline slightly before returning to its current rate of 7.3 per cent by the end of 2020s.
- In the 2021 Ontario Budget[1] the government stated its fiscal sustainability objectives. The medium-term (2021-22 to 2023-24) objective is to keep the net debt-to-GDP ratio below 50.5 per cent and to slow the rate of increase of interest on debt as a share of revenue. The FAO projects that the government will meet these objectives by 2023-24.
Ontario’s finances begin to deteriorate over the long term as growth in program spending and interest expense outpace revenue gains
- During the 2030s and 2040s, the FAO projects a steady deterioration in Ontario’s budget balance, reflecting faster growth in program spending and interest payments compared to revenues. Ontario is not projected to balance its budget over the long term. By 2050-51, the deficit widens to -1.6 per cent of GDP, similar to the rate recorded during the pandemic.
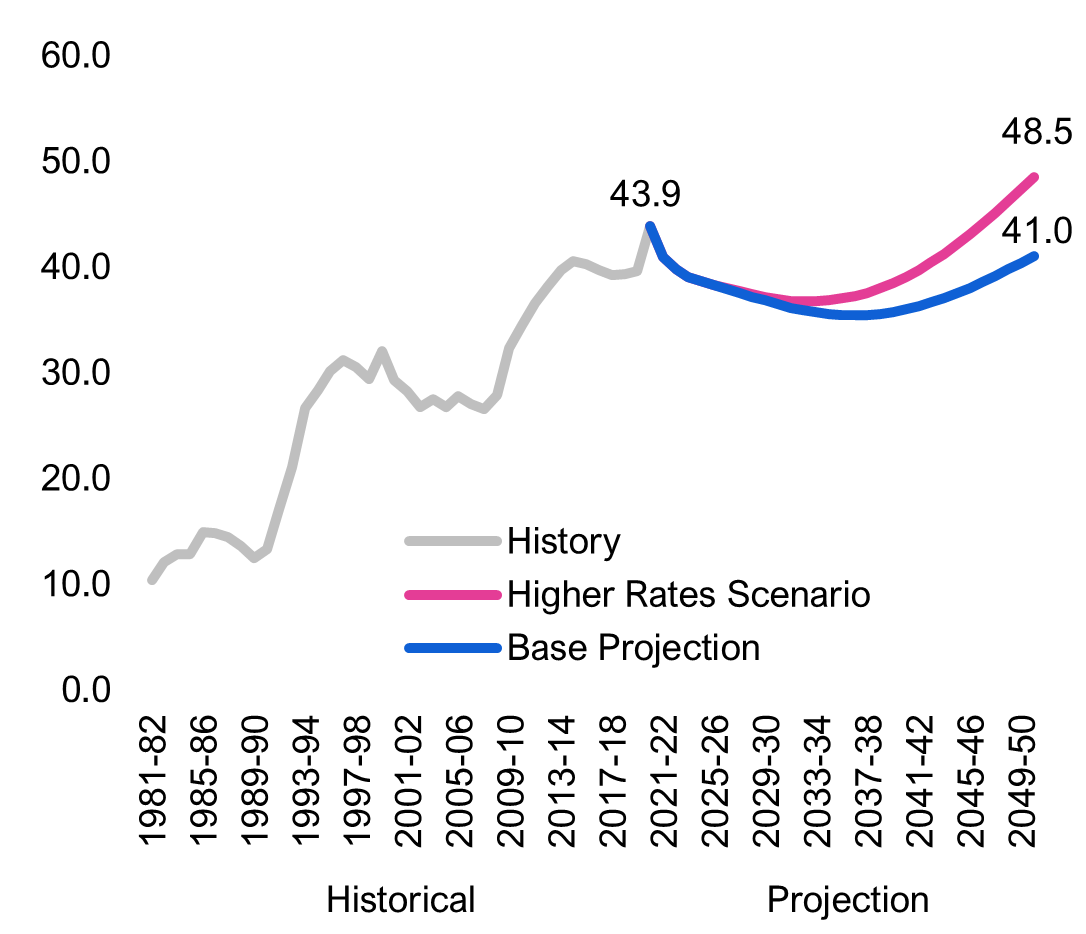
- Rising budget deficits are projected to increase Ontario’s debt burden, with the net debt-to-GDP ratio increasing steadily to 41 per cent in 2050-51, close to its current share.
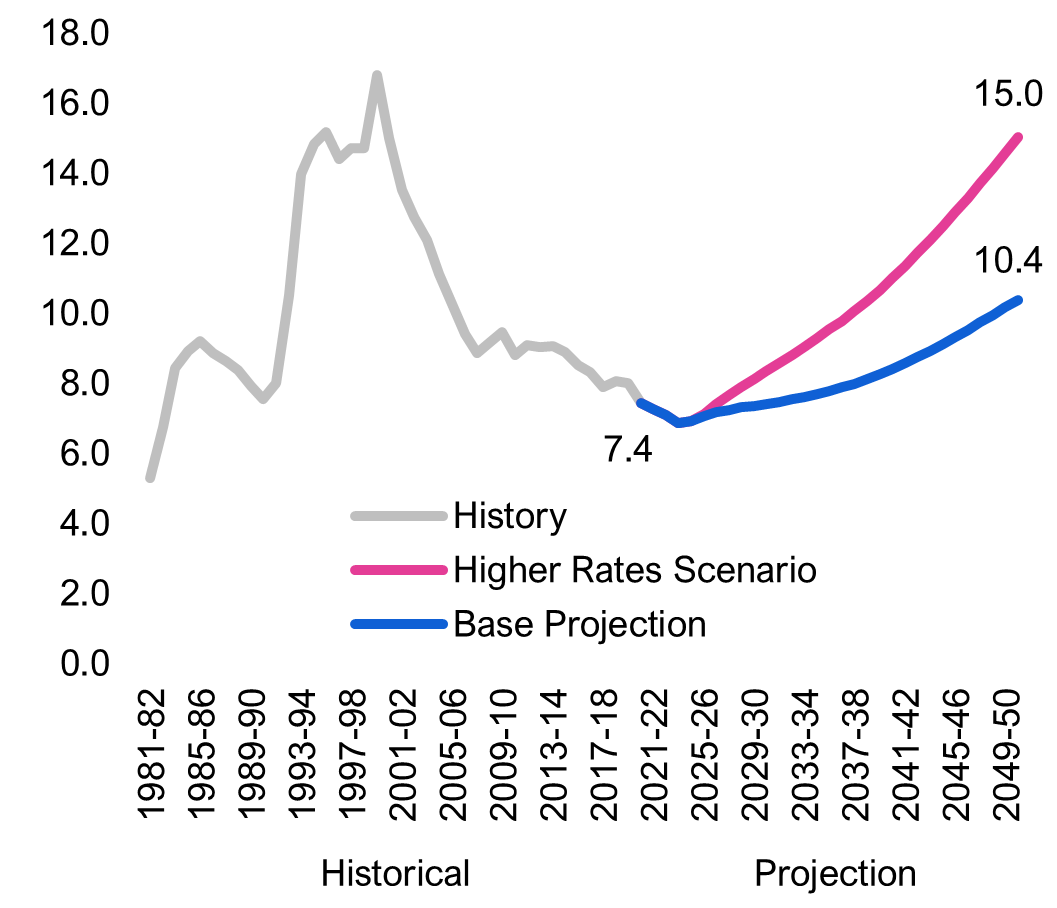
- As interest rates rise and the government faces higher borrowing, Ontario’s interest on debt as a share of revenue is projected to increase at a steady rate, reaching 10.4 per cent by 2050-51, well above the 7.4 per cent recorded during the pandemic. This would reduce the government’s budget flexibility as a smaller share of revenue would be available to fund program spending.
Ontario’s fiscal sustainability is vulnerable to risks
- In addition to the lingering effects of the pandemic, Ontario’s long-term economic outlook faces risks, including the impacts of climate change, elevated income inequality and the evolving nature of the labour market with rising non-standard employment.
- Ontario’s fiscal projection also faces risks, including potential changes to government revenue or spending policy, upward pressures on capital expenditures, and the outlook for interest rates.
- For example, higher-than-projected interest rates would increase the fiscal vulnerability of the province. If government borrowing rates are 100 basis points higher than expected by the mid-2020s, Ontario’s net debt-to-GDP ratio would climb to a record 48.5 per cent by 2050, roughly eight percentage points above the 41 per cent projected in the base case. Interest on debt as a share of revenue would reach 15 per cent by 2050, well above the 10.4 per cent projected in the base case.
2 | Fiscal Sustainability
Over the next 30 years, demographic changes will contribute to significant fiscal challenges for Ontario. Slower labour force growth will result in more moderate economic growth, leading to slower revenue gains. The aging baby boom cohort will continue to put pressure on Ontario’s health care system. Given these trends, persistent and rising budget deficits are projected to cause a steady increase in Ontario’s debt burden over the long term, prompting concerns about the province’s fiscal sustainability.
While fiscal sustainability can be measured in a variety of ways, there is no universally accepted definition or evaluation criteria.[2] However, there are a few common elements in the definitions used by various organizations[3] that underpin the concept of fiscal sustainability.
Most definitions broadly focus on a government’s continuous credibility and ability to service debt obligations, while delivering on promised fiscal commitments such as health care spending. Other definitions of fiscal sustainability more narrowly consider key measures such as a declining or stable net debt-to-GDP ratio.
While excessive debt and deficits can present challenges to long-term fiscal sustainability, no agreement exists on what amounts are excessive, or how long governments should take to achieve fiscal goals like balancing the budget or lowering the net debt-to-GDP ratio.
To assess Ontario’s fiscal sustainability over the long term, the FAO evaluated the projected trends in four of the most common fiscal indicators. These include the primary balance, budget balance, the net debt-to-GDP ratio, and interest on debt as a share of revenue. Significant and prolonged deterioration in these indicators over time could raise concerns about the government’s ability to deliver on its budgetary commitments.
Overall, the FAO projects that Ontario’s finances will remain largely manageable over the long term although fiscal flexibility will be constrained. The FAO projects that all four fiscal indicators will improve in the 2020s. However, in the 2030s and beyond, growth in program spending and interest payments will outpace revenue gains, increasing pressure on the province’s finances. By 2050-51, growing deficits will raise the debt burden to near its high point during the pandemic while interest expense as a share of revenue will climb above its historical average.
The section below provides a detailed description and analysis of the fiscal indicators that the FAO used.
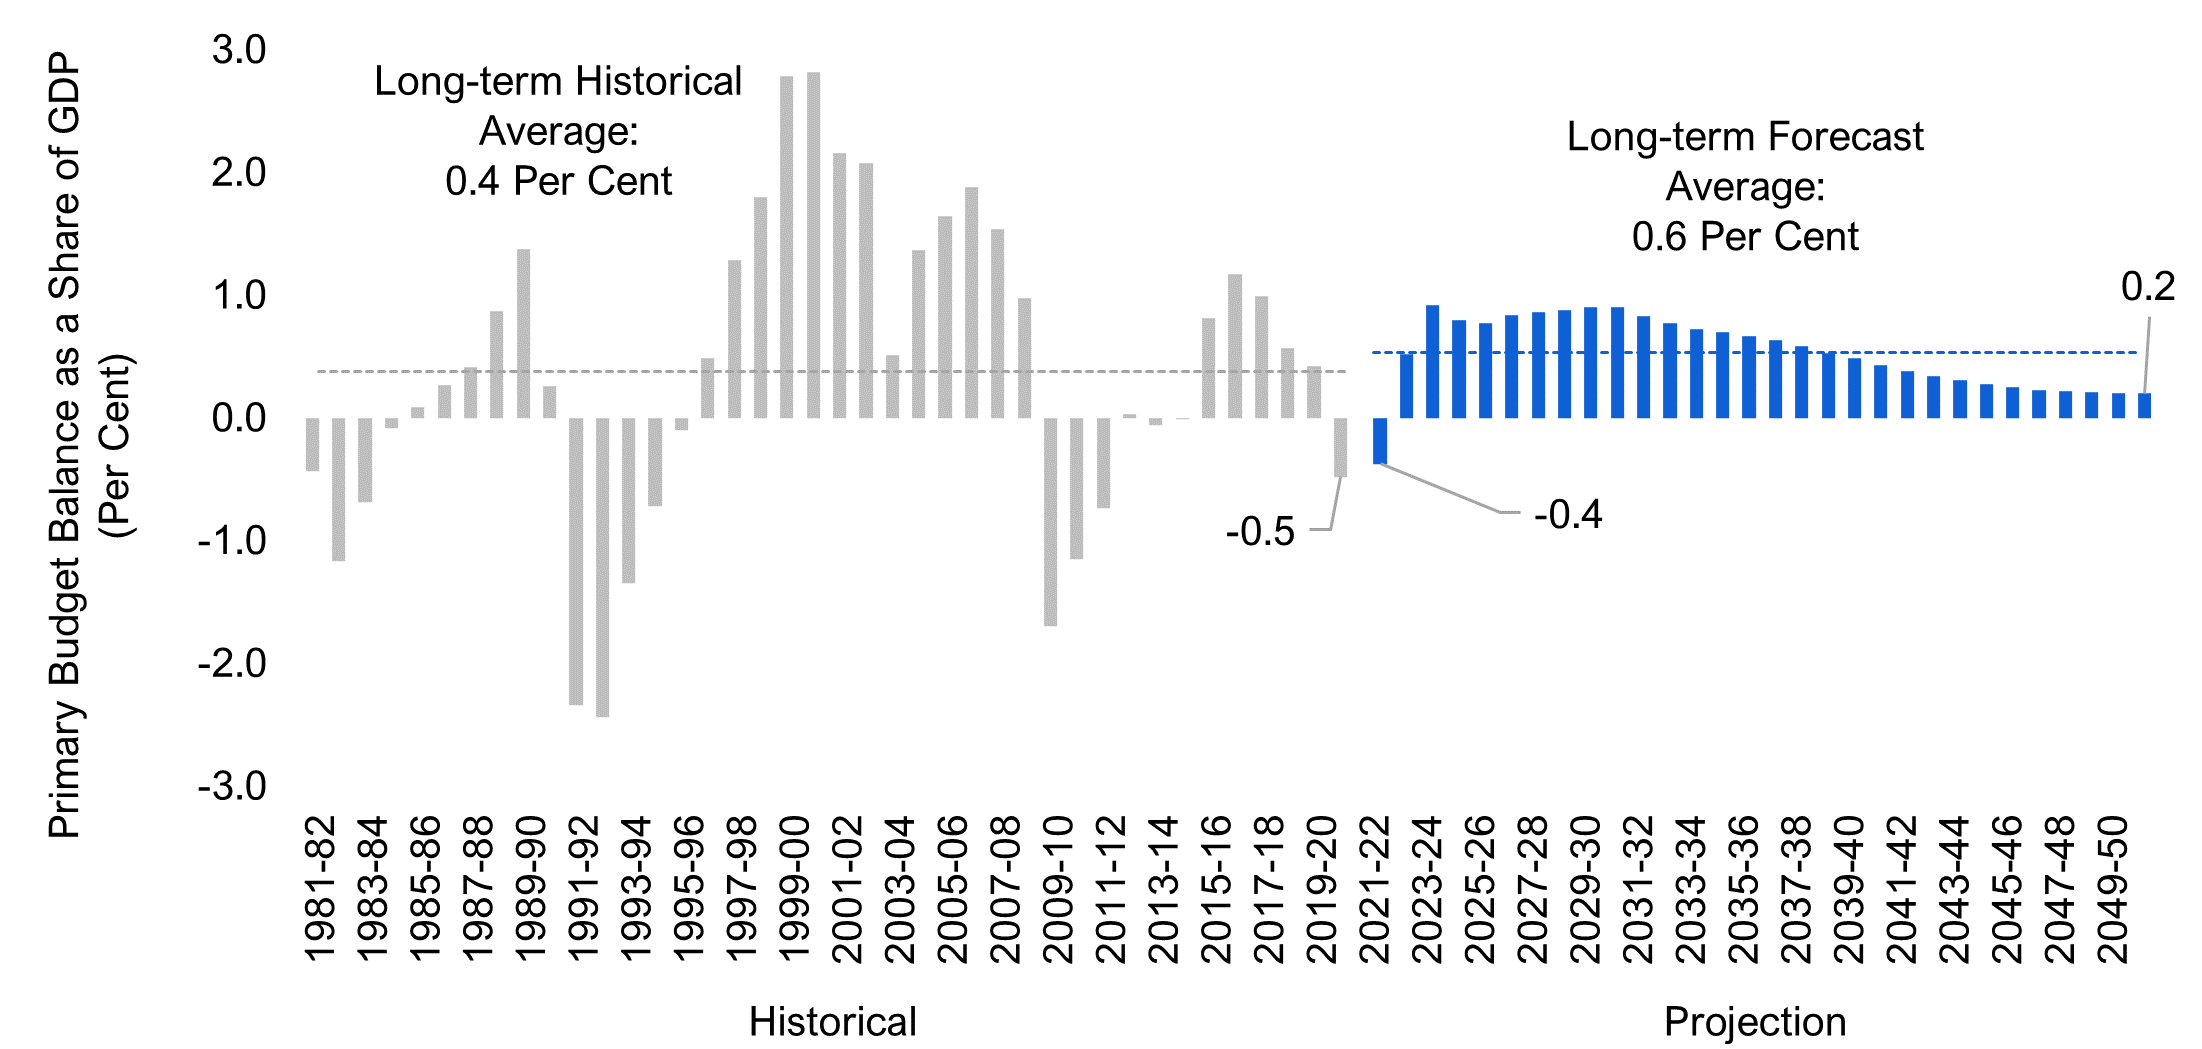
Primary budget balance
The primary budget balance measures the extent to which current revenues fund program spending. If the government’s program spending is smaller than revenues, a primary surplus will result that could be used to service the government’s existing debt burden. Generally, the government has some discretion over the primary balance through revenue and program spending policy. For example, if faced with a large debt burden, the government could enact policies to limit program spending or raise revenue (or a combination of both).
Historically, Ontario has recorded an average primary surplus amounting to 0.4 per cent of GDP, with deficits observed during economic downturns. The FAO projects that the Province will continue to record primary surpluses throughout the long term. However, the size of the surplus as a share of GDP is projected to start declining in the 2030s, reaching 0.2 per cent by 2050-51, as program spending growth outpaces revenue gains. The FAO projects that starting from the mid-2030s, the province’s primary surpluses will not be sufficient to stabilize the net debt-to-GDP ratio.[4]
Chart 2-1 Ontario’s primary surpluses will decline over the long term as program spending grows faster than revenue
Source: Ontario Economic Accounts, Ontario Public Accounts and FAO.
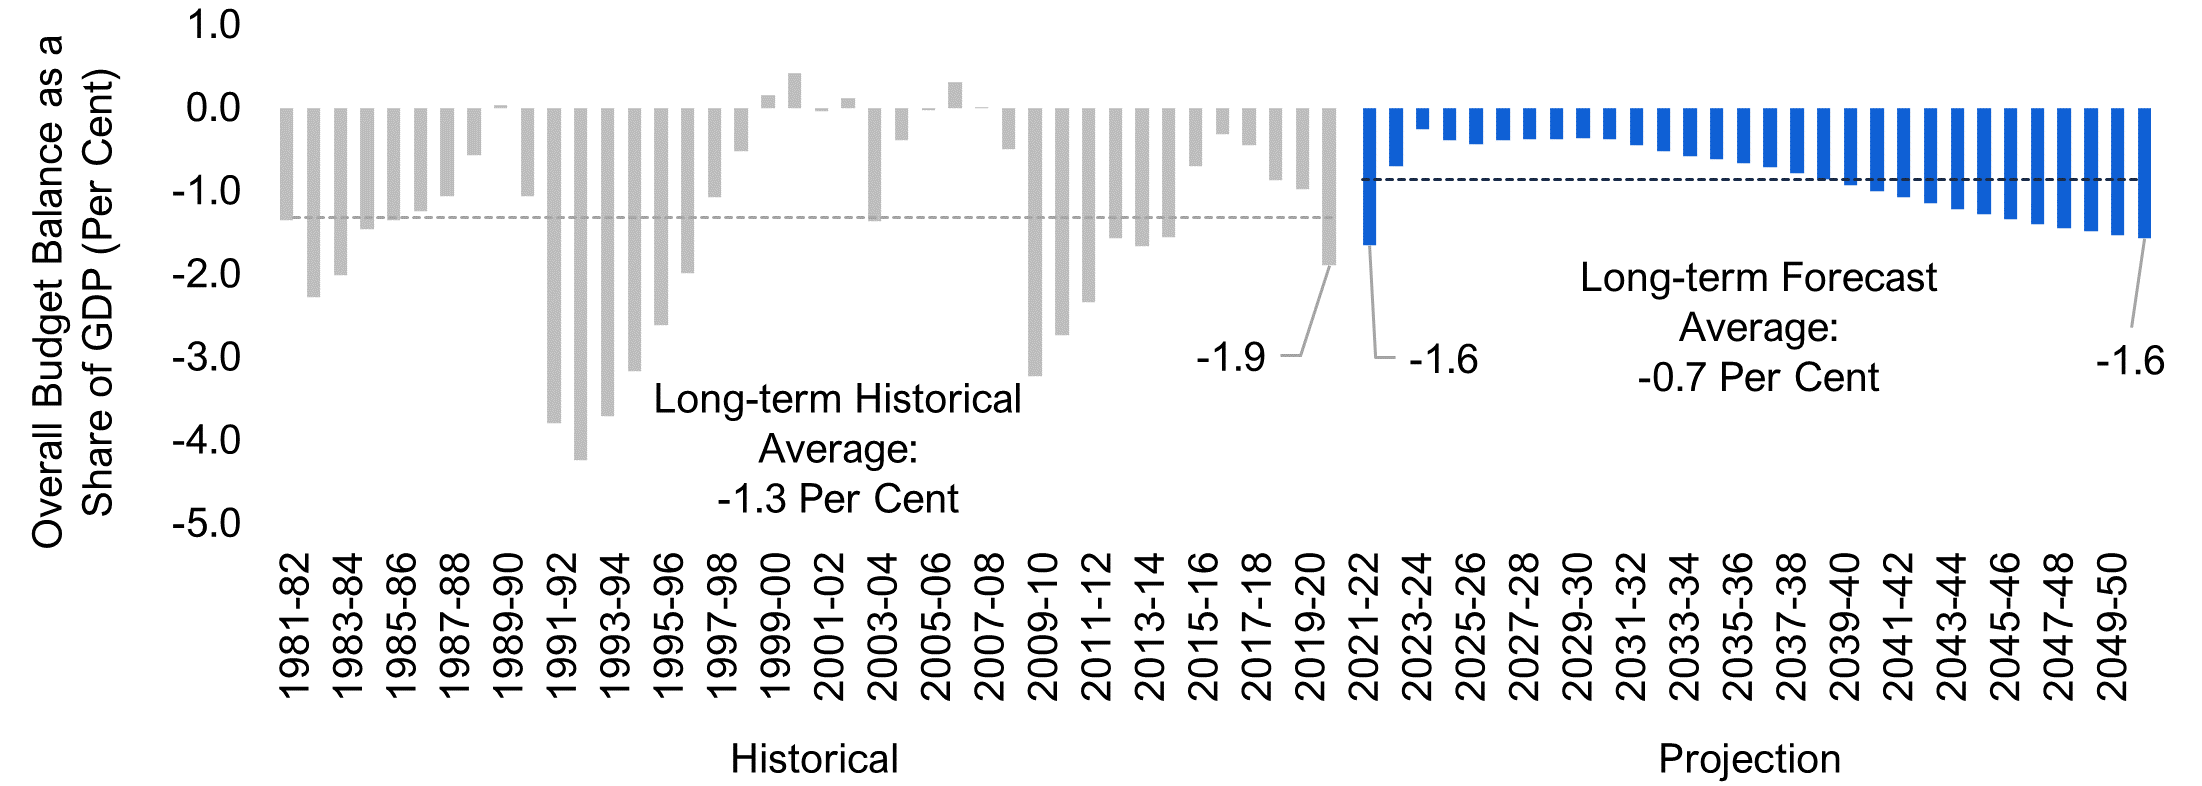
Budget balance
The budget balance measures the extent to which the government needs to borrow. Unlike the primary budget balance, which the government has some ability to control, the overall budget balance includes debt interest payment obligations, which are affected by interest rates and the existing public debt burden. Under Ontario’s Fiscal Sustainability, Transparency and Accountability Act (FSTAA),[5] the government is required to release a plan for an overall balanced budget when in deficit. In the FAO’s projection, the government is not expected to achieve a balanced budget.
Historically, Ontario has balanced its budget in only six of the past 40 years, with deficits worsening during economic downturns and improving during expansions. The FAO projects that Ontario’s budget will remain in deficit over the projection period. The budget deficit as a share of GDP is projected to remain relatively stable until 2030, after which it deteriorates to -1.6 per cent of GDP by 2050-51, similar to the pandemic period. The deterioration in budget balance reflects faster growth in program spending and interest payments[6] compared to revenue gains.
Chart 2-2 Ontario is not projected to achieve a balanced budget over the long term
Source: Ontario Economic Accounts, Ontario Public Accounts and FAO.
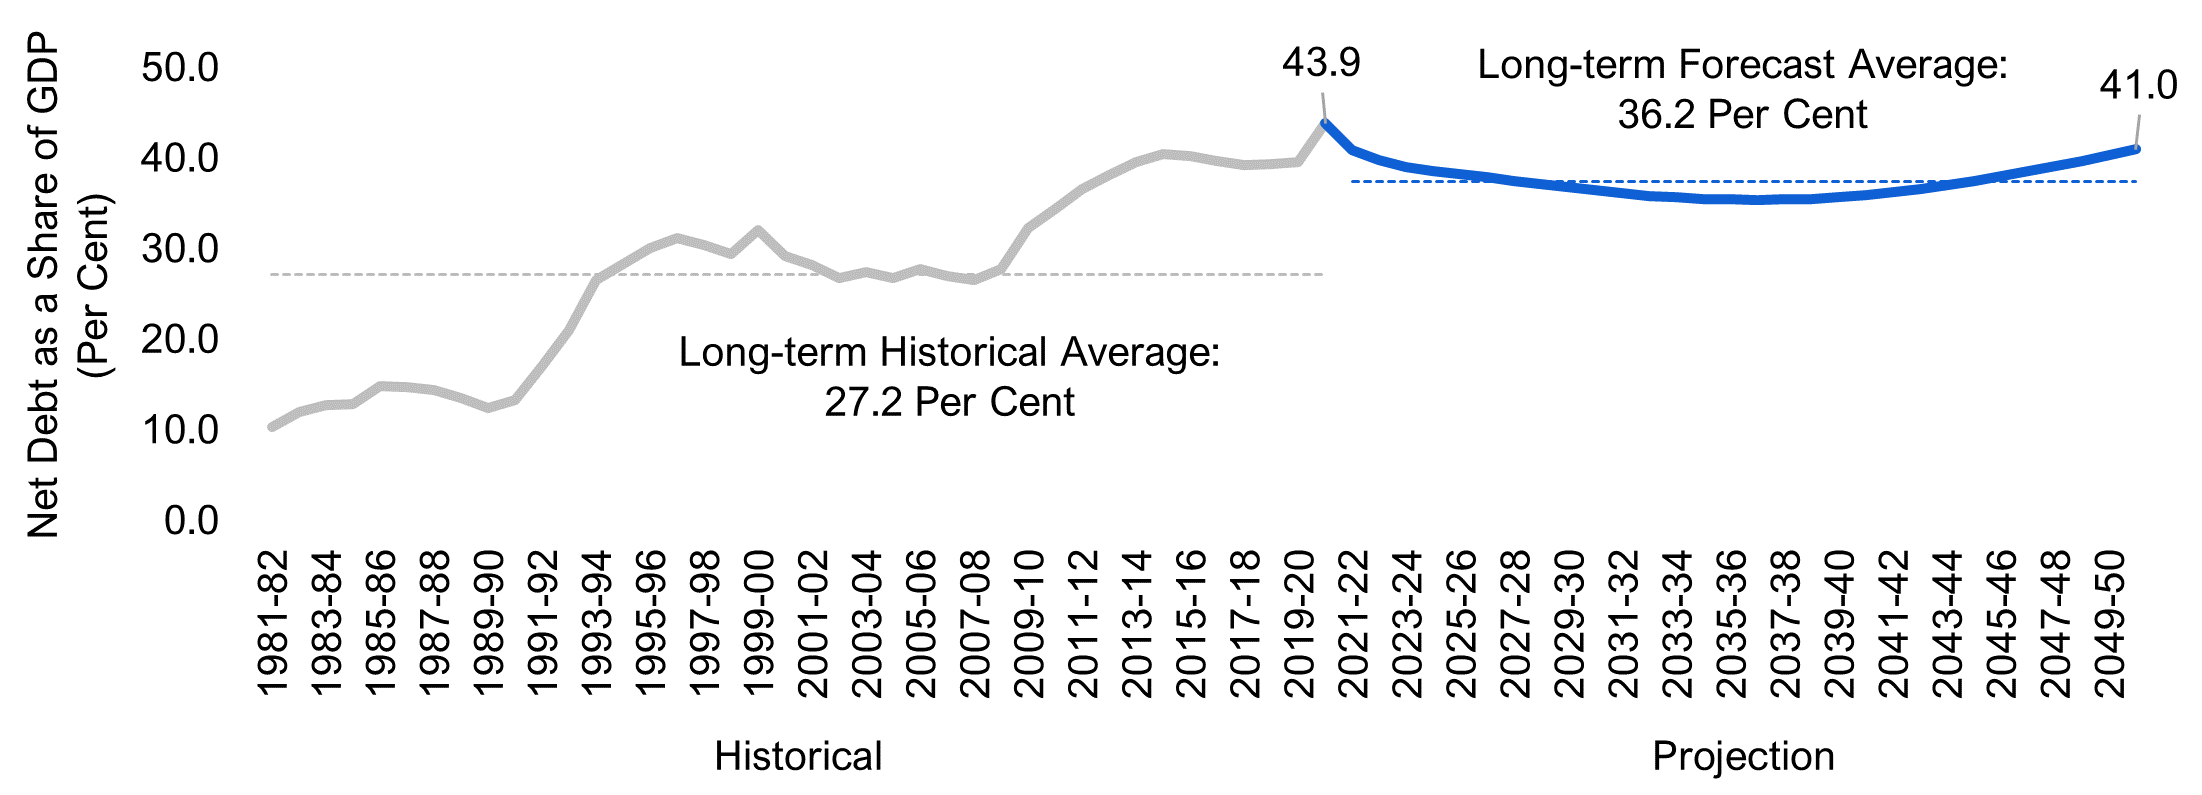
Net debt-to-GDP ratio
Net debt as a share of GDP indicates the ability of the government to raise funds to service its debt obligations. According to FSTAA, the Ontario government is required to provide a debt burden reduction strategy in its annual budgets. The 2021 Ontario Budget indicated that the government’s objective is to not allow for the net debt-to-GDP ratio to exceed 50.5 per cent in the medium-term (2021-22 to 2023-24) outlook.[7] The FAO’s projection indicates that the government will achieve this objective.
Historically, Ontario’s net debt-to-GDP ratio has grown significantly after each major economic downturn and generally remained stable at those elevated rates in subsequent years. The FAO projects that Ontario’s net debt as a share of GDP will decline modestly until the mid-2030s, after which the trend reverses as smaller primary surpluses and faster growth in interest payments[8] lead to increased borrowing. By 2050-51, the net debt-to-GDP ratio reaches 41.0 per cent, close to its peak observed in 2020-21.
Chart 2-3 Ontario’s 2050-51 net debt-to-GDP ratio is projected to be close to the current share
Source: Ontario Economic Accounts, Ontario Public Accounts and FAO.
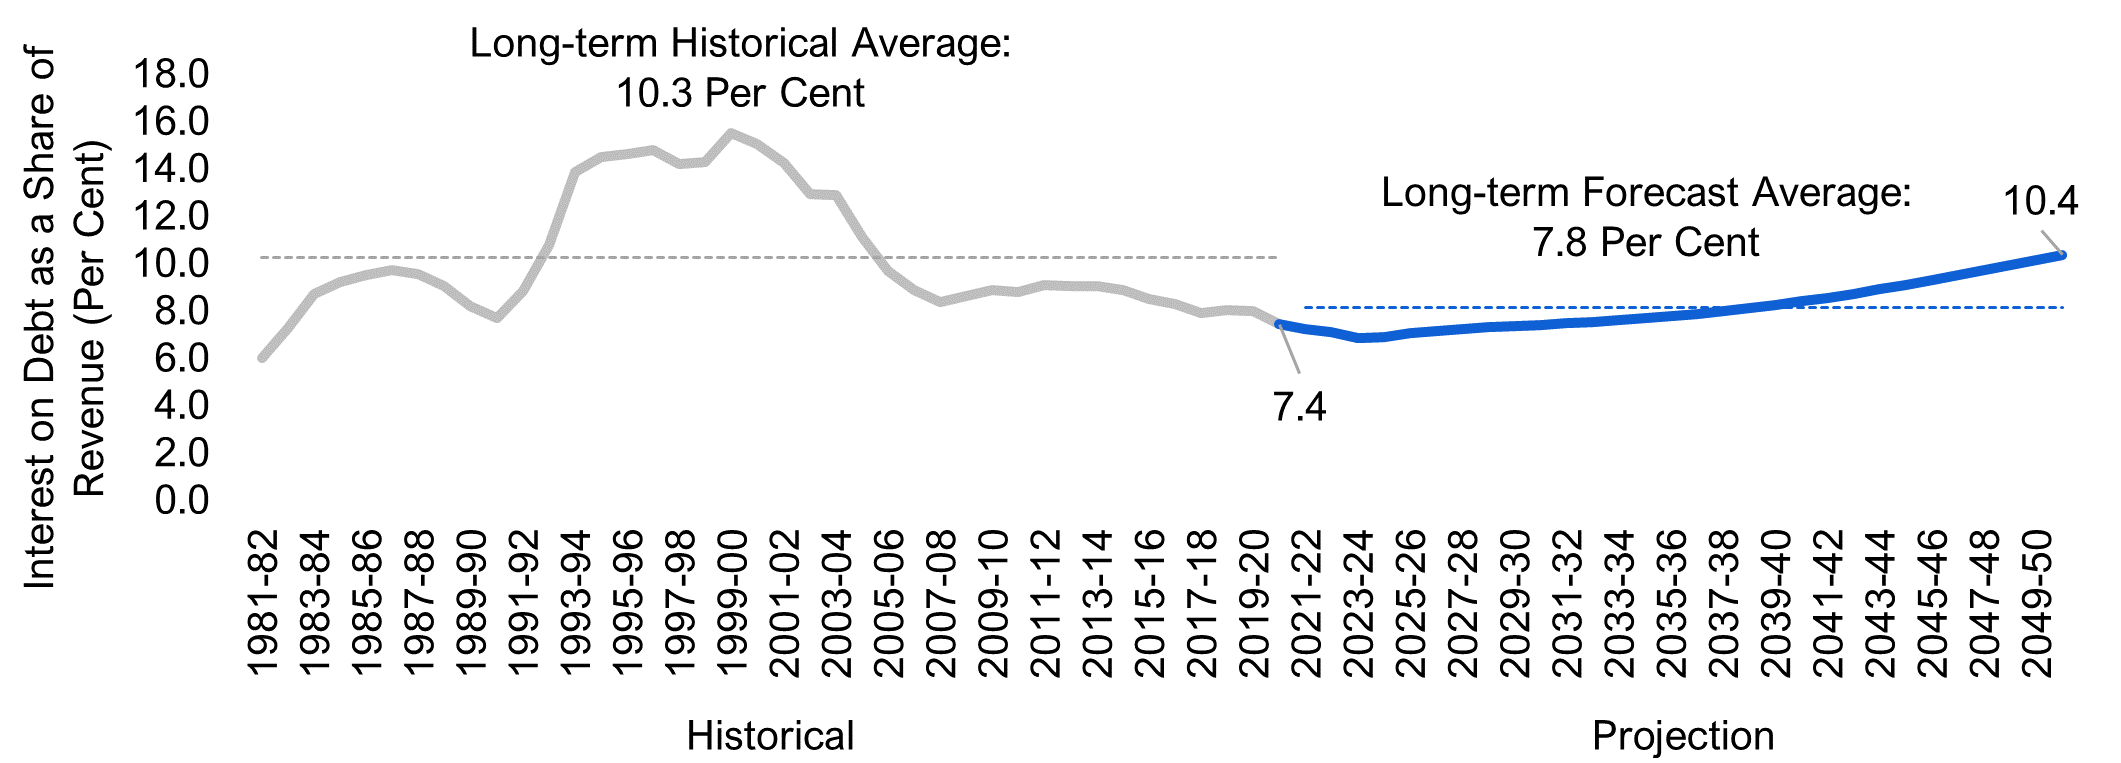
Interest on debt as a share of revenue
If interest on debt as a share of revenue is elevated over the long term, it can raise concerns about the government’s ability to both manage its debt and deliver on fiscal commitments such as healthcare. In the 2021 Budget, the government indicated its objective was to slow the rate at which interest payments as a share of revenues increases.[9] In the FAO’s projection, this ratio declines modestly to 2023-24, but rises continuously over the rest of the outlook.
Historically, the Province’s interest payments averaged 10.3 per cent of its revenues. However, the ratio has trended lower since the early 2000s in tandem with the decline in interest rates. The FAO finds that over the long term, as interest rates increase from their historic lows, the government’s new borrowing and maturing debt will be financed at higher rates. As a result, Ontario’s interest on debt as a share of revenue is projected to rise from 7.4 per cent in 2020-21 to 10.4 per cent by 2050-51, modestly above the historical average.
Chart 2-4 Ontario’s interest on debt as a share of revenue is projected to increase over the long term
Source: Ontario Economic Accounts, Ontario Public Accounts and FAO.
Risks to Ontario’s Fiscal Outlook
Several factors exist that could undermine Ontario’s fiscal outlook over the long term.
- If the government makes future announcements such as new tax cuts, spending initiatives or a combination of both, the FAO’s projection of fiscal indicators would deteriorate.[10]
- Ontario faces capital expenditure pressures, including an infrastructure backlog of $16.8 billion in 2020 that is expected to reach $22.7 billion by 2029-30, and the impact of climate change which will raise the cost of maintaining Ontario’s infrastructure as climate hazards become more extreme.[11] Adapting public infrastructure to withstand climate hazards will also require significant investment. Addressing these infrastructure funding gaps would require additional capital spending and would increase the province’s borrowing and debt levels in the FAO’s current projection.[12]
- The FAO projects a gradual increase in interest rates over the projection, consistent with most economic forecasters. However, if interest rates rise faster and higher than expected, this will put considerable pressure on Ontario’s finances – see Box 1 below.
Box 1 Higher interest rates would increase the fiscal vulnerability of the Province
A key risk to Ontario’s fiscal outlook is the future path of interest rates, which affects borrowing costs. To evaluate how higher-than-expected interest rates would affect the province’s finances, the FAO developed a “higher rates” scenario where borrowing costs rise 100 basis points above the baseline projection by the mid-2020s. In this scenario, the Ontario 10-year bond yield averages 4.8 per cent over the outlook, higher than the 3.8 per cent average in the base case.
In the “higher rates” scenario, the FAO finds that Ontario’s net debt as a share of GDP and interest on debt as a share of revenue would deteriorate significantly, increasing the fiscal vulnerability of the province.
Net Debt as a share of GDP
- The increased borrowing costs in the “higher rates” scenario results in a record 48.5 per cent net debt-to-GDP ratio by 2050-51, 7.5 percentage points above the FAO’s base case of 41 per cent.
Interest on Debt as a share of GDP
- The increased borrowing costs in the “higher rates” scenario results in a sharp rise in the interest on debt-to-revenue ratio to 15.0 per cent by 2050-51, 4.6 percentage points above the FAO’s base case of 10.4 per cent.
Source: Ontario Economic Accounts, Ontario Public Accounts and FAO.
3 | Fiscal Outlook
Spending Projection
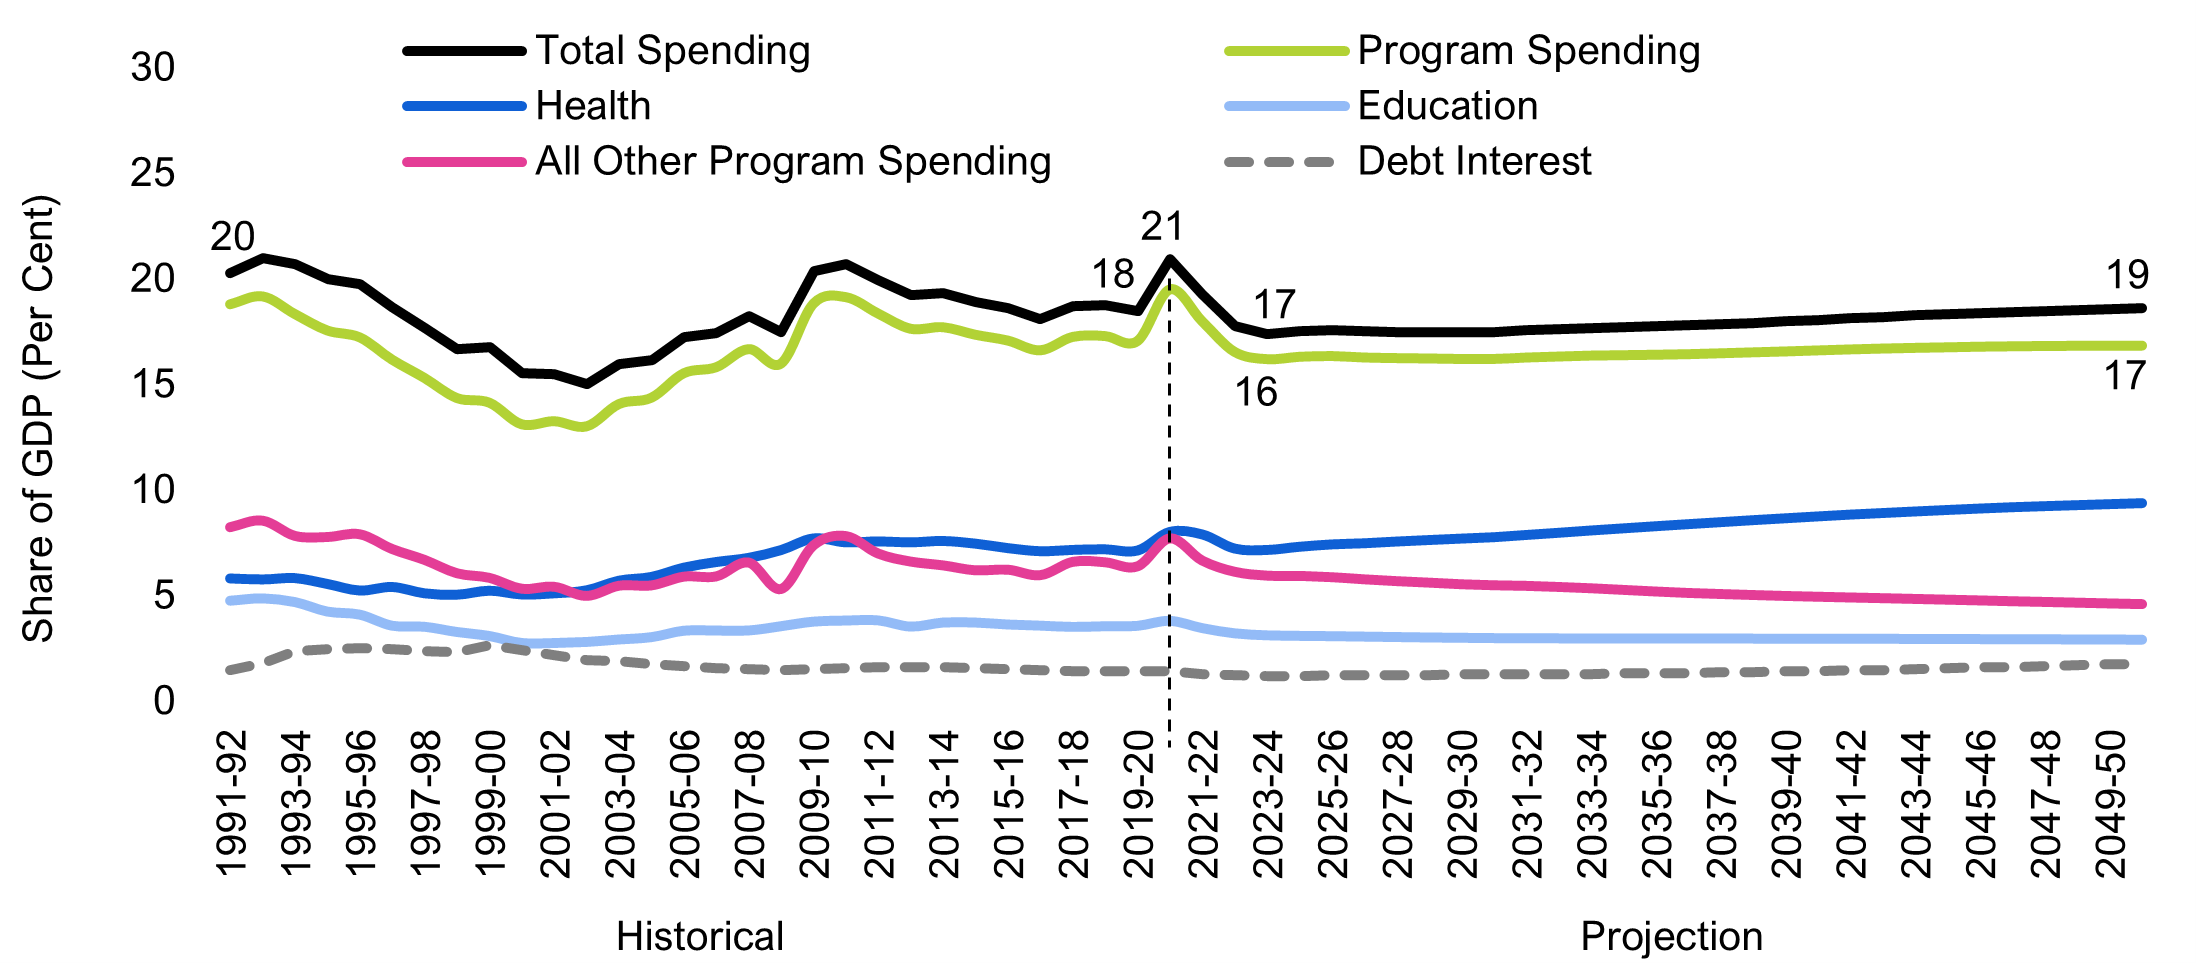
The COVID-19 pandemic resulted in a temporary increase in government spending over the short term, rising from 18 per cent of nominal GDP in 2019-20 to a high of 21 per cent in 2020-21. As the temporary COVID-19 spending fades, the FAO projects that total spending as a share of GDP will decline to 17 per cent by 2023-24.[13]
Over the remainder of the projection, total spending is expected to rise steadily as a share of GDP to around 19 per cent by 2050-51. This increase is driven primarily by the ongoing rise in health care expenses, which are projected to grow faster than the economy. In contrast, spending on education and all other programs[14] will decline as a share of GDP over the projection, consistent with long-term historical trends. By the 2040s, higher debt interest payments will also contribute to the rising GDP share of total government expenditures.
Chart 3-1 Post-pandemic, total spending as a share of GDP to slowly rise over the outlook
Source: FAO analysis of Ontario Public Accounts, Ontario Budgets, Ontario Economic Accounts, and information provided by the Ministry of Finance.
Program spending projection
The demand for public services generally increases as the population grows and ages. Public sector wages and the cost of providing public goods and services will also increase as prices rise. These underlying factors, including the long-term average rates of program enrichment,[15] put upward pressure on projected program spending. However, current government policies and plans[16] also impact program spending, which may not align with these underlying cost pressures.[17]
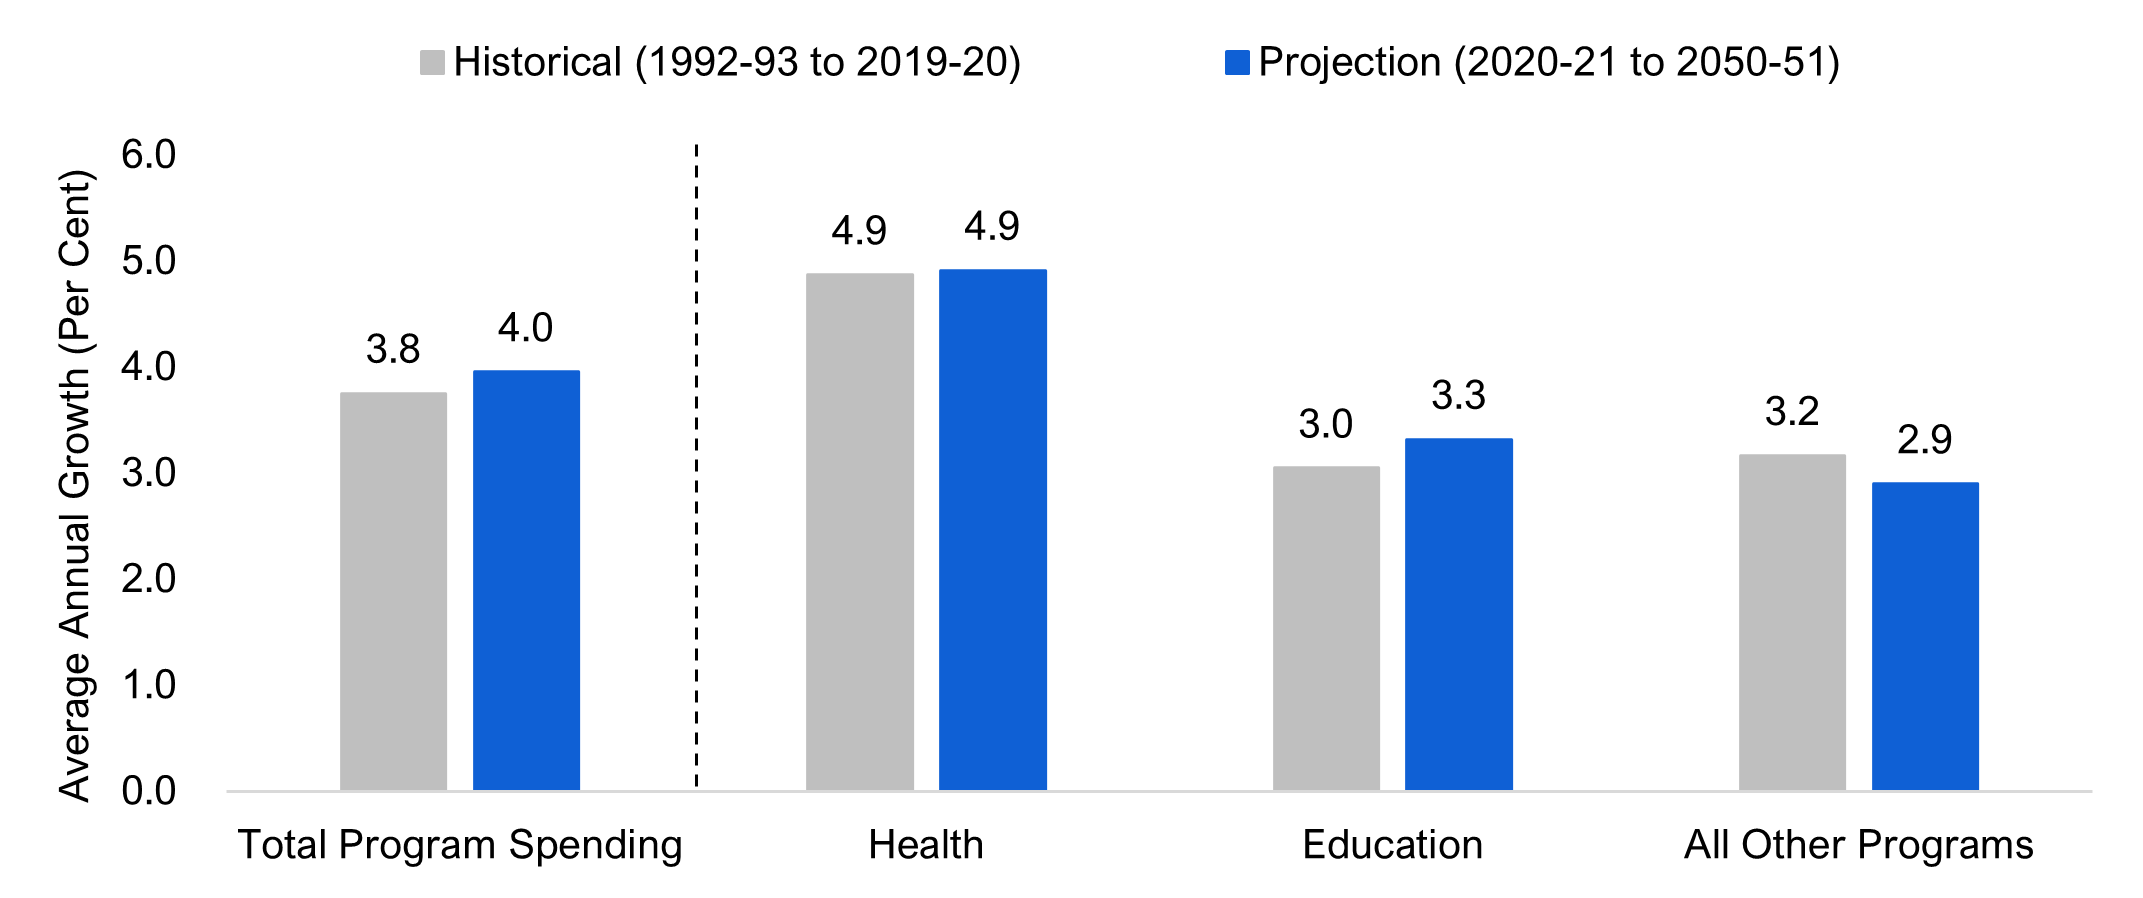
Program spending grew at an average annual rate of 3.8 per cent over the 1992-93 to 2019-20[18] period. Based on the FAO’s outlook for increased inflation, faster growth in the school-age population, and continued impacts from population aging, program spending is expected to grow modestly faster over the projection, averaging 4.0 per cent during the 2020-21 to 2050-51 period.
Chart 3-2 Program spending growth expected to be faster than in the past
Source: FAO analysis of Ontario Public Accounts, Ontario Budgets and information provided by the Ministry of Finance.
Health sector spending is projected to grow at an average annual rate of 4.9 per cent per year, in line with historical trends. While health inflation is projected to be somewhat higher than the historical experience, especially in the next two years, Ontario’s population growth is projected to ease over the projection. In addition, the impact of aging on Ontario’s health care expense is projected to be broadly in line with the historical experience.[19]
Education sector spending is projected to grow at an average annual rate of 3.3 per cent per year, somewhat faster than historical trends. This is primarily due to the expected faster growth of the school aged population, as the children of the echo boomers[20] will move through the school system.
‘All other’ programs, which includes all program spending not accounted for in the health and education sectors, is projected to grow at an average annual rate of 2.9 per cent per year, somewhat slower than historical trends. While inflation and population growth combined are projected to grow modestly faster than historically, the FAO estimates that spending growth will be limited by certain policies and programs, including the Ontario Student Assistance Program (OSAP), and various energy and electricity subsidy programs.[21]
Capital spending
Capital spending includes funds allocated to build new assets, capital repair expenditures to maintain the $265.6 billion portfolio of existing provincial infrastructure,[22] as well as transfers to third parties. Capital spending is expected to grow at 4.0 per cent annually over the projection, slower than historical spending[23] but in line with economic growth. Despite the slowdown in growth, per capita real capital spending will continue to increase over the outlook.
Chart 3-3 Capital spending growth projected to slow somewhat from historical rates
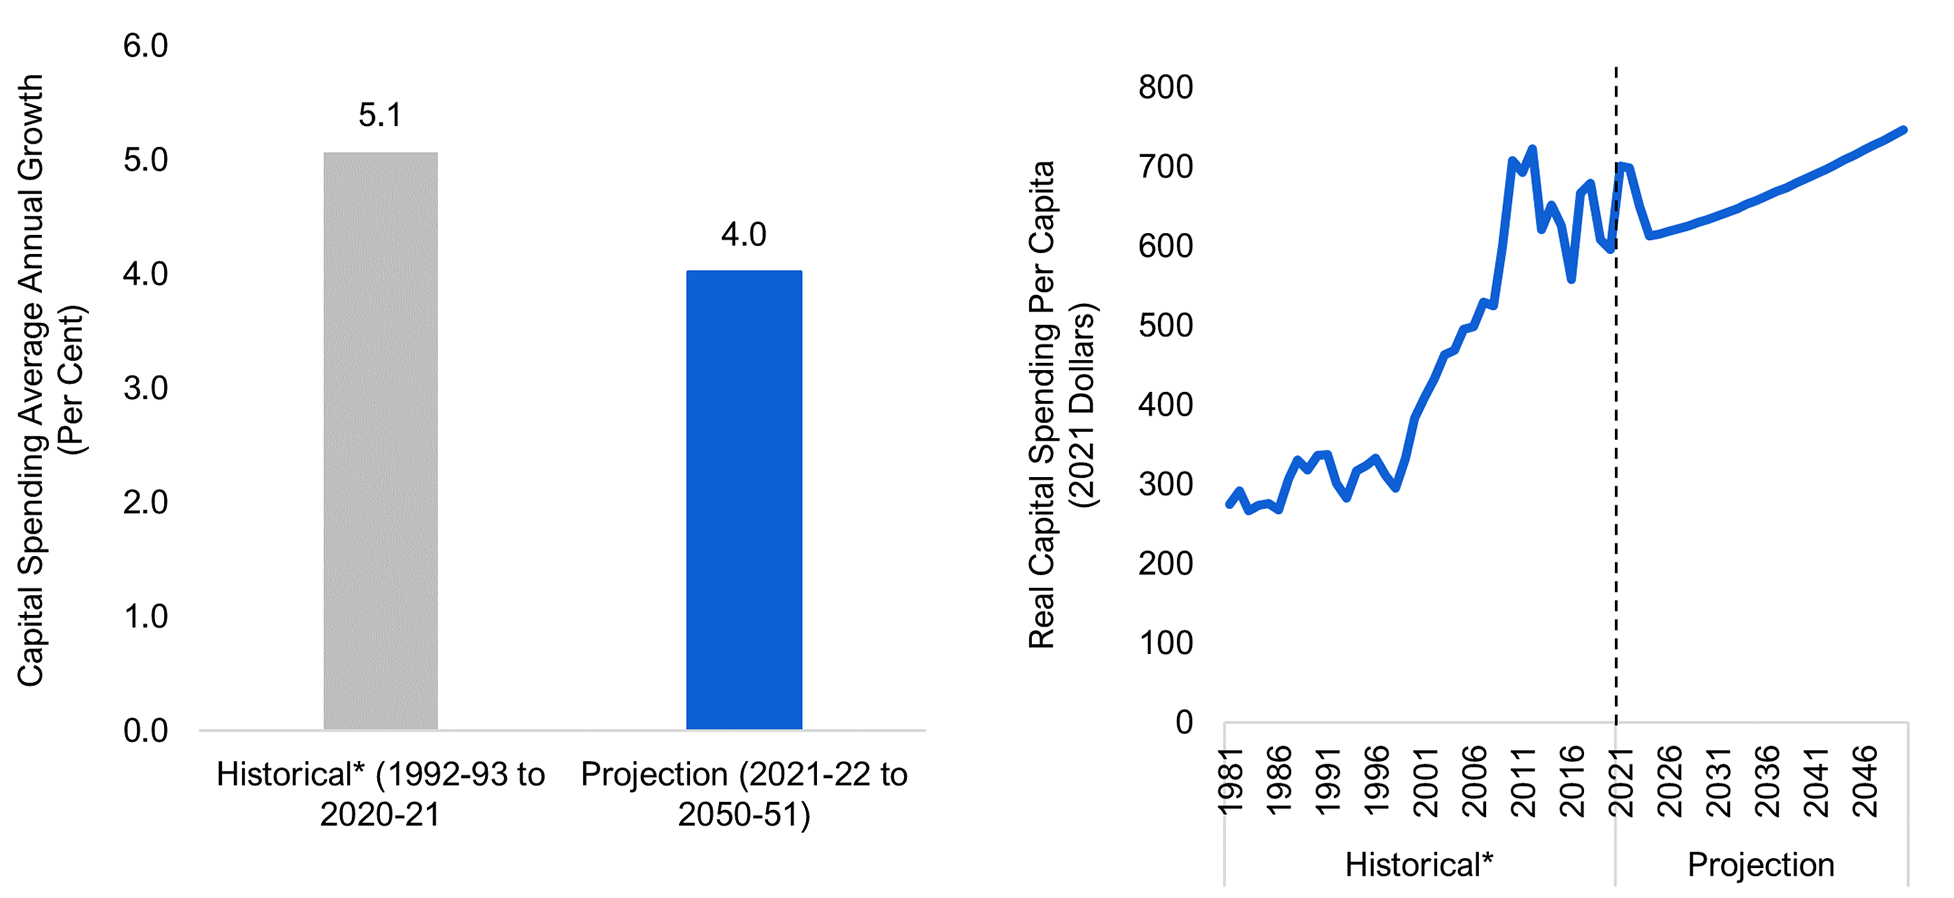
* Historical capital spending prior to 2010-11 is imputed from Table: 36-10-0096-01.
Source: Information provided by Ontario Ministry of Finance, Statistics Canada and FAO.
Accessible Version
| Average Annual Growth (Per Cent) | ||
|---|---|---|
| Historical (1992-2021) | Projection (2022-2050) | |
| Capital Spending | 5.1 | 4.0 |
| Real Capital Spending per Capita (2021 Dollars) | ||
|---|---|---|
| Year | Historical (1992-2021) | Projection (2022-2050) |
| 1981-82 | 275 | |
| 1982-83 | 292 | |
| 1983-84 | 267 | |
| 1984-85 | 274 | |
| 1985-86 | 276 | |
| 1986-87 | 268 | |
| 1987-88 | 307 | |
| 1988-89 | 331 | |
| 1989-90 | 318 | |
| 1990-91 | 337 | |
| 1991-92 | 337 | |
| 1992-93 | 301 | |
| 1993-94 | 283 | |
| 1994-95 | 317 | |
| 1995-96 | 324 | |
| 1996-97 | 333 | |
| 1997-98 | 312 | |
| 1998-99 | 295 | |
| 1999-00 | 333 | |
| 2000-01 | 384 | |
| 2001-02 | 410 | |
| 2002-03 | 433 | |
| 2003-04 | 463 | |
| 2004-05 | 469 | |
| 2005-06 | 495 | |
| 2006-07 | 498 | |
| 2007-08 | 530 | |
| 2008-09 | 525 | |
| 2009-10 | 601 | |
| 2010-11 | 708 | |
| 2011-12 | 693 | |
| 2012-13 | 723 | |
| 2013-14 | 621 | |
| 2014-15 | 652 | |
| 2015-16 | 625 | |
| 2016-17 | 558 | |
| 2017-18 | 666 | |
| 2018-19 | 680 | |
| 2019-20 | 608 | |
| 2020-21 | 596 | |
| 2021-22 | 701 | |
| 2022-23 | 699 | |
| 2023-24 | 651 | |
| 2024-25 | 613 | |
| 2025-26 | 615 | |
| 2026-27 | 618 | |
| 2027-28 | 622 | |
| 2028-29 | 626 | |
| 2029-30 | 630 | |
| 2030-31 | 633 | |
| 2031-32 | 638 | |
| 2032-33 | 643 | |
| 2033-34 | 648 | |
| 2034-35 | 653 | |
| 2035-36 | 658 | |
| 2036-37 | 663 | |
| 2037-38 | 669 | |
| 2038-39 | 674 | |
| 2039-40 | 680 | |
| 2040-41 | 685 | |
| 2041-42 | 691 | |
| 2042-43 | 697 | |
| 2043-44 | 703 | |
| 2044-45 | 709 | |
| 2045-46 | 715 | |
| 2046-47 | 721 | |
| 2047-48 | 727 | |
| 2048-49 | 733 | |
| 2049-50 | 740 | |
| 2050-51 | 747 | |
Revenue Projection
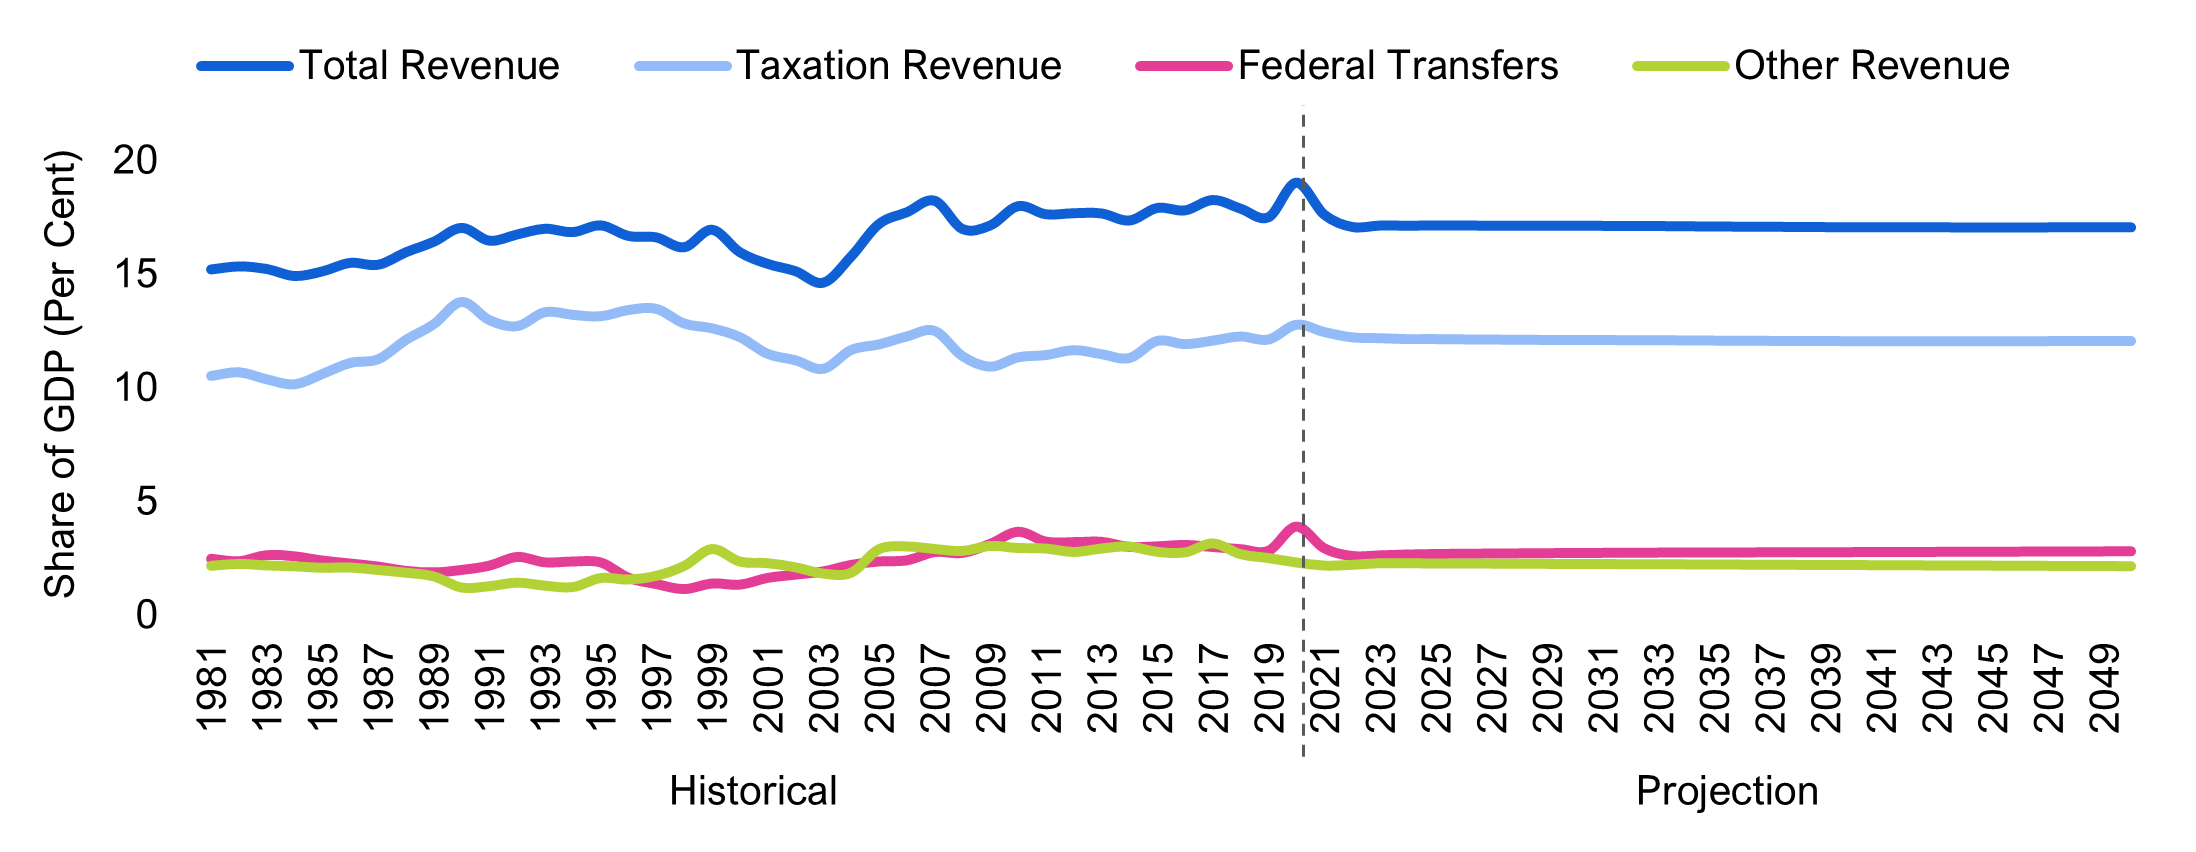
Since the 2008-2009 recession to the start of the COVID-19 pandemic, provincial revenues as a share of nominal GDP were relatively stable at around 18 per cent. In the 2020-21 fiscal year, the share increased to 19 per cent as pandemic-related transfers and assistance from the federal government temporarily boosted revenues while economic activity declined.
Chart 3-4 Revenues as share of GDP to remain stable
Source: Ontario Public Accounts and Budgets, Ontario Economic Accounts and FAO.
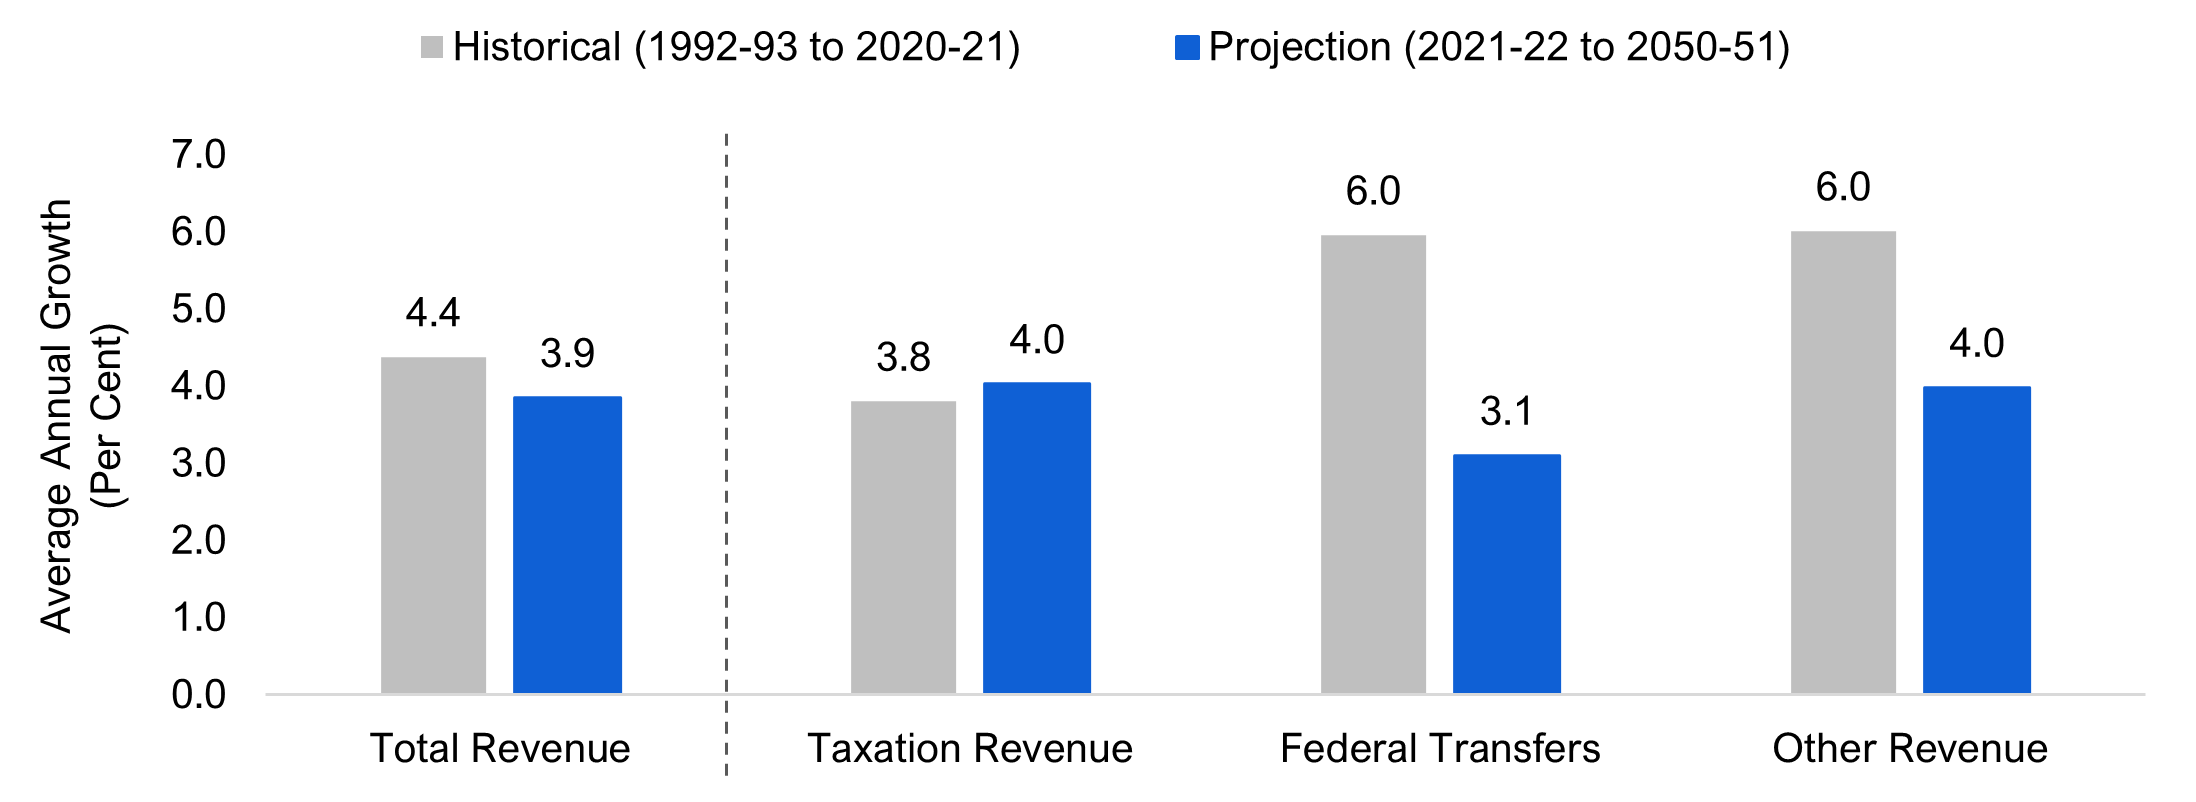
Following this temporary increase, the FAO projects the share of revenues to GDP will decline in the near term as economic activity rebounds and temporary COVID-19-related revenues disappear. Over the long term, the FAO projects total revenues will remain stable at 17 per cent of GDP,[24] as revenues grow at an average annual rate of 3.9 per cent during the 2021-22 to 2050-51 period, weaker than historical experience and reflecting slower growth in federal transfers and other revenue.[25]
Chart 3-5 Revenue growth expected to be slower than historical rates
Source: Ontario Public Accounts and Budgets, Statistics Canada and FAO.
Taxation revenue
Total taxation revenue is expected to grow at an average annual rate of 4.0 per cent, consistent with the FAO’s economic projection, which expects very strong growth over the next several years as the Ontario economy rebounds from the pandemic.[26] The pace of tax revenue growth slows in the post-pandemic period as economic growth moderates.
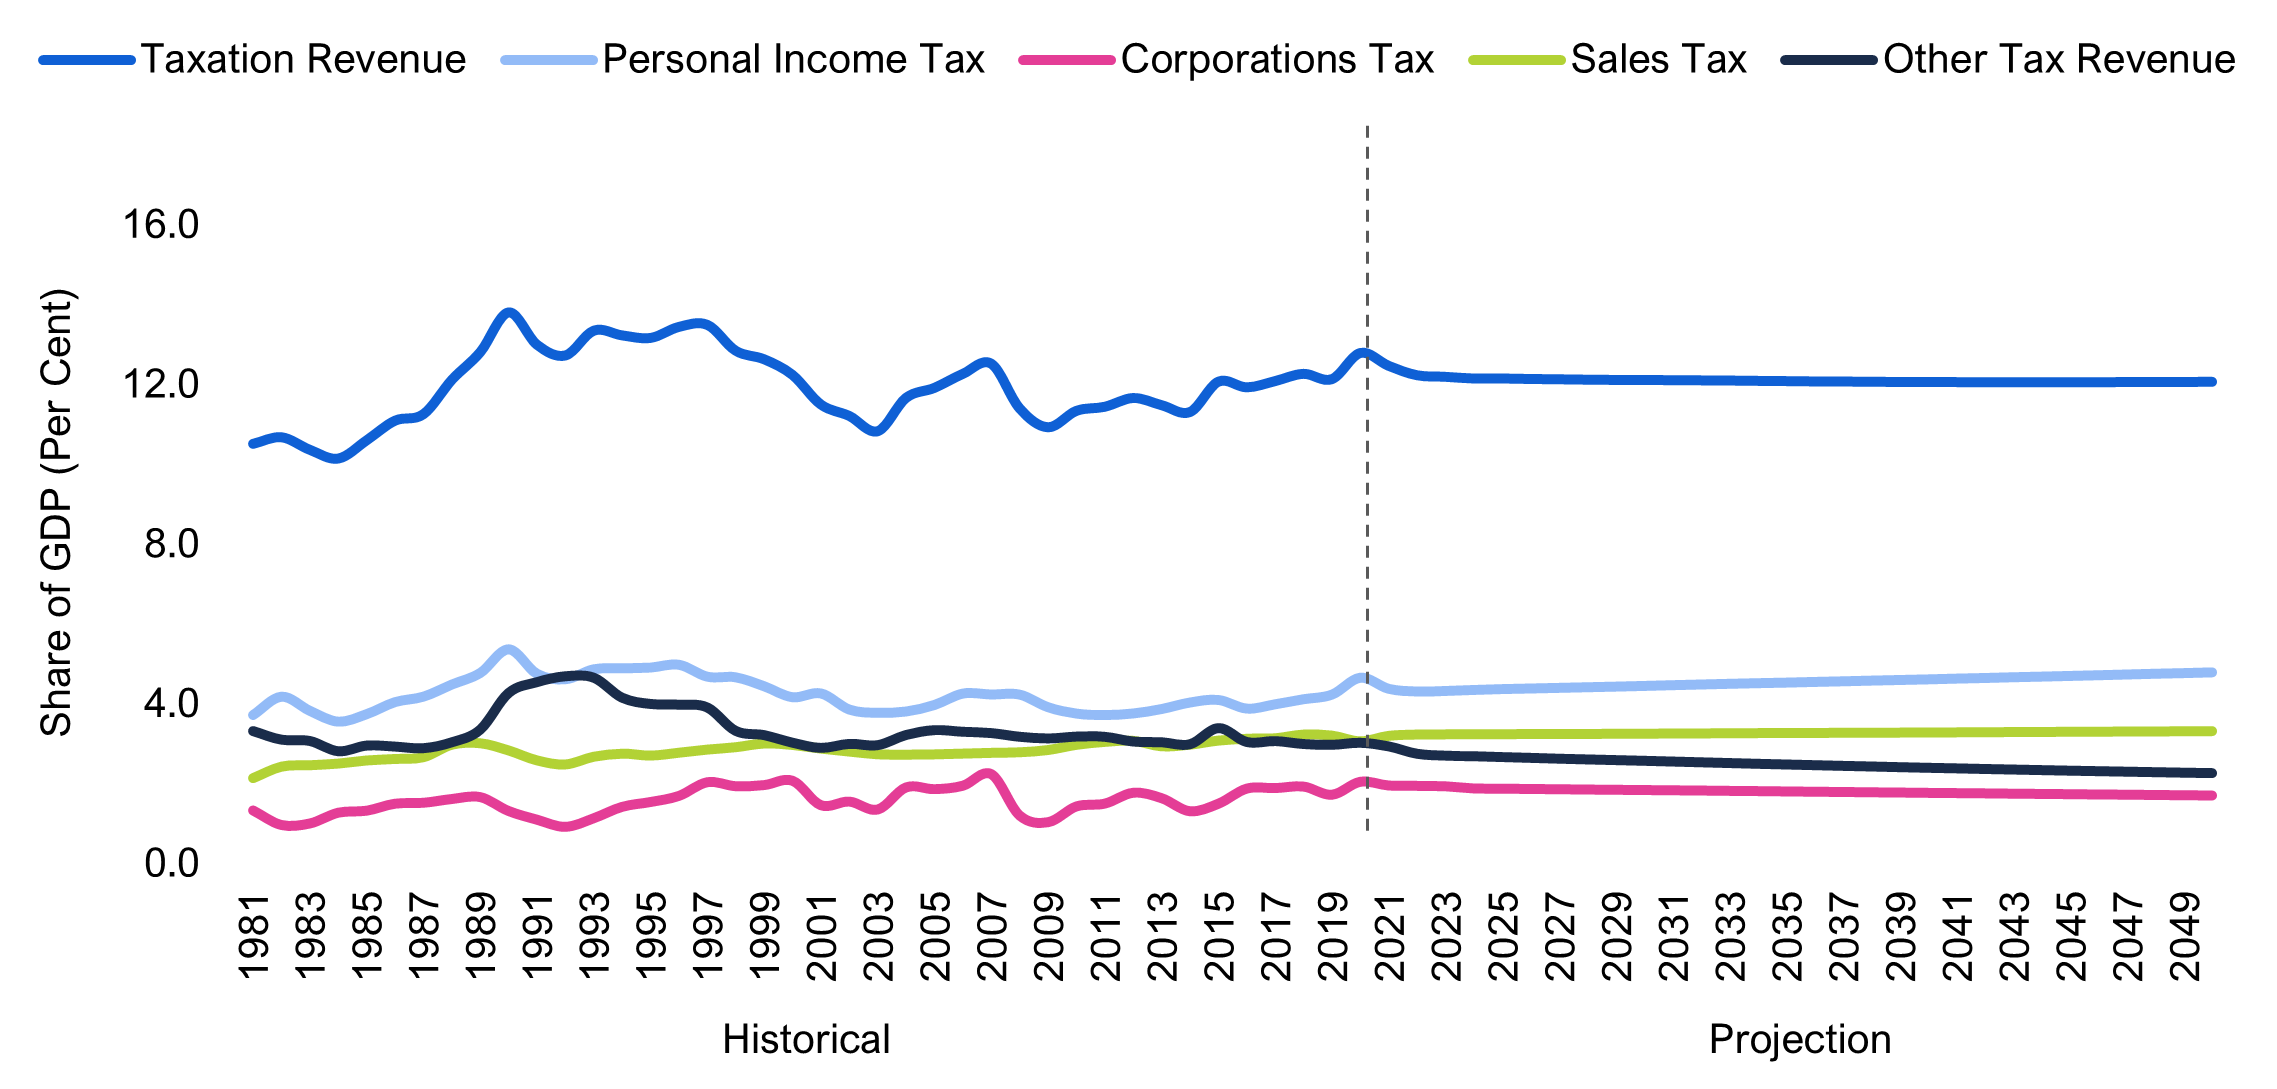
Although the share of tax revenue to GDP remains relatively stable over the outlook at 12 per cent, the relative shares of the major tax revenue categories will continue their historical trends.
- Personal income tax revenue as a share of GDP will increase slightly over the projection, the result of the progressive nature of the income tax system, as income growth pushes taxpayers into higher tax brackets.
- Corporations tax revenue will slowly decline as a share of GDP, as corporations continue to use tax preferences to limit tax liabilities, resulting in slower growth in corporate tax revenues relative to business profits.
- Sales tax revenue is expected to remain constant as a share of GDP, as sales tax rates remain unchanged.
Other tax revenue will decline as a share of economic activity, as volume-based taxes such as the gas tax and fuel tax, will grow slower than other nominal-based taxes.
Chart 3-6 Overall taxation revenues as a share of GDP to be stable over the outlook
Source: Ontario Public Accounts and Budgets, Statistics Canada and FAO.
Federal transfer revenue
Federal transfer revenue is projected to grow at an average annual rate of 3.1 per cent[27] over the long term based on current federal-provincial agreements. The slower rate of growth compared to history reflects:
- the federal government’s policy to increase the Canada Social Transfer by 3 per cent per year and limit increases in the Canada Health Transfer to the growth rate of Canadian nominal GDP beginning in 2017-18;[28] and
- the assumption that all other federal transfers will grow in line with Ontario nominal GDP over the projection.[29] Other revenue
Other revenue
Other revenue includes income from Ontario’s government business enterprises (including the Lottery and Gaming Corporation, the Ontario Cannabis Store, the Liquor Control Board and electricity enterprises) as well as non-tax revenues such as various fees, asset sales and royalties.
Other revenue is projected to grow at an average annual rate of 4.0 per cent over the projection, based on the government’s estimates for income from government business enterprises over the next three years[30] and the FAO’s economic outlook. The pace of growth is slower than the 6.0 per cent rate recorded over history,[31] but broadly consistent with projected economic growth.
4 | Economic Outlook
Ontario’s Economic Outlook
Chart 4-1 Deconstructing Ontario’s GDP growth
Source: Ontario Economic Accounts, and FAO.
Although Ontario continues to struggle with the pandemic, the economy has rebounded strongly and is expected to record above-average growth over the 2021 to 2023 period. Assuming the spread of COVID-19 variants is controlled, all social distancing measures are gradually lifted, and supply chains are restored, the economy is expected to return to more normal rates of growth from 2024 onwards.
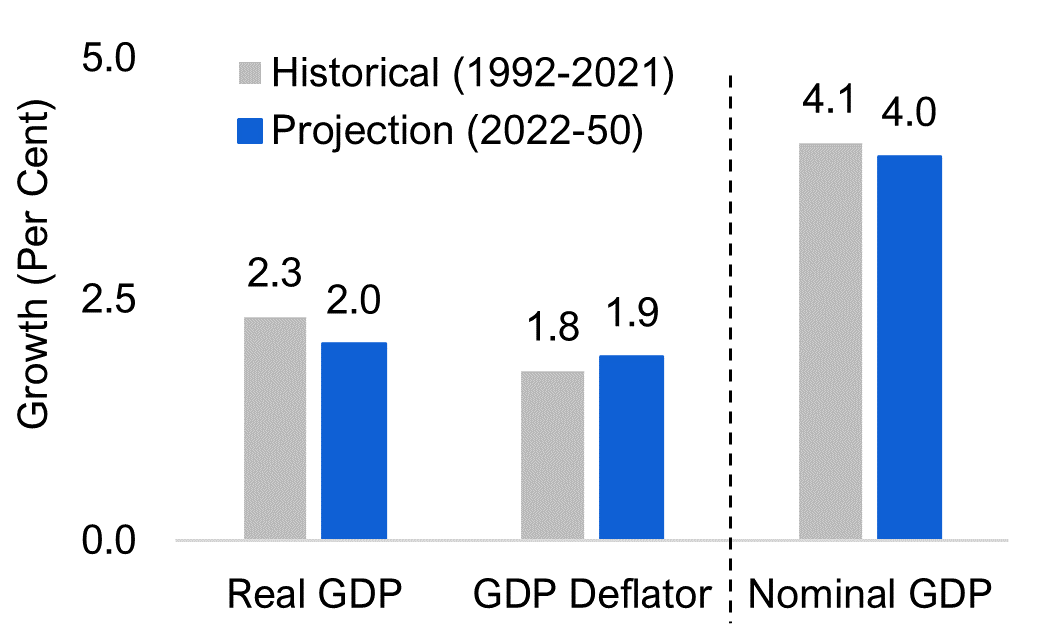
In the long term, the FAO projects average annual real GDP growth of 2.0 per cent, slower than the historical average of 2.3 per cent. The GDP price deflator – a measure of economy-wide prices – is forecast to rise at an average annual rate of 1.9 per cent, modestly above historical performance, but consistent with trends since the early 2000s. Combining the outlook for these two factors, nominal GDP growth is projected to rise at an average annual pace of 4.0 per cent, modestly slower than the historical average.
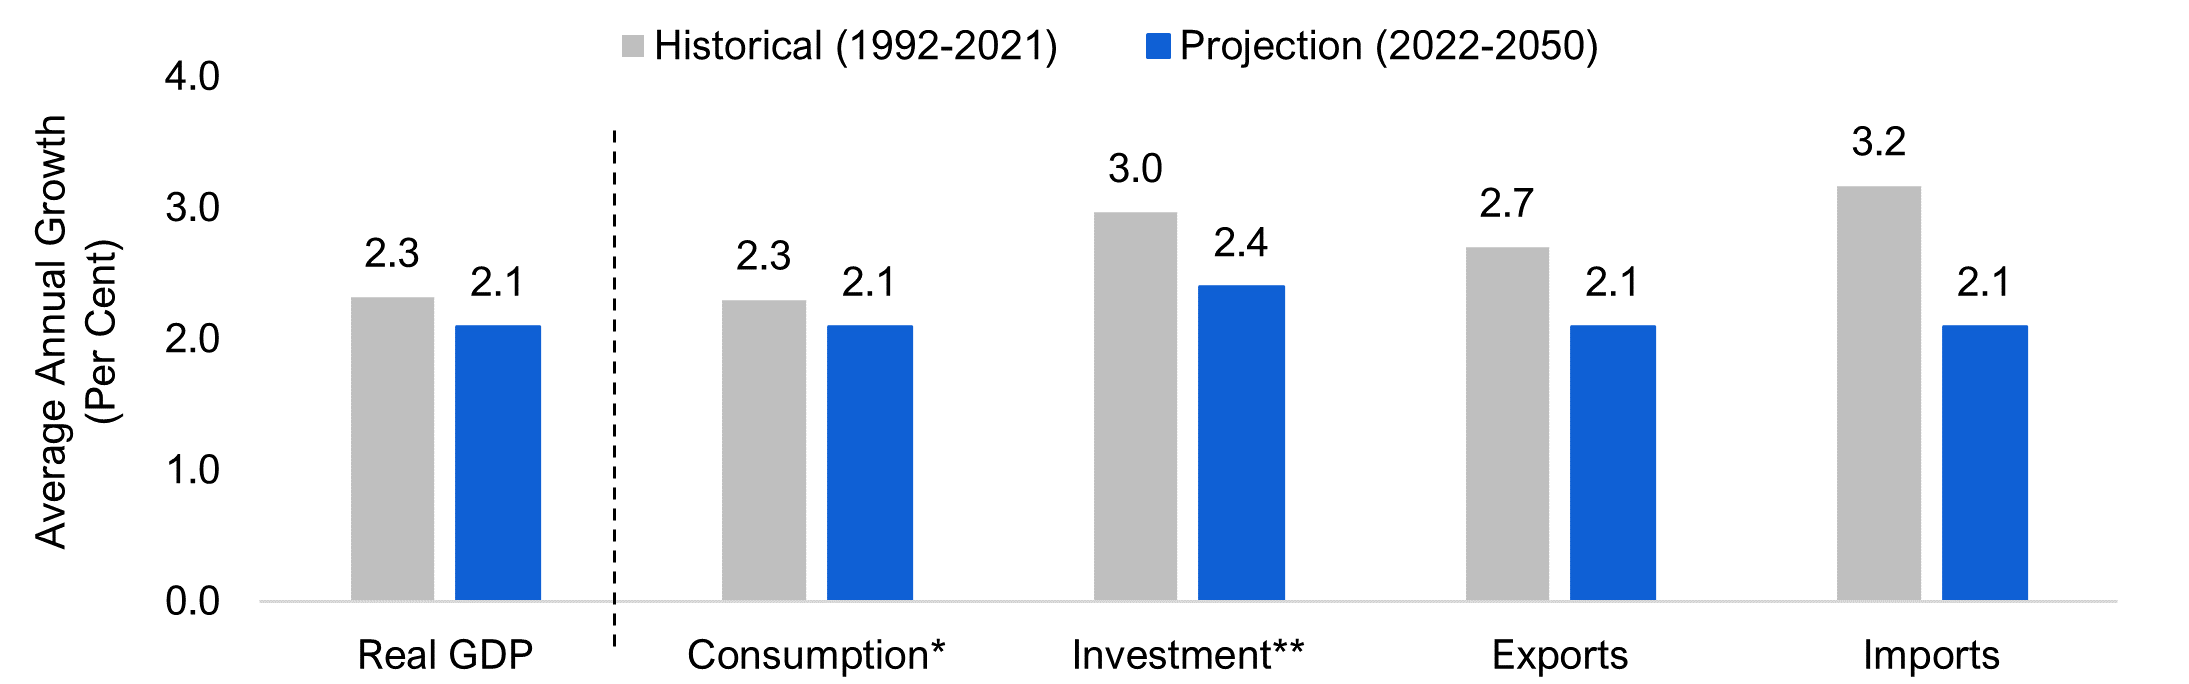
The FAO’s projection for slower economic growth is reflected across the outlook for each component of real GDP:
- Real consumption (i.e., spending excluding the effects of price inflation) is projected to grow at an average rate of 2.1 per cent per year, as household spending eventually grows in-line with real income gains.
- Real investment is projected to increase by 2.4 per cent per year on average, reflecting moderate growth in business investment and residential construction spending growth broadly aligned with demographic drivers.
- Real imports and exports are forecast to grow more slowly over the projection than in the past, as the slowdown in the pace of global trade integration continues.
Chart 4-2 Growth in Ontario real GDP components
* Includes household consumption and government current expenditures.
** Includes residential investment, business investment and government capital expenditures.
Source: Ontario Economic Accounts, and FAO.
Aggregate income shares for labour and business are expected to remain broadly consistent with the pre-pandemic distribution of economy-wide incomes. While income shares of GDP can fluctuate over business cycles, they have been largely stable since the early 2000s up to the start of the COVID-19 pandemic.
Assumptions Driving the Economic Outlook
The FAO’s economic outlook is based on demographic projections in which moderating population growth and an aging population lead to slower labour force growth. At the same time, productivity growth is expected to moderate.
Ontario’s population growth to moderate
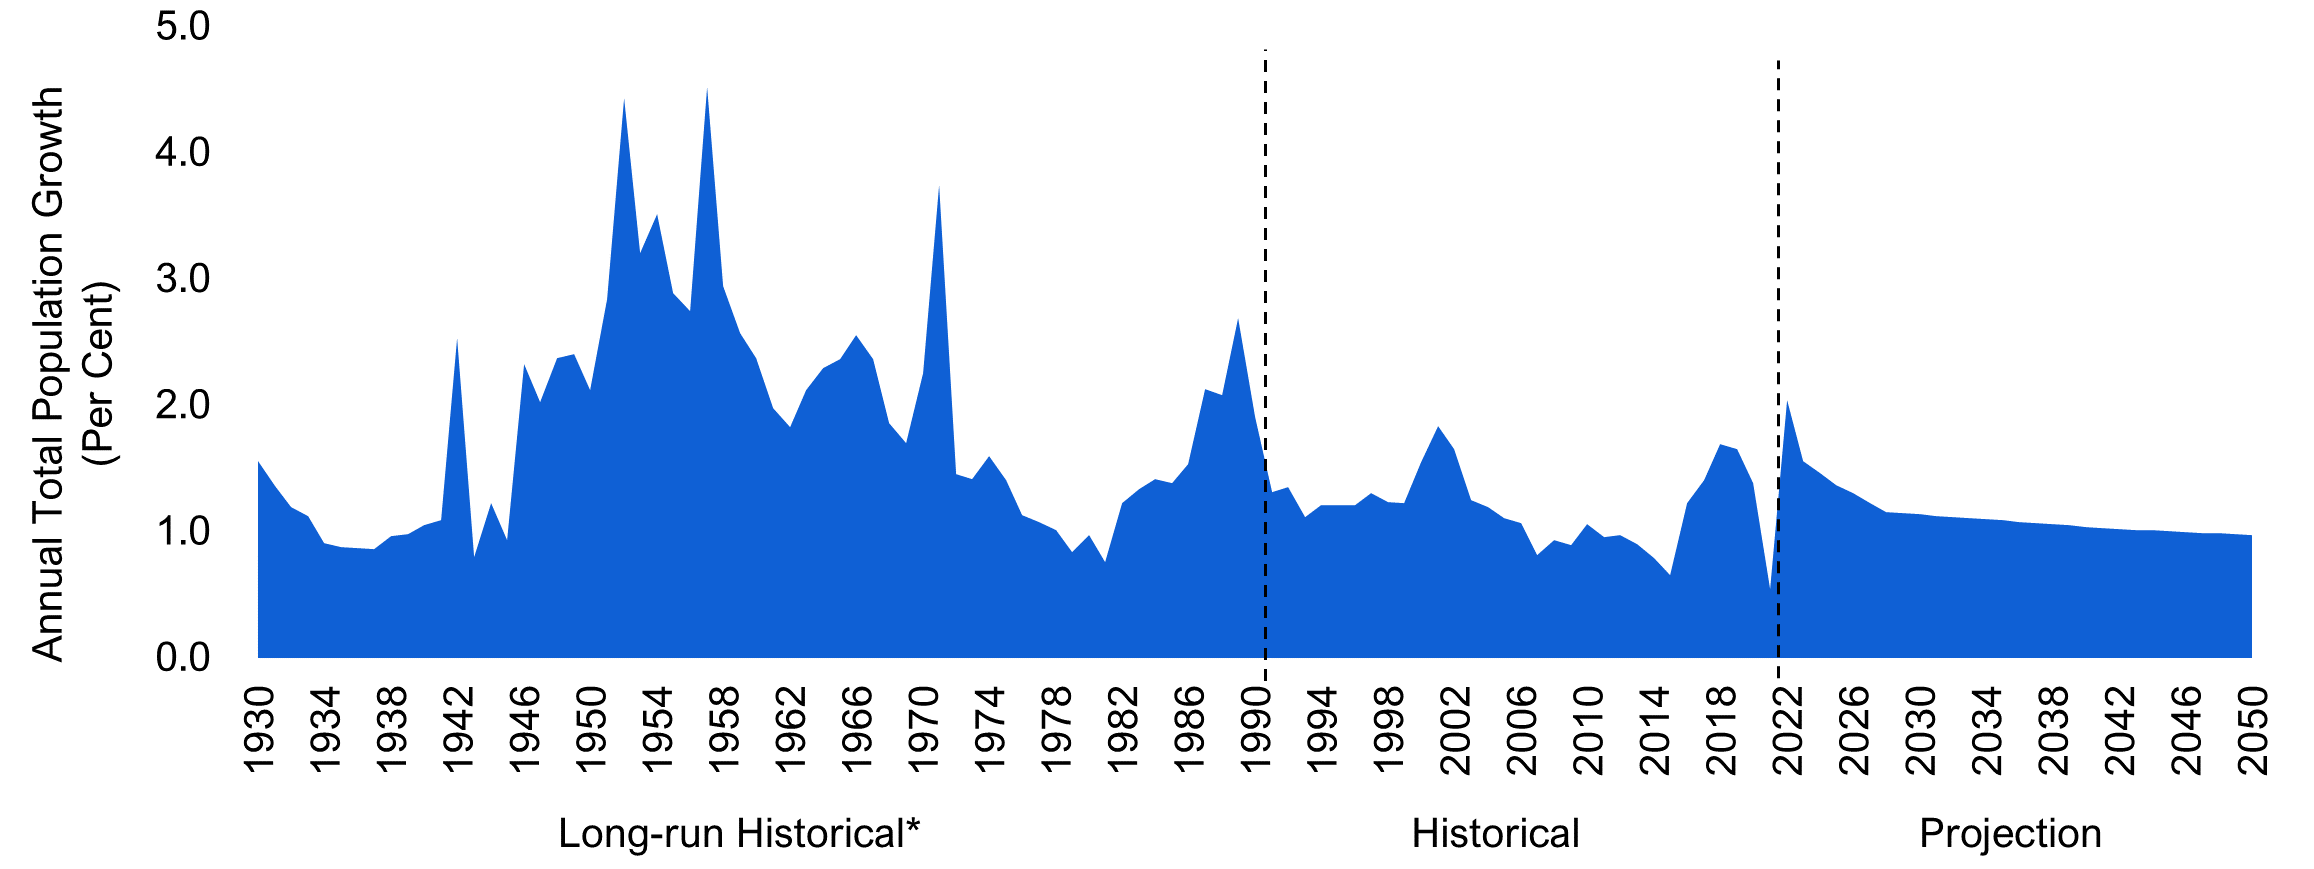
The COVID-19 pandemic affected all demographic components of Ontario’s population growth in 2020-21. As border restrictions are lifted and immigration backlogs are processed, total population is expected to increase at a faster pace in 2022 than in the pre-pandemic period. Over the next 30 years, Ontario’s population growth is projected to grow by an average of 1.1 per cent annually compared with 1.2 per cent over the 1992 to 2021 period.
Chart 4-3 Total population growth to moderate in Ontario
* Long-run provincial data from Statistics Canada Table 36-10-0229-01.
Source: Statistics Canada and FAO.
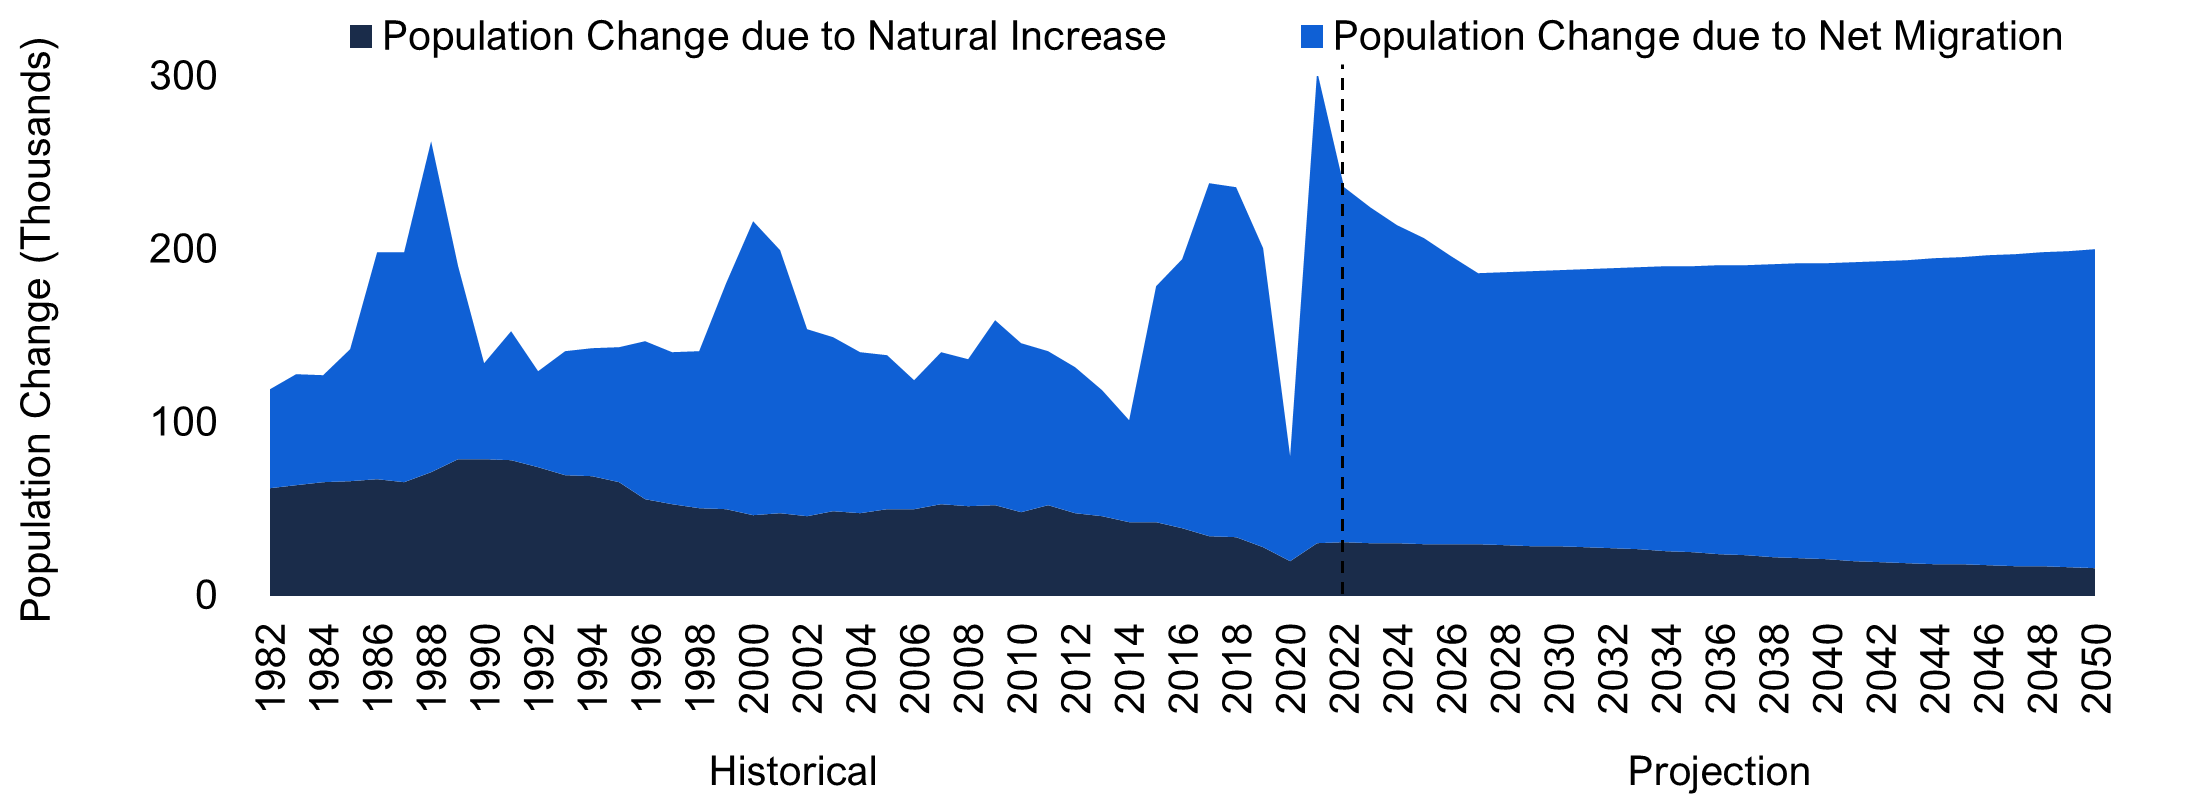
Population growth can occur through both natural increase (when births exceed deaths) and positive net migration (when in-migration exceeds out-migration). Over the longer term, natural increases will gradually moderate as the echo boomers enter retirement age and baby boomers reach the end of their life expectancy.[32] Ontario will become increasingly dependent on net migration, especially international immigration, to drive future population growth. The contribution of net migration to population growth is projected to rise from its historical average of 65 per cent to over 90 per cent by 2050. By 2050, a projected 20.6 million people will be living in Ontario.
Chart 4-4 Net migration expected to increasingly drive population growth in Ontario
Source: Statistics Canada and FAO.
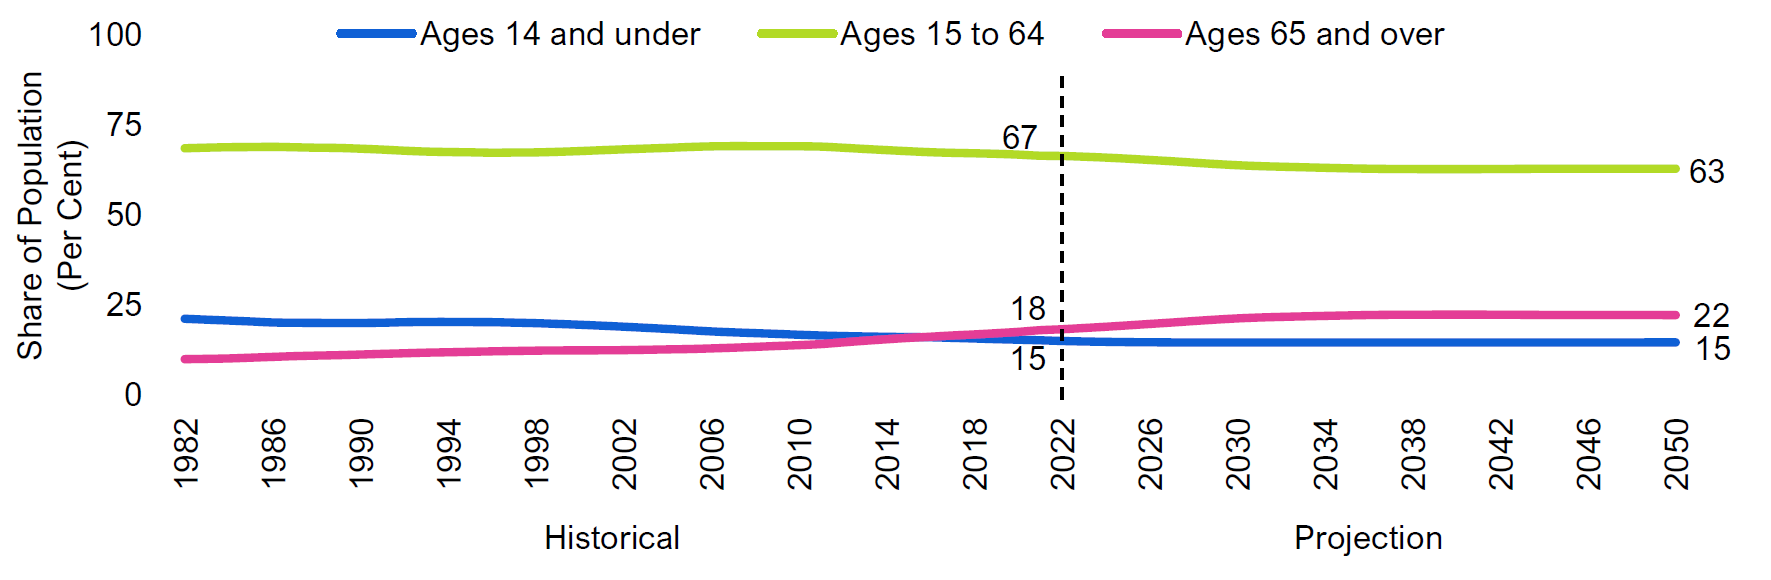
Ontario is also expected to experience an older population age structure over the projection period. Over the outlook, Ontario’s working-age population is expected to decline from 67 per cent of the total population in 2021 to 63 per cent by 2050 as the cohort of baby boomers and Generation X will have entered their senior years.[33] The share of seniors in the population is expected to rise from 18 per cent to 22 per cent over the period. The share of children aged 14 and under is expected to remain stable at around 15 per cent of the population.
Chart 4-5 The share of seniors in the population will continue to rise
Source: Statistics Canada and FAO.
Ontario’s labour force growth expected to slow
The growth in Ontario’s labour force depends on population growth in addition to the underlying age structure of the population.
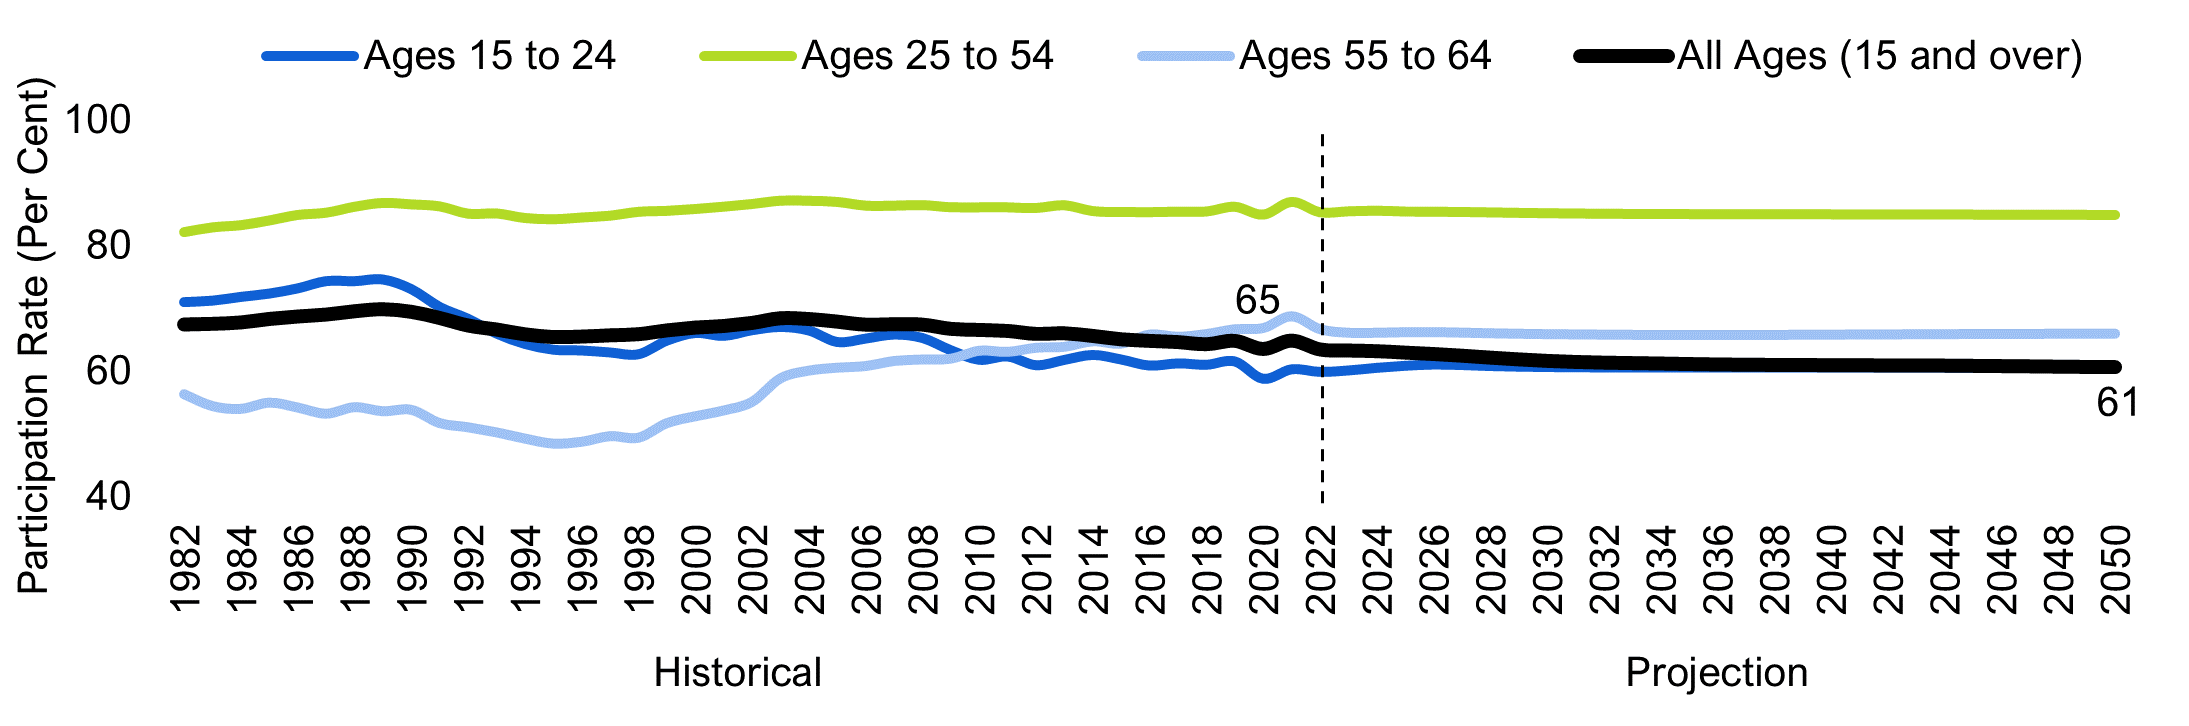
Since its peak in the late 1980s, the overall labour force participation rate in Ontario has generally trended lower even though the participation rate for core-age workers (ages 25 to 54) has remained relatively unchanged over the period. This decline in the overall participation rate is largely explained by population aging, as labour market engagement tends to fall as the workforce grows older. Over the outlook, the FAO projects Ontario’s aggregate labour force participation rate will decrease from 65 per cent in 2021 to 61 per cent by 2050.
Chart 4-6 Ontario’s overall labour force participation rate will decline
Source: Statistics Canada and FAO.
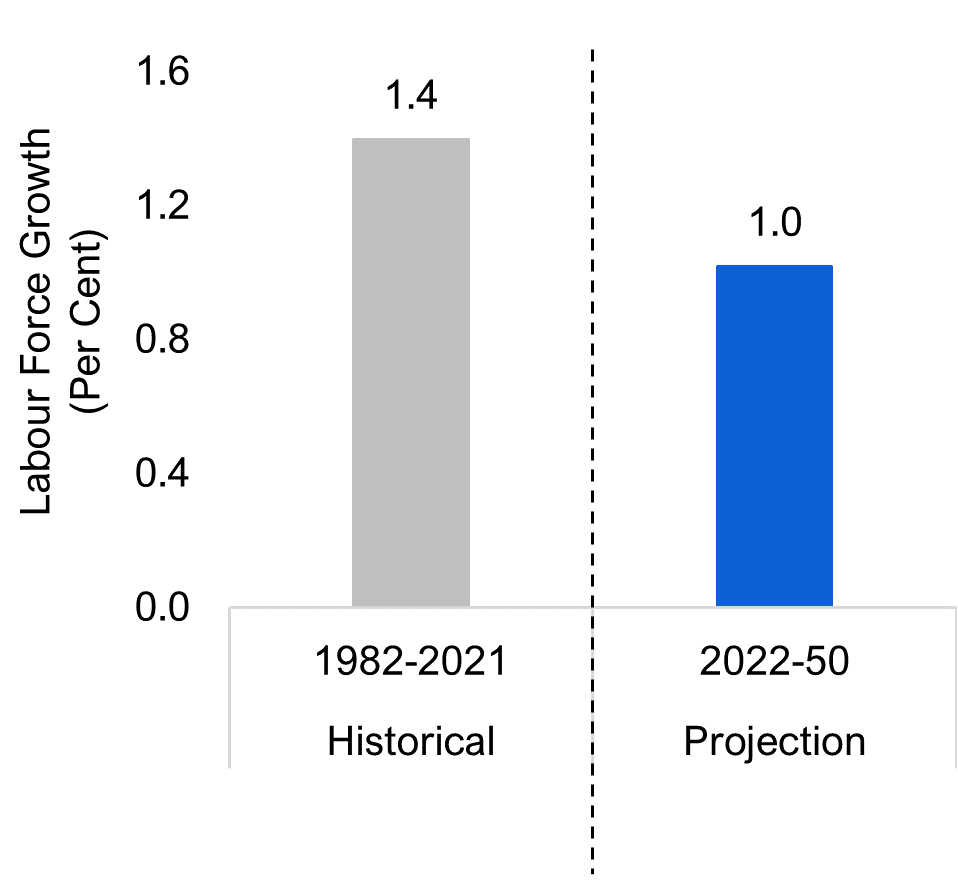
Chart 4-7 Ontario’s labour force growth expected to slow
Source: Ontario Economic Accounts, and FAO.
The projection for slower population growth combined with a lower overall rate of labour force participation results in weaker growth for Ontario’s labour force over the outlook. Labour force growth is projected to average 1.0 per cent annually over the outlook, down from 1.4 per cent over the 1982 to 2021 period. Weaker labour force growth is a primary contributor to the forecast for slower economic growth over the outlook compared to the past.
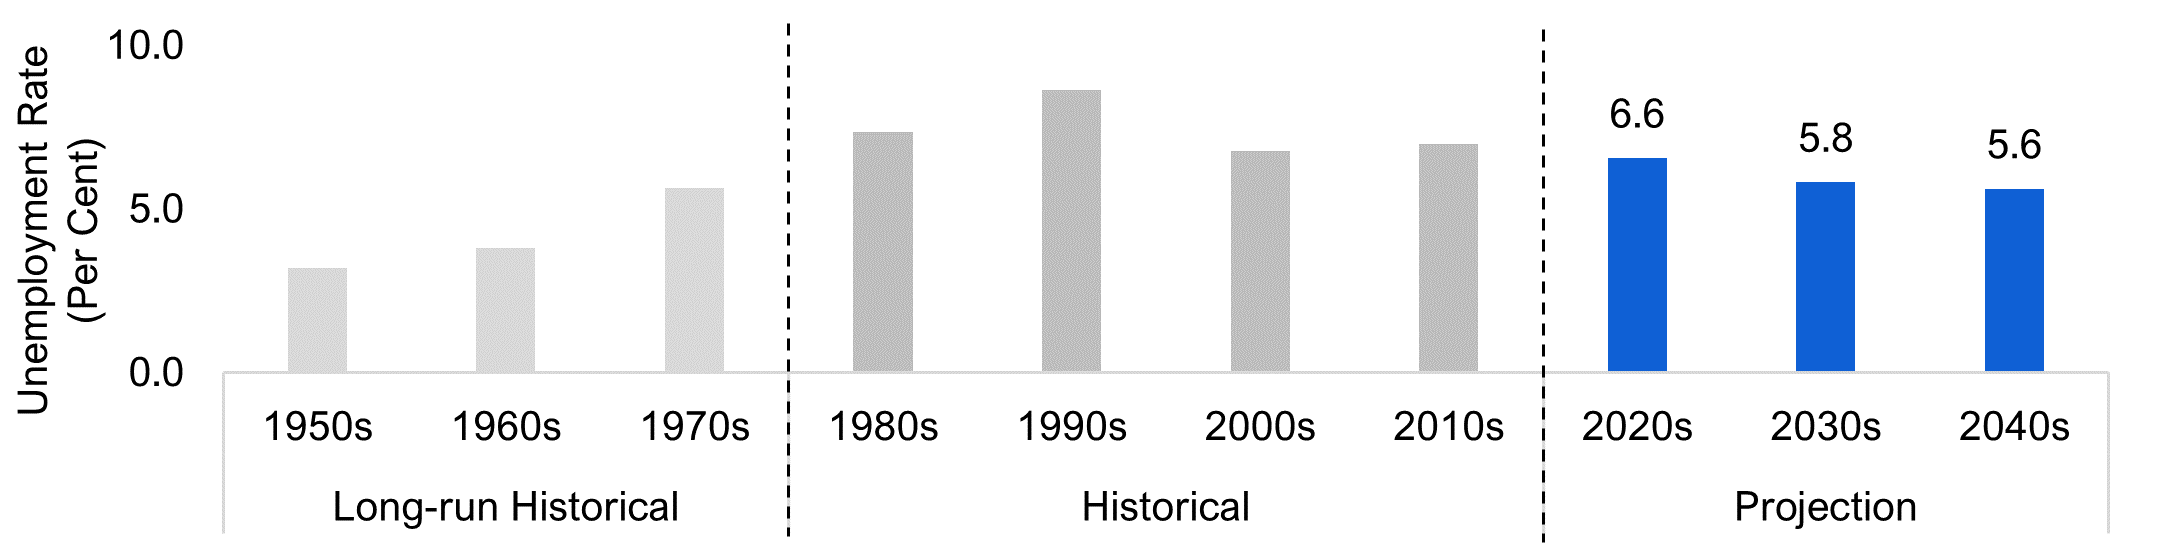
Following significant job losses during the pandemic, employment recovered to pre-pandemic levels in 2021, although the pace has been uneven across industries.[34] As the economy continues to improve over the next several years, job gains are expected to remain strong and gradually moderate to average annual growth of 1.1 per cent over the outlook. Ontario’s annual unemployment rate is projected to trend down to pre-pandemic levels towards the mid-2020s, followed by a steady decline to a stable long-run average of 5.6 per cent in the 2040s.
Chart 4-8 Ontario’s unemployment rate expected to trend lower over outlook
Source: Statistics Canada and FAO.
Ontario’s labour productivity to grow below historical average
Chart 4-9 Ontario’s labour productivity expected to grow below historical average
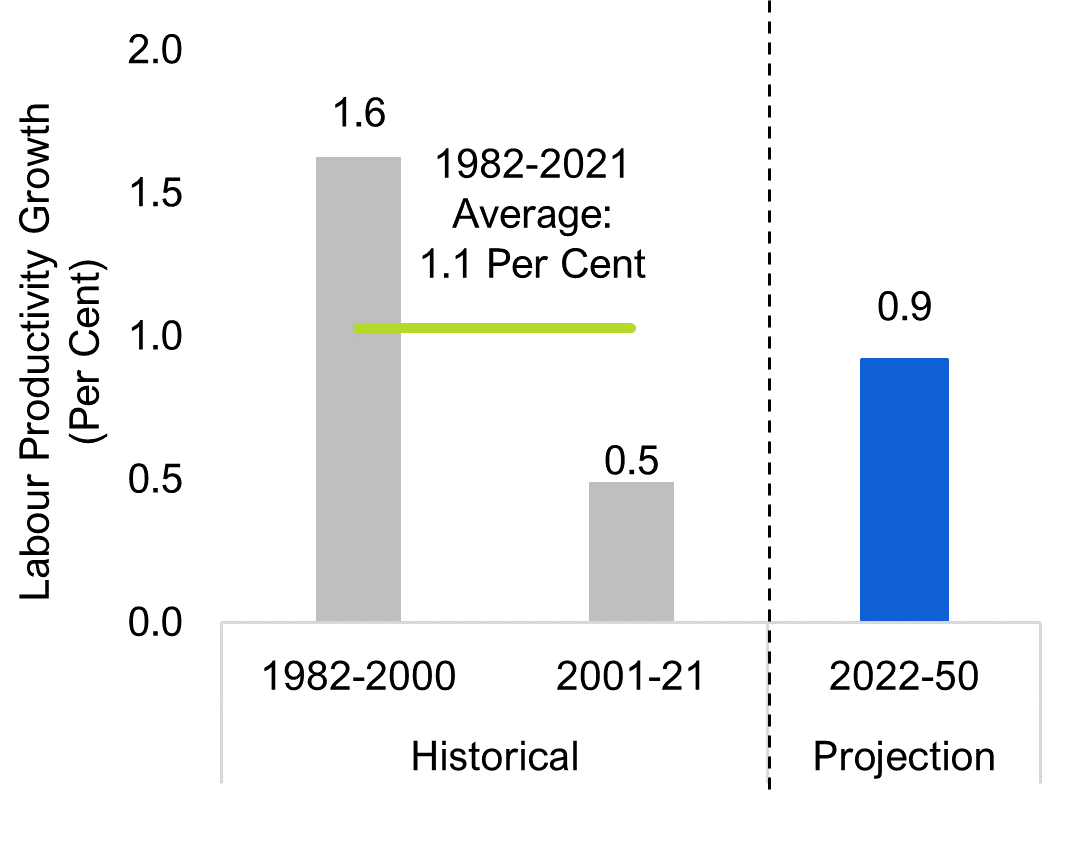
Source: Ontario Economic Accounts, and FAO.
Labour productivity measures how efficiently an economy’s workers produce goods and services, and is a key determinant of economic growth in long-term projections.[35] Ontario’s productivity growth has been slowing, particularly since the late 1990s, reflecting in part the relatively weak performance of the province’s export sector, which faced intense competition from low-cost jurisdictions. This contributed to a broad structural shift in the composition of the province’s economy, with high-productivity manufacturing jobs being replaced by less productive service-sector jobs.[36]
The FAO’s projection assumes productivity will rise by an average of 0.9 per cent annually, consistent with the consensus outlook of other long-term forecasters. The expectation of relatively moderate productivity growth over the outlook is a key contributor to the projection for slower economic growth.
Interest rates to rise in the short term and then stabilize
Over the long term, interest rates are assumed to stay below average historical yields, reflecting relatively modest economic growth over the projection, coupled with continued inflation targeting by central banks.[37] The Government of Canada 10-year bond yield is assumed to maintain a steady spread with the US government 10-year bond yield. The spread between Ontario Government and Government of Canada 10-year bond yields is assumed to average 0.5 percentage points over the projection.
Chart 4-10 Ontario and Government of Canada 10-year bond yields assumed to be stable in the long term
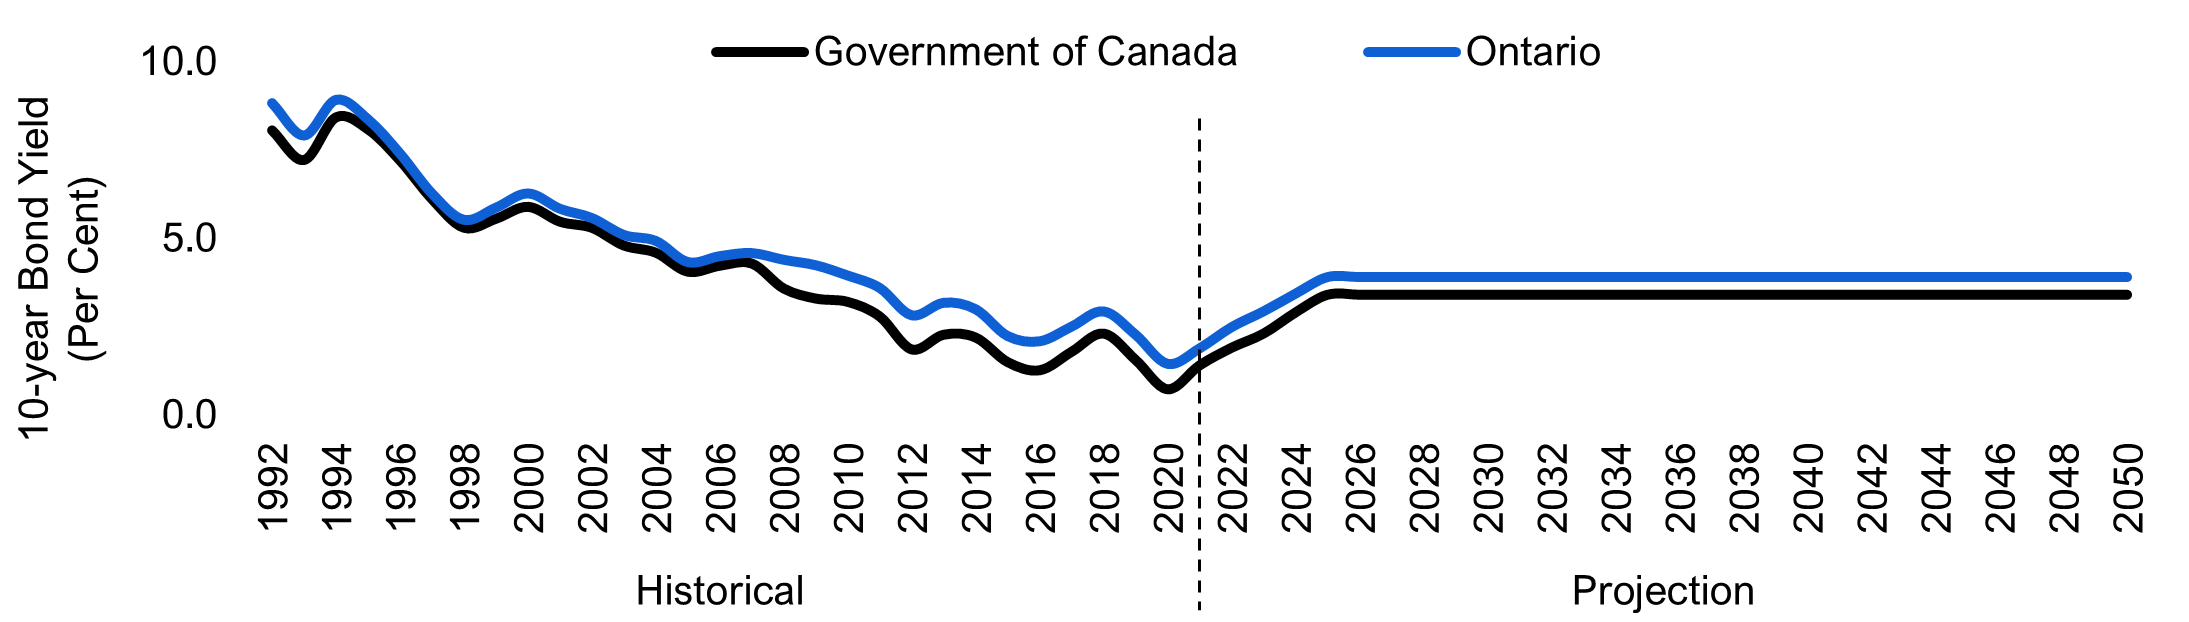
Source: Statistics Canada and FAO.
Assumptions for key external factors that influence Ontario’s economy, including US economic growth, interest rates, the Canada-US exchange rate and energy prices, are presented in Appendix A3 Table 7-2.
Uncertainty in economic projections
The rebound in Ontario’s economic growth from the pandemic has been stronger than expected, and real GDP is projected to surpass pre-pandemic levels in 2022. However, Ontario’s economy faces several risks that could lead to a slower recovery over the next several years.
Ongoing issues including new COVID-19 outbreaks, supply chain challenges and inflationary pressures could extend the burdens faced by households and businesses from disrupted livelihoods and higher costs. The uneven pace of recovery across sectors could also last longer as the pandemic lingers. Employment in several industries is still well below pre-pandemic levels,[38] and the increase in average wages in many sectors has trailed inflation. Recovery in trade, which has been weaker compared with the rebound in household consumption and business investment, could be affected by the reshoring of North American businesses, and by potential global trade disputes.
In addition to these risks, a 30-year demographic and economic projection requires many assumptions and involves significant uncertainty. While the International Monetary Fund expects limited lasting damage from the COVID-19 pandemic for advanced economies,[39] unanticipated geopolitical developments[40] and other long-term issues could affect Ontario’s outlook.
Climate change and policies to combat climate change will have significant and lasting impacts on the economy, incomes, tax revenues and spending. Ontario has been subject to costly floods and ice storms in the past and could face more severe consequences from climate hazards as extreme temperatures and precipitation continue to rise.[41] The severity of economic and societal impacts from climate change will depend on efforts to limit the increase in global mean temperatures compared to pre-industrial levels.[42] The FAO’s current projection assumes that climate change does not materially affect Ontario’s economy in the long term.
Income inequality in Ontario has increased over the past four decades, consistent with the experience in other provinces and developed economies.[43] Although COVID-19 support measures helped lower income inequality during the pandemic,[44] the long-term trend of increasing income and wealth inequality is expected to continue. Research has suggested that this trend over the long term can negatively impact the pace and durability of economic growth.[45]
Continued technological change and digitalization could impact the composition of the labour market as many jobs become automated or obsolete and new occupations are created. Digital technologies, essential for sustaining economic activity during the pandemic,[46] are expected to play increasingly significant roles in the economy and support productivity growth. The prevalence of non-standard employment is also expected to increase, potentially at the expense of more traditional permanent jobs. The changing composition of employment could impact income growth in the long term, while technological advances will continue to affect Ontario’s industrial composition.
5 | Appendix A1
| Organization Name | Definition | |
|---|---|---|
| Office of the Parliamentary Budget Officer (PBO) | Government debt does not grow continuously as a share of the economy.[47] | |
| Organisation for Economic Co-operation and Development (OECD) | The ability of a government to maintain public finances at a credible and serviceable position over the long term.[48] | |
| International Monetary Fund (IMF) | A situation in which a borrower is expected to be able to continue servicing its debts without an unrealistically large future correction to the balance of income and expenditure.[49] | |
| European Commission | The ability of a government to sustain its current spending, tax and other related policies in the long run without threatening its solvency or defaulting on some of its liabilities or promised expenditures.[50] | |
| Parliamentary Budget Office (Australia) | Government’s ability to maintain its long-term fiscal policy arrangements indefinitely, without the need for major remedial policy action.[51] | |
| Change Beginning in 2021-22 | Change in net debt-to-GDP ratio from base case in 2050-51 | Change in interest on debt to revenue ratio from base case in 2050-51 | |
|---|---|---|---|
| Tax Policy | |||
| A sustained 5 per cent increase/decrease in Personal Income Tax revenues ($189 per tax filer in 2021-22) over the projection | +/- 12.2 percentage points | +/- 2.9 percentage points | |
| A sustained 1 percentage point increase/decrease in the general Corporations Tax rate over the projection | +/- 9.5 percentage points | +/- 2.2 percentage points | |
| Federal Transfers | |||
| A sustained 0.5 percentage point increase/ decrease in the annual growth of the Canada Health Transfer over the projection | +/- 10.5 percentage points | +/- 2.6 percentage points | |
| A sustained 0.5 percentage point increase/ decrease in the annual growth of the Canada Social Transfer over the projection | +/- 8.9 percentage points | +/- 2.1 percentage points | |
| Expenditure Policy | |||
| A sustained 0.5 percentage point increase/decrease in the growth rate of health spending over the projection | +/- 15.6 percentage points | +/- 3.5 percentage points | |
6 | Appendix A2
| Component (Per cent of GDP) |
Actual (Average) |
||||||
|---|---|---|---|---|---|---|---|
| 1991-92 to 2020-21 |
2021-22 to 2050-51 |
2024-25 to 2030-31 |
2031-32 to 2040-41 |
2041-40 to 2050-51 |
|||
| Total Revenue | 17.1 | 17.1 | 17.1 | 17.1 | 17.0 | ||
| Tax Revenue | 12.2 | 12.1 | 12.1 | 12.1 | 12.1 | ||
| Personal Income Tax | 4.2 | 4.5 | 4.4 | 4.5 | 4.7 | ||
| Corporations Tax | 1.6 | 1.8 | 1.9 | 1.8 | 1.7 | ||
| Harmonized Sales Tax | 2.9 | 3.3 | 3.2 | 3.3 | 3.3 | ||
| Other Tax Revenue | 3.4 | 2.5 | 2.6 | 2.5 | 2.3 | ||
| Transfer Revenue | 2.5 | 2.8 | 2.7 | 2.8 | 2.8 | ||
| Other Revenue | 2.4 | 2.2 | 2.3 | 2.2 | 2.2 | ||
| Total Expense | 18.4 | 18.0 | 17.5 | 17.8 | 18.4 | ||
| Program Expense | 16.6 | 16.6 | 16.3 | 16.4 | 16.8 | ||
| Health | 6.4 | 8.3 | 7.6 | 8.3 | 9.1 | ||
| Education | 3.6 | 3.0 | 3.0 | 3.0 | 2.9 | ||
| Other Program Expense | 6.6 | 5.3 | 5.7 | 5.2 | 4.7 | ||
| Public Debt Interest | 1.8 | 1.4 | 1.2 | 1.3 | 1.6 | ||
| Surplus (Deficit) | -1.3 | -1.2 | -0.4 | -0.7 | -1.3 | ||
| Net Debt | 30.0 | 40.5 | 37.6 | 35.7 | 38.5 | ||
| Primary Balance | 0.5 | 0.2 | 0.9 | 0.6 | 0.3 | ||
| IOD to revenue | 10.9 | 7.3 | 7.2 | 7.8 | 9.4 | ||
The FAO’s Program Spending Methodology
Program spending is assumed to grow in line with underlying cost drivers, such as inflation and population growth, in addition to historical levels of program enrichment.[52] However, for this report, the FAO has also costed current government policies and plans[53] over the near-term period of 2021-22 to 2030-31, which may not fully align with these underlying cost pressures.
The following tables show the FAO’s spending projections for the health, education and all ‘other’ programs sectors. For each sector, spending growth is broken down into its key drivers, including inflation, population growth, program enrichment, and the impact of current government policies.
Health Care Spending
Health sector spending is projected to grow at an average annual rate of 5.0 per cent over the near term, slightly above the historical average of 4.9 per cent, driven by the ongoing rise in the number of seniors, as well as higher inflation and population growth. Policy impacts are projected to reduce average annual health sector spending by 0.2 per cent over the near term, due in part to below-inflation compensation increases for physicians and hospital workers, slightly offset by higher projected spending in long-term care homes.[54]
| Average Growth (Per Cent) |
Historical | Projection | ||
|---|---|---|---|---|
| 1992-93 to 2019-20 |
2020-21 to 2030-31 |
2031-32 to 2050-51 |
2020-21 to 2050-51 |
|
| Health Inflation | 2.2 | 2.5 | 2.2 | 2.3 |
| Population Growth | 1.2 | 1.3 | 1.0 | 1.1 |
| Population Aging | 0.7 | 0.8 | 0.7 | 0.7 |
| Enrichment | 0.8 | 0.5 | 0.9 | 0.8 |
| Policy Impact | -0.2 | 0.0 | 0.0 | |
| Total | 4.9 | 5.0 | 4.9 | 4.9 |
From 2031-32 to 2050-51, health sector spending is projected to grow at an average annual rate of 4.9 per cent, consistent with the historical average. While overall population growth is projected to slightly moderate during the 2030s and 2040s, the FAO assumes that increased program enrichment will offset this reduced spending pressure.
Education Spending
Education sector spending is projected to grow at an average annual rate of 2.5 per cent over the near term, below the historical average of 3.0 per cent. While increased inflation and higher growth in the school-age population are expected to increase cost pressures, policy impacts are projected to reduce average annual spending growth by 0.9 per cent, due in part to below-inflation compensation increases for education sector workers, in addition to changes to cost-sharing agreements with municipalities for childcare transfer payments, and the Childcare Access and Relief from Expenses (CARE) tax credit.[55]
| Average Growth (Per Cent) |
Historical | Projection | ||
|---|---|---|---|---|
| 1992-93 to 2019-20 |
2020-21 to 2030-31 |
2031-32 to 2050-51 |
2020-21 to 2050-51 |
|
| Inflation | 1.8 | 2.3 | 2.0 | 2.1 |
| School-Age Population Growth | 0.5 | 0.7 | 1.0 | 0.9 |
| Enrichment | 0.8 | 0.4 | 0.7 | 0.6 |
| Policy Impact | -0.9 | 0.0 | -0.3 | |
| Total | 3.0 | 2.5 | 3.8 | 3.3 |
Beyond the near term, education sector spending is projected to grow at an average annual rate of 3.8 per cent during the 2030s and 2040s, which is above the historical average. Spending pressures during this period are projected based on an acceleration in the growth of the school-age population, inflation, and the assumption that program enrichment will grow at a similar rate to the historical trend.
‘Other’ Sector Program Spending[56]
The ‘other’ sector, which includes all program spending not accounted for in the health and education sectors, is projected to grow at an average annual rate of 2.7 per cent over the near term, below the historical average of 3.2 per cent. While higher inflation and population growth are expected to increase cost pressures, the FAO estimates that spending growth will be limited by certain policies and programs, including the Ontario Student Assistance Program (OSAP), and various energy and electricity subsidy programs.[57]
| Average Growth (Per Cent) |
Historical | Projection | ||
|---|---|---|---|---|
| 1992-93 to 2019-20 |
2020-21 to 2030-31 |
2031-32 to 2050-51 |
2020-21 to 2050-51 |
|
| Inflation | 1.8 | 2.3 | 2.0 | 2.1 |
| Population Growth | 1.2 | 1.3 | 1.0 | 1.1 |
| Enrichment | 0.2 | 0.1 | 0.1 | 0.1 |
| Policy Impact | -0.9 | -0.2 | -0.4 | |
| Total | 3.2 | 2.7 | 3.0 | 2.9 |
Beyond the near term, spending in the ‘other’ sector is projected to grow at an average annual rate of 3.0 per cent during the 2030s and 2040s. While cost pressures from inflation and population are expected to moderate towards historical levels during this period, increased program enrichment is expected to result in overall higher spending growth relative to the 2020s, but still lower than the historical average.[58]
7 | Appendix A3
| Average Growth (per cent) |
Historical | Projection | |||
|---|---|---|---|---|---|
| 1992-2021* | 2022-30 | 2031-40 | 2041-50 | 2022-40 | |
| Nominal GDP | |||||
| FAO | 4.1 | 4.2 | 3.9 | 3.9 | 4.0 |
| Consensus** Average | 4.3 | 3.9 | - | 4.1 | |
| Ontario Finance*** | - | - | - | 3.9 | |
| GDP Deflator | |||||
| FAO | 1.8 | 1.9 | 1.9 | 1.9 | 1.9 |
| Consensus Average | 1.9 | 1.9 | - | 1.9 | |
| Ontario Finance | - | - | 1.8 | ||
| Real GDP | |||||
| FAO | 2.3 | 2.2 | 2.0 | 2.0 | 2.1 |
| Consensus Average | 2.3 | 2.0 | - | 2.2 | |
| Ontario Finance | - | - | - | 2.0 | |
| Labour Force | |||||
| FAO | 1.2 | 1.1 | 1.0 | 1.0 | 1.0 |
| Consensus Average | 1.1 | 1.0 | - | 1.0 | |
| Ontario Finance | - | - | - | 0.9 | |
| Labour Productivity | |||||
| FAO | 1.0 | 0.9 | 0.9 | 0.9 | 0.9 |
| Consensus Average | 0.9 | 1.0 | - | 0.9 | |
| Ontario Finance | - | - | - | 1.1 | |
| Employment | |||||
| FAO | 1.3 | 1.3 | 1.0 | 1.0 | 1.2 |
| Consensus Average | 1.4 | 1.0 | - | 1.2 | |
| Ontario Finance | - | - | - | - | |
| Unemployment Rate | |||||
| FAO | 7.5 | 6.0 | 5.8 | 5.6 | 5.9 |
| Consensus Average | 6.4 | 5.9 | - | 6.1 | |
| Ontario Finance | - | - | - | - | |
| Population | |||||
| FAO | 1.2 | 1.4 | 1.1 | 1.0 | 1.2 |
| Consensus Average | 1.3 | 1.1 | - | 1.2 | |
| Ontario Finance | 1.5 | 1.1 | - | 1.2 | |
| Consumer Price Index | |||||
| FAO | 1.9 | 2.1 | 2.0 | 2.0 | 2.1 |
| Consensus Average | 2.1 | 2.0 | - | 2.0 | |
| Ontario Finance | - | - | - | 2.0 | |
| Average (Per Cent) |
Historical | Projection | |||
|---|---|---|---|---|---|
| 1992-2021* | 2022-30 | 2031-40 | 2041-50 | 2022-50 | |
| US Real GDP Growth (Per Cent) | 2.5 | 2.2 | 1.9 | 1.9 | 2.0 |
| US Unemployment Rate (Per Cent) | 5.9 | 4.1 | 4.2 | 4.1 | 4.1 |
| US 10-year Bond Yield (Per Cent) | 4.0 | 3.3 | 3.7 | 3.7 | 3.6 |
| Government of Canada 3-Month Treasury-Bill Rate (Per Cent) | 2.7 | 2.1 | 2.3 | 2.3 | 2.2 |
| Government of Canada 10-year Bond Yield (Per Cent) | 4.1 | 3.1 | 3.4 | 3.4 | 3.3 |
| Ontario 10-year Bond Yield (Per Cent) | 4.7 | 3.6 | 3.9 | 3.9 | 3.8 |
| West-Texas Intermediate Oil Price per Barrel (US $) | 50 | 74 | 103 | 148 | 109 |
| Canada-US Exchange Rate (US Cents) | 80 | 79 | 78 | 78 | 78 |
| Canada Real GDP Growth (Per Cent) | 2.2 | 2.3 | 2.0 | 2.0 | 2.1 |
The FAO’s Economic and Fiscal Projections
The FAO’s economic projection forecasts average or trend growth over the long term. It does not attempt to predict future business cycles – the normal cyclical swings that all economies experience.
The FAO’s fiscal projection is based on existing and announced policies. The FAO’s revenue projections are based on an assessment of the outlook for the provincial economy, current tax system and policies, and federal-provincial fiscal arrangements. The FAO’s program spending projections are based on current and announced government policies, and on the outlook for underlying cost drivers including demographics, price inflation, and long-term average rates of program enrichment.
All average annual growth rates in this report are calculated using the year before the first indicated year as the base. The near term refers to the 2020-21 to 2030-31 period and the long term refers to the 2031-32 to the 2050-51 period.
Graphical Descriptions
| Year | Primary Budget Balance as a Share of GDP (Per Cent) | |
|---|---|---|
| Historical | 1981-82 | -0.4 |
| 1982-83 | -1.2 | |
| 1983-84 | -0.7 | |
| 1984-85 | -0.1 | |
| 1985-86 | 0.1 | |
| 1986-87 | 0.3 | |
| 1987-88 | 0.4 | |
| 1988-89 | 0.9 | |
| 1989-90 | 1.4 | |
| 1990-91 | 0.3 | |
| 1991-92 | -2.3 | |
| 1992-93 | -2.4 | |
| 1993-94 | -1.3 | |
| 1994-95 | -0.7 | |
| 1995-96 | -0.1 | |
| 1996-97 | 0.5 | |
| 1997-98 | 1.3 | |
| 1998-99 | 1.8 | |
| 1999-00 | 2.8 | |
| 2000-01 | 2.8 | |
| 2001-02 | 2.2 | |
| 2002-03 | 2.1 | |
| 2003-04 | 0.5 | |
| 2004-05 | 1.4 | |
| 2005-06 | 1.7 | |
| 2006-07 | 1.9 | |
| 2007-08 | 1.5 | |
| 2008-09 | 1.0 | |
| 2009-10 | -1.7 | |
| 2010-11 | -1.1 | |
| 2011-12 | -0.7 | |
| 2012-13 | 0.0 | |
| 2013-14 | -0.1 | |
| 2014-15 | 0.0 | |
| 2015-16 | 0.8 | |
| 2016-17 | 1.2 | |
| 2017-18 | 1.0 | |
| 2018-19 | 0.6 | |
| 2019-20 | 0.4 | |
| 2020-21 | -0.5 | |
| Projection | 2021-22 | -0.4 |
| 2022-23 | 0.5 | |
| 2023-24 | 0.9 | |
| 2024-25 | 0.8 | |
| 2025-26 | 0.8 | |
| 2026-27 | 0.8 | |
| 2027-28 | 0.9 | |
| 2028-29 | 0.9 | |
| 2029-30 | 0.9 | |
| 2030-31 | 0.9 | |
| 2031-32 | 0.8 | |
| 2032-33 | 0.8 | |
| 2033-34 | 0.7 | |
| 2034-35 | 0.7 | |
| 2035-36 | 0.7 | |
| 2036-37 | 0.6 | |
| 2037-38 | 0.6 | |
| 2038-39 | 0.5 | |
| 2039-40 | 0.5 | |
| 2040-41 | 0.4 | |
| 2041-42 | 0.4 | |
| 2042-43 | 0.3 | |
| 2043-44 | 0.3 | |
| 2044-45 | 0.3 | |
| 2045-46 | 0.3 | |
| 2046-47 | 0.2 | |
| 2047-48 | 0.2 | |
| 2048-49 | 0.2 | |
| 2049-50 | 0.2 | |
| 2050-51 | 0.2 | |
| Long-term Historical Average | 0.4 | |
| Long-term Forecast Average | 0.6 | |
| Year | Budget Balance as a Share of GDP (Per Cent) | |
|---|---|---|
| Historical | 1981-82 | -1.3 |
| 1982-83 | -2.3 | |
| 1983-84 | -2.0 | |
| 1984-85 | -1.5 | |
| 1985-86 | -1.3 | |
| 1986-87 | -1.2 | |
| 1987-88 | -1.1 | |
| 1988-89 | -0.6 | |
| 1989-90 | 0.0 | |
| 1990-91 | -1.1 | |
| 1991-92 | -3.8 | |
| 1992-93 | -4.2 | |
| 1993-94 | -3.7 | |
| 1994-95 | -3.2 | |
| 1995-96 | -2.6 | |
| 1996-97 | -2.0 | |
| 1997-98 | -1.1 | |
| 1998-99 | -0.5 | |
| 1999-00 | 0.2 | |
| 2000-01 | 0.4 | |
| 2001-02 | 0.0 | |
| 2002-03 | 0.1 | |
| 2003-04 | -1.4 | |
| 2004-05 | -0.4 | |
| 2005-06 | 0.0 | |
| 2006-07 | 0.3 | |
| 2007-08 | 0.0 | |
| 2008-09 | -0.5 | |
| 2009-10 | -3.2 | |
| 2010-11 | -2.7 | |
| 2011-12 | -2.3 | |
| 2012-13 | -1.6 | |
| 2013-14 | -1.7 | |
| 2014-15 | -1.5 | |
| 2015-16 | -0.7 | |
| 2016-17 | -0.3 | |
| 2017-18 | -0.4 | |
| 2018-19 | -0.9 | |
| 2019-20 | -1.0 | |
| 2020-21 | -1.9 | |
| Projection | 2021-22 | -1.6 |
| 2022-23 | -0.7 | |
| 2023-24 | -0.3 | |
| 2024-25 | -0.4 | |
| 2025-26 | -0.4 | |
| 2026-27 | -0.4 | |
| 2027-28 | -0.4 | |
| 2028-29 | -0.4 | |
| 2029-30 | -0.4 | |
| 2030-31 | -0.4 | |
| 2031-32 | -0.4 | |
| 2032-33 | -0.5 | |
| 2033-34 | -0.6 | |
| 2034-35 | -0.6 | |
| 2035-36 | -0.7 | |
| 2036-37 | -0.7 | |
| 2037-38 | -0.8 | |
| 2038-39 | -0.8 | |
| 2039-40 | -0.9 | |
| 2040-41 | -1.0 | |
| 2041-42 | -1.1 | |
| 2042-43 | -1.1 | |
| 2043-44 | -1.2 | |
| 2044-45 | -1.3 | |
| 2045-46 | -1.3 | |
| 2046-47 | -1.4 | |
| 2047-48 | -1.4 | |
| 2048-49 | -1.5 | |
| 2049-50 | -1.5 | |
| 2050-51 | -1.6 | |
| Long-term Historical Average | -1.3 | |
| Long-term Forecast Average | -0.7 | |
| Year | Net Debt as a Share of GDP (Per Cent) |
|
|---|---|---|
| Historical | 1981-82 | 10.4 |
| 1982-83 | 12.1 | |
| 1983-84 | 12.8 | |
| 1984-85 | 12.9 | |
| 1985-86 | 14.9 | |
| 1986-87 | 14.8 | |
| 1987-88 | 14.4 | |
| 1988-89 | 13.6 | |
| 1989-90 | 12.5 | |
| 1990-91 | 13.4 | |
| 1991-92 | 17.1 | |
| 1992-93 | 21.1 | |
| 1993-94 | 26.6 | |
| 1994-95 | 28.3 | |
| 1995-96 | 30.1 | |
| 1996-97 | 31.2 | |
| 1997-98 | 30.5 | |
| 1998-99 | 29.4 | |
| 1999-00 | 32.1 | |
| 2000-01 | 29.3 | |
| 2001-02 | 28.2 | |
| 2002-03 | 26.8 | |
| 2003-04 | 27.5 | |
| 2004-05 | 26.8 | |
| 2005-06 | 27.8 | |
| 2006-07 | 27.1 | |
| 2007-08 | 26.6 | |
| 2008-09 | 27.8 | |
| 2009-10 | 32.3 | |
| 2010-11 | 34.5 | |
| 2011-12 | 36.6 | |
| 2012-13 | 38.2 | |
| 2013-14 | 39.7 | |
| 2014-15 | 40.5 | |
| 2015-16 | 40.3 | |
| 2016-17 | 39.7 | |
| 2017-18 | 39.3 | |
| 2018-19 | 39.4 | |
| 2019-20 | 39.6 | |
| 2020-21 | 43.9 | |
| Projection | 2021-22 | 41.0 |
| 2022-23 | 39.8 | |
| 2023-24 | 39.0 | |
| 2024-25 | 38.6 | |
| 2025-26 | 38.3 | |
| 2026-27 | 37.9 | |
| 2027-28 | 37.6 | |
| 2028-29 | 37.2 | |
| 2029-30 | 36.8 | |
| 2030-31 | 36.5 | |
| 2031-32 | 36.2 | |
| 2032-33 | 35.9 | |
| 2033-34 | 35.7 | |
| 2034-35 | 35.6 | |
| 2035-36 | 35.5 | |
| 2036-37 | 35.4 | |
| 2037-38 | 35.5 | |
| 2038-39 | 35.6 | |
| 2039-40 | 35.7 | |
| 2040-41 | 36.0 | |
| 2041-42 | 36.3 | |
| 2042-43 | 36.7 | |
| 2043-44 | 37.1 | |
| 2044-45 | 37.5 | |
| 2045-46 | 38.0 | |
| 2046-47 | 38.6 | |
| 2047-48 | 39.2 | |
| 2048-49 | 39.8 | |
| 2049-50 | 40.4 | |
| 2050-51 | 41.0 | |
| Long-term Historical Average | 27.2 | |
| Long-term Forecast Average | 36.2 | |
| Year | Interest on Debt as a Share of Revenue (Per Cent) | |
|---|---|---|
| Historical | 1981-82 | 6.0 |
| 1982-83 | 7.3 | |
| 1983-84 | 8.7 | |
| 1984-85 | 9.2 | |
| 1985-86 | 9.5 | |
| 1986-87 | 9.7 | |
| 1987-88 | 9.6 | |
| 1988-89 | 9.1 | |
| 1989-90 | 8.2 | |
| 1990-91 | 7.7 | |
| 1991-92 | 8.8 | |
| 1992-93 | 10.8 | |
| 1993-94 | 13.9 | |
| 1994-95 | 14.5 | |
| 1995-96 | 14.6 | |
| 1996-97 | 14.8 | |
| 1997-98 | 14.2 | |
| 1998-99 | 14.3 | |
| 1999-00 | 15.5 | |
| 2000-01 | 15.0 | |
| 2001-02 | 14.2 | |
| 2002-03 | 12.9 | |
| 2003-04 | 12.9 | |
| 2004-05 | 11.1 | |
| 2005-06 | 9.7 | |
| 2006-07 | 8.9 | |
| 2007-08 | 8.4 | |
| 2008-09 | 8.7 | |
| 2009-10 | 8.9 | |
| 2010-11 | 8.8 | |
| 2011-12 | 9.1 | |
| 2012-13 | 9.0 | |
| 2013-14 | 9.1 | |
| 2014-15 | 8.9 | |
| 2015-16 | 8.5 | |
| 2016-17 | 8.3 | |
| 2017-18 | 7.9 | |
| 2018-19 | 8.1 | |
| 2019-20 | 8.0 | |
| 2020-21 | 7.4 | |
| Projection | 2021-22 | 7.3 |
| 2022-23 | 7.1 | |
| 2023-24 | 6.9 | |
| 2024-25 | 6.9 | |
| 2025-26 | 7.1 | |
| 2026-27 | 7.2 | |
| 2027-28 | 7.3 | |
| 2028-29 | 7.3 | |
| 2029-30 | 7.4 | |
| 2030-31 | 7.4 | |
| 2031-32 | 7.5 | |
| 2032-33 | 7.5 | |
| 2033-34 | 7.6 | |
| 2034-35 | 7.7 | |
| 2035-36 | 7.8 | |
| 2036-37 | 7.9 | |
| 2037-38 | 8.0 | |
| 2038-39 | 8.1 | |
| 2039-40 | 8.3 | |
| 2040-41 | 8.4 | |
| 2041-42 | 8.6 | |
| 2042-43 | 8.7 | |
| 2043-44 | 8.9 | |
| 2044-45 | 9.1 | |
| 2045-46 | 9.3 | |
| 2046-47 | 9.5 | |
| 2047-48 | 9.7 | |
| 2048-49 | 10.0 | |
| 2049-50 | 10.2 | |
| 2050-51 | 10.4 | |
| Long-term Historical Average | 10.3 | |
| Long-term Forecast Average | 7.8 | |
| Year | History | Base Projection | Higher Rates Scenario |
|---|---|---|---|
| 1981-82 | 10.4 | ||
| 1982-83 | 12.1 | ||
| 1983-84 | 12.8 | ||
| 1984-85 | 12.9 | ||
| 1985-86 | 14.9 | ||
| 1986-87 | 14.8 | ||
| 1987-88 | 14.4 | ||
| 1988-89 | 13.6 | ||
| 1989-90 | 12.5 | ||
| 1990-91 | 13.4 | ||
| 1991-92 | 17.1 | ||
| 1992-93 | 21.1 | ||
| 1993-94 | 26.6 | ||
| 1994-95 | 28.3 | ||
| 1995-96 | 30.1 | ||
| 1996-97 | 31.2 | ||
| 1997-98 | 30.5 | ||
| 1998-99 | 29.4 | ||
| 1999-00 | 32.1 | ||
| 2000-01 | 15.0 | ||
| 2001-02 | 28.2 | ||
| 2002-03 | 26.8 | ||
| 2003-04 | 27.5 | ||
| 2004-05 | 26.8 | ||
| 2005-06 | 27.8 | ||
| 2006-07 | 27.1 | ||
| 2007-08 | 26.6 | ||
| 2008-09 | 27.8 | ||
| 2009-10 | 32.3 | ||
| 2010-11 | 34.5 | ||
| 2011-12 | 36.6 | ||
| 2012-13 | 38.2 | ||
| 2013-14 | 39.7 | ||
| 2014-15 | 40.5 | ||
| 2015-16 | 40.3 | ||
| 2016-17 | 39.7 | ||
| 2017-18 | 39.3 | ||
| 2018-19 | 39.4 | ||
| 2019-20 | 39.6 | ||
| 2020-21 | 43.9 | 43.9 | |
| 2021-22 | 41.0 | 41.0 | |
| 2022-23 | 39.8 | 39.8 | |
| 2023-24 | 39.0 | 39.0 | |
| 2024-25 | 38.6 | 38.6 | |
| 2025-26 | 38.3 | 38.3 | |
| 2026-27 | 37.9 | 38.0 | |
| 2027-28 | 37.6 | 37.7 | |
| 2028-29 | 37.2 | 37.4 | |
| 2029-30 | 36.8 | 37.2 | |
| 2030-31 | 36.5 | 37.0 | |
| 2031-32 | 36.2 | 36.8 | |
| 2032-33 | 35.9 | 36.7 | |
| 2033-34 | 35.7 | 36.8 | |
| 2034-35 | 35.6 | 36.9 | |
| 2035-36 | 35.5 | 37.0 | |
| 2036-37 | 35.4 | 37.2 | |
| 2037-38 | 35.5 | 37.6 | |
| 2038-39 | 35.6 | 38.0 | |
| 2039-40 | 35.7 | 38.4 | |
| 2040-41 | 36.0 | 39.0 | |
| 2041-42 | 36.3 | 39.7 | |
| 2042-43 | 36.7 | 40.4 | |
| 2043-44 | 37.1 | 41.3 | |
| 2044-45 | 37.5 | 42.1 | |
| 2045-46 | 38.0 | 43.1 | |
| 2046-47 | 38.6 | 44.1 | |
| 2047-48 | 39.2 | 45.1 | |
| 2048-49 | 39.8 | 46.2 | |
| 2049-50 | 40.4 | 47.3 | |
| 2050-51 | 41.0 | 48.5 |
| Year | History | Base Projection | Higher Rates Scenario |
|---|---|---|---|
| 1981-82 | 5.3 | ||
| 1982-83 | 6.8 | ||
| 1983-84 | 8.4 | ||
| 1984-85 | 8.9 | ||
| 1985-86 | 9.2 | ||
| 1986-87 | 8.9 | ||
| 1987-88 | 8.6 | ||
| 1988-89 | 8.4 | ||
| 1989-90 | 7.9 | ||
| 1990-91 | 7.6 | ||
| 1991-92 | 8.0 | ||
| 1992-93 | 10.5 | ||
| 1993-94 | 14.0 | ||
| 1994-95 | 14.8 | ||
| 1995-96 | 15.2 | ||
| 1996-97 | 14.4 | ||
| 1997-98 | 14.7 | ||
| 1998-99 | 14.7 | ||
| 1999-00 | 16.8 | ||
| 2000-01 | 15.0 | ||
| 2001-02 | 13.5 | ||
| 2002-03 | 12.8 | ||
| 2003-04 | 12.1 | ||
| 2004-05 | 11.1 | ||
| 2005-06 | 10.3 | ||
| 2006-07 | 9.4 | ||
| 2007-08 | 8.9 | ||
| 2008-09 | 9.2 | ||
| 2009-10 | 9.5 | ||
| 2010-11 | 8.8 | ||
| 2011-12 | 9.1 | ||
| 2012-13 | 9.0 | ||
| 2013-14 | 9.1 | ||
| 2014-15 | 8.9 | ||
| 2015-16 | 8.5 | ||
| 2016-17 | 8.3 | ||
| 2017-18 | 7.9 | ||
| 2018-19 | 8.1 | ||
| 2019-20 | 8.0 | ||
| 2020-21 | 7.4 | ||
| 2021-22 | 7.3 | 7.3 | |
| 2022-23 | 7.1 | 7.1 | |
| 2023-24 | 6.9 | 6.9 | |
| 2024-25 | 6.9 | 6.9 | |
| 2025-26 | 7.1 | 7.1 | |
| 2026-27 | 7.2 | 7.4 | |
| 2027-28 | 7.3 | 7.7 | |
| 2028-29 | 7.3 | 7.9 | |
| 2029-30 | 7.4 | 8.1 | |
| 2030-31 | 7.4 | 8.4 | |
| 2031-32 | 7.5 | 8.6 | |
| 2032-33 | 7.5 | 8.8 | |
| 2033-34 | 7.6 | 9.0 | |
| 2034-35 | 7.7 | 9.3 | |
| 2035-36 | 7.8 | 9.5 | |
| 2036-37 | 7.9 | 9.8 | |
| 2037-38 | 8.0 | 10.1 | |
| 2038-39 | 8.1 | 10.4 | |
| 2039-40 | 8.3 | 10.7 | |
| 2040-41 | 8.4 | 11.0 | |
| 2041-42 | 8.6 | 11.4 | |
| 2042-43 | 8.7 | 11.7 | |
| 2043-44 | 8.9 | 12.1 | |
| 2044-45 | 9.1 | 12.5 | |
| 2045-46 | 9.3 | 12.9 | |
| 2046-47 | 9.5 | 13.3 | |
| 2047-48 | 9.7 | 13.7 | |
| 2048-49 | 10.0 | 14.1 | |
| 2049-50 | 10.2 | 14.6 | |
| 2050-51 | 10.4 | 15.0 |
| Year | Share of GDP (Per Cent) | ||||||
|---|---|---|---|---|---|---|---|
| Total Spending | Program Spending | Health | Education | All Other Program Spending | Debt Interest | ||
| Historical | 1991-92 | 20.2 | 18.8 | 5.8 | 4.7 | 8.2 | 1.5 |
| 1992-93 | 21.0 | 19.2 | 5.8 | 4.9 | 8.5 | 1.8 | |
| 1993-94 | 20.7 | 18.3 | 5.8 | 4.7 | 7.8 | 2.4 | |
| 1994-95 | 20.0 | 17.6 | 5.6 | 4.2 | 7.8 | 2.4 | |
| 1995-96 | 19.7 | 17.2 | 5.3 | 4.1 | 7.9 | 2.5 | |
| 1995-96 | 19.7 | 17.2 | 5.3 | 4.1 | 7.9 | 2.5 | |
| 1996-97 | 18.7 | 16.2 | 5.4 | 3.6 | 7.2 | 2.5 | |
| 1997-98 | 17.7 | 15.3 | 5.1 | 3.5 | 6.7 | 2.4 | |
| 1998-99 | 16.7 | 14.4 | 5.1 | 3.3 | 6.0 | 2.3 | |
| 1999-00 | 16.8 | 14.2 | 5.3 | 3.1 | 5.8 | 2.6 | |
| 2000-01 | 15.5 | 13.1 | 5.1 | 2.7 | 5.3 | 2.4 | |
| 2001-02 | 15.5 | 13.3 | 5.1 | 2.7 | 5.4 | 2.2 | |
| 2002-03 | 15.0 | 13.0 | 5.3 | 2.8 | 5.0 | 2.0 | |
| 2004-05 | 16.1 | 14.4 | 5.9 | 3.0 | 5.5 | 1.8 | |
| 2005-06 | 17.2 | 15.5 | 6.3 | 3.3 | 5.9 | 1.7 | |
| 2006-07 | 17.4 | 15.8 | 6.6 | 3.3 | 5.9 | 1.6 | |
| 2007-08 | 18.2 | 16.7 | 6.8 | 3.3 | 6.5 | 1.5 | |
| 2008-09 | 17.5 | 16.0 | 7.2 | 3.5 | 5.3 | 1.5 | |
| 2009-10 | 20.4 | 18.8 | 7.7 | 3.8 | 7.4 | 1.5 | |
| 2010-11 | 20.7 | 19.1 | 7.5 | 3.8 | 7.8 | 1.6 | |
| 2011-12 | 20.0 | 18.4 | 7.6 | 3.8 | 7.0 | 1.6 | |
| 2012-13 | 19.2 | 17.6 | 7.5 | 3.5 | 6.6 | 1.6 | |
| 2013-14 | 19.3 | 17.7 | 7.6 | 3.7 | 6.4 | 1.6 | |
| 2014-15 | 18.9 | 17.4 | 7.5 | 3.7 | 6.2 | 1.5 | |
| 2015-16 | 18.6 | 17.1 | 7.3 | 3.6 | 6.2 | 1.5 | |
| 2016-17 | 18.1 | 16.6 | 7.1 | 3.6 | 6.0 | 1.5 | |
| 2017-18 | 18.7 | 17.3 | 7.2 | 3.5 | 6.6 | 1.4 | |
| 2018-19 | 18.7 | 17.3 | 7.2 | 3.5 | 6.6 | 1.4 | |
| 2019-20 | 18.5 | 17.1 | 7.1 | 3.6 | 6.4 | 1.4 | |
| 2020-21 | 20.9 | 19.5 | 8.0 | 3.8 | 7.7 | 1.4 | |
| Projection | 2021-22 | 19.3 | 18.0 | 7.9 | 3.4 | 6.6 | 1.3 |
| 2022-23 | 17.8 | 16.5 | 7.2 | 3.2 | 6.1 | 1.2 | |
| 2023-24 | 17.4 | 16.2 | 7.2 | 3.1 | 5.9 | 1.2 | |
| 2024-25 | 17.5 | 16.3 | 7.3 | 3.1 | 5.9 | 1.2 | |
| 2025-26 | 17.6 | 16.4 | 7.4 | 3.1 | 5.9 | 1.2 | |
| 2026-27 | 17.5 | 16.3 | 7.5 | 3.0 | 5.8 | 1.2 | |
| 2027-28 | 17.5 | 16.3 | 7.6 | 3.0 | 5.7 | 1.2 | |
| 2028-29 | 17.5 | 16.2 | 7.6 | 3.0 | 5.6 | 1.3 | |
| 2029-30 | 17.5 | 16.2 | 7.7 | 3.0 | 5.5 | 1.3 | |
| 2030-31 | 17.5 | 16.2 | 7.8 | 3.0 | 5.5 | 1.3 | |
| 2031-32 | 17.6 | 16.3 | 7.9 | 3.0 | 5.4 | 1.3 | |
| 2032-33 | 17.6 | 16.3 | 8.0 | 3.0 | 5.4 | 1.3 | |
| 2033-34 | 17.7 | 16.4 | 8.1 | 3.0 | 5.3 | 1.3 | |
| 2034-35 | 17.7 | 16.4 | 8.2 | 3.0 | 5.3 | 1.3 | |
| 2035-36 | 17.7 | 16.4 | 8.3 | 3.0 | 5.2 | 1.3 | |
| 2036-37 | 17.8 | 16.4 | 8.4 | 3.0 | 5.1 | 1.3 | |
| 2037-38 | 17.8 | 16.5 | 8.5 | 3.0 | 5.1 | 1.4 | |
| 2038-39 | 17.9 | 16.5 | 8.6 | 3.0 | 5.0 | 1.4 | |
| 2039-40 | 18.0 | 16.6 | 8.7 | 3.0 | 5.0 | 1.4 | |
| 2040-41 | 18.1 | 16.6 | 8.7 | 2.9 | 4.9 | 1.4 | |
| 2041-42 | 18.1 | 16.7 | 8.8 | 2.9 | 4.9 | 1.5 | |
| 2042-43 | 18.2 | 16.7 | 8.9 | 2.9 | 4.9 | 1.5 | |
| 2043-44 | 18.3 | 16.7 | 9.0 | 2.9 | 4.8 | 1.5 | |
| 2044-45 | 18.3 | 16.8 | 9.0 | 2.9 | 4.8 | 1.6 | |
| 2045-46 | 18.4 | 16.8 | 9.1 | 2.9 | 4.8 | 1.6 | |
| 2046-47 | 18.4 | 16.8 | 9.2 | 2.9 | 4.7 | 1.6 | |
| 2048-49 | 18.5 | 16.8 | 9.3 | 2.9 | 4.6 | 1.7 | |
| 2049-50 | 18.6 | 16.8 | 9.3 | 2.9 | 4.6 | 1.7 | |
| 2050-51 | 18.6 | 16.8 | 9.4 | 2.9 | 4.6 | 1.8 | |
| Average Annual Growth (Per Cent) | ||
|---|---|---|
| Historical (1992-2021) | Projection (2022-2050) | |
| Total Spending | 3.8 | 4.0 |
| Health | 4.9 | 4.9 |
| Education | 3.0 | 3.3 |
| All Other Programs | 3.2 | 2.9 |
| Year | Share of GDP (Per Cent) | ||||
|---|---|---|---|---|---|
| Total Revenue | Taxation Revenue | Federal Transfers | Other Revenue | ||
| Historical | |||||
| 1981-82 | 15.2 | 10.5 | 2.5 | 2.2 | |
| 1982-83 | 15.3 | 10.7 | 2.4 | 2.3 | |
| 1983-84 | 15.2 | 10.4 | 2.7 | 2.2 | |
| 1984-85 | 14.9 | 10.2 | 2.6 | 2.2 | |
| 1985-86 | 15.1 | 10.6 | 2.4 | 2.1 | |
| 1986-87 | 15.5 | 11.1 | 2.3 | 2.1 | |
| 1987-88 | 15.4 | 11.3 | 2.2 | 2.0 | |
| 1988-89 | 16.0 | 12.1 | 2.0 | 1.9 | |
| 1989-90 | 16.4 | 12.8 | 1.9 | 1.7 | |
| 1990-91 | 17.0 | 13.8 | 2.0 | 1.2 | |
| 1991-92 | 16.5 | 13.0 | 2.2 | 1.3 | |
| 1992-93 | 16.7 | 12.7 | 2.6 | 1.4 | |
| 1993-94 | 17.0 | 13.3 | 2.3 | 1.3 | |
| 1994-95 | 16.8 | 13.2 | 2.4 | 1.2 | |
| 1995-96 | 17.1 | 13.2 | 2.3 | 1.6 | |
| 1996-97 | 16.7 | 13.4 | 1.7 | 1.6 | |
| 1997-98 | 16.6 | 13.5 | 1.4 | 1.7 | |
| 1998-99 | 16.2 | 12.8 | 1.2 | 2.2 | |
| 1999-00 | 16.9 | 12.6 | 1.4 | 2.9 | |
| 2000-01 | 16.0 | 12.2 | 1.4 | 2.4 | |
| 2001-02 | 15.4 | 11.5 | 1.7 | 2.3 | |
| 2002-03 | 15.1 | 11.2 | 1.8 | 2.1 | |
| 2003-04 | 14.6 | 10.8 | 1.9 | 1.8 | |
| 2004-05 | 15.8 | 11.7 | 2.2 | 1.9 | |
| 2005-06 | 17.2 | 11.9 | 2.4 | 2.9 | |
| 2006-07 | 17.7 | 12.3 | 2.4 | 3.0 | |
| 2007-08 | 18.2 | 12.5 | 2.8 | 2.9 | |
| 2008-09 | 17.0 | 11.4 | 2.8 | 2.8 | |
| 2009-10 | 17.1 | 10.9 | 3.2 | 3.0 | |
| 2010-11 | 18.0 | 11.3 | 3.7 | 3.0 | |
| 2011-12 | 17.6 | 11.4 | 3.2 | 2.9 | |
| 2012-13 | 17.7 | 11.7 | 3.2 | 2.8 | |
| 2013-14 | 17.7 | 11.5 | 3.2 | 2.9 | |
| 2014-15 | 17.4 | 11.3 | 3.0 | 3.0 | |
| 2015-16 | 17.9 | 12.1 | 3.0 | 2.8 | |
| 2016-17 | 17.8 | 11.9 | 3.1 | 2.8 | |
| 2017-18 | 18.3 | 12.1 | 3.0 | 3.2 | |
| 2018-19 | 17.9 | 12.3 | 2.9 | 2.7 | |
| 2019-20 | 17.5 | 12.1 | 2.8 | 2.5 | |
| 2020-21 | 19.0 | 12.8 | 3.9 | 2.3 | |
| Projection | 2021-22 | 17.6 | 12.5 | 3.0 | 2.2 |
| 2022-23 | 17.1 | 12.2 | 2.6 | 2.2 | |
| 2023-24 | 17.1 | 12.2 | 2.6 | 2.3 | |
| 2024-25 | 17.1 | 12.2 | 2.7 | 2.3 | |
| 2025-26 | 17.1 | 12.2 | 2.7 | 2.3 | |
| 2026-27 | 17.1 | 12.1 | 2.7 | 2.3 | |
| 2027-28 | 17.1 | 12.1 | 2.7 | 2.3 | |
| 2028-29 | 17.1 | 12.1 | 2.7 | 2.3 | |
| 2029-30 | 17.1 | 12.1 | 2.7 | 2.3 | |
| 2030-31 | 17.1 | 12.1 | 2.8 | 2.3 | |
| 2031-32 | 17.1 | 12.1 | 2.8 | 2.2 | |
| 2032-33 | 17.1 | 12.1 | 2.8 | 2.2 | |
| 2033-34 | 17.1 | 12.1 | 2.8 | 2.2 | |
| 2034-35 | 17.1 | 12.1 | 2.8 | 2.2 | |
| 2035-36 | 17.1 | 12.1 | 2.8 | 2.2 | |
| 2036-37 | 17.1 | 12.1 | 2.8 | 2.2 | |
| 2037-38 | 17.1 | 12.1 | 2.8 | 2.2 | |
| 2038-39 | 17.1 | 12.1 | 2.8 | 2.2 | |
| 2039-40 | 17.1 | 12.1 | 2.8 | 2.2 | |
| 2040-41 | 17.1 | 12.1 | 2.8 | 2.2 | |
| 2041-42 | 17.1 | 12.1 | 2.8 | 2.2 | |
| 2042-43 | 17.1 | 12.1 | 2.8 | 2.2 | |
| 2043-44 | 17.0 | 12.1 | 2.8 | 2.2 | |
| 2044-45 | 17.0 | 12.1 | 2.8 | 2.2 | |
| 2045-46 | 17.0 | 12.1 | 2.8 | 2.2 | |
| 2046-47 | 17.0 | 12.1 | 2.8 | 2.2 | |
| 2047-48 | 17.0 | 12.1 | 2.8 | 2.2 | |
| 2048-49 | 17.0 | 12.1 | 2.8 | 2.2 | |
| 2049-50 | 17.0 | 12.1 | 2.8 | 2.2 | |
| 2050-51 | 17.0 | 12.1 | 2.8 | 2.2 | |
| Average Annual Growth (Per Cent) | ||
|---|---|---|
| Historical (1992-93 to 2020-21) | Projection (2021-22 to 2050-51) | |
| Total Revenue | 4.4 | 3.9 |
| Taxation Revenue | 3.8 | 4.0 |
| Federal Transfers | 6.0 | 3.1 |
| Other Revenue | 6.0 | 4.0 |
| Year | Share of GDP (Per Cent) | |||||
|---|---|---|---|---|---|---|
| Taxation Revenue | Personal Income Tax | Corporations Tax | Sales Tax | Other Tax Revenue | ||
| Historical | 1981-82 | 10.5 | 3.7 | 1.3 | 2.2 | 3.3 |
| 1982-83 | 10.7 | 4.2 | 1.0 | 2.4 | 3.1 | |
| 1983-84 | 10.4 | 3.8 | 1.0 | 2.5 | 3.1 | |
| 1984-85 | 10.2 | 3.6 | 1.3 | 2.5 | 2.8 | |
| 1985-86 | 10.6 | 3.7 | 1.3 | 2.6 | 3.0 | |
| 1985-86 | 10.6 | 3.7 | 1.3 | 2.6 | 3.0 | |
| 1986-87 | 11.1 | 4.0 | 1.5 | 2.6 | 2.9 | |
| 1987-88 | 11.3 | 4.2 | 1.5 | 2.7 | 2.9 | |
| 1988-89 | 12.1 | 4.5 | 1.6 | 3.0 | 3.0 | |
| 1989-90 | 12.8 | 4.8 | 1.7 | 3.0 | 3.4 | |
| 1990-91 | 13.8 | 5.4 | 1.3 | 2.8 | 4.3 | |
| 1991-92 | 13.0 | 4.7 | 1.1 | 2.6 | 4.5 | |
| 1992-93 | 12.7 | 4.6 | 0.9 | 2.5 | 4.7 | |
| 1993-94 | 13.3 | 4.9 | 1.1 | 2.7 | 4.7 | |
| 1994-95 | 13.2 | 4.9 | 1.4 | 2.8 | 4.2 | |
| 1995-96 | 13.2 | 4.9 | 1.5 | 2.7 | 4.0 | |
| 1996-97 | 13.4 | 5.0 | 1.7 | 2.8 | 4.0 | |
| 1997-98 | 13.5 | 4.7 | 2.0 | 2.9 | 3.9 | |
| 1998-99 | 12.8 | 4.7 | 1.9 | 2.9 | 3.3 | |
| 1999-00 | 12.6 | 4.4 | 2.0 | 3.0 | 3.2 | |
| 2000-01 | 12.2 | 4.2 | 2.1 | 3.0 | 3.0 | |
| 2001-02 | 11.5 | 4.3 | 1.5 | 2.9 | 2.9 | |
| 2002-03 | 11.2 | 3.9 | 1.6 | 2.8 | 3.0 | |
| 2003-04 | 10.8 | 3.8 | 1.4 | 2.7 | 3.0 | |
| 2004-05 | 11.7 | 3.8 | 1.9 | 2.7 | 3.2 | |
| 2005-06 | 11.9 | 4.0 | 1.9 | 2.7 | 3.3 | |
| 2006-07 | 12.3 | 4.3 | 2.0 | 2.8 | 3.3 | |
| 2007-08 | 12.5 | 4.2 | 2.2 | 2.8 | 3.3 | |
| 2008-09 | 11.4 | 4.2 | 1.2 | 2.8 | 3.2 | |
| 2009-10 | 10.9 | 3.9 | 1.0 | 2.9 | 3.1 | |
| 2010-11 | 11.3 | 3.8 | 1.4 | 3.0 | 3.2 | |
| 2011-12 | 11.4 | 3.7 | 1.5 | 3.1 | 3.2 | |
| 2012-13 | 11.7 | 3.8 | 1.8 | 3.1 | 3.1 | |
| 2013-14 | 11.5 | 3.9 | 1.6 | 2.9 | 3.0 | |
| 2014-15 | 11.3 | 4.0 | 1.3 | 3.0 | 3.0 | |
| 2015-16 | 12.1 | 4.1 | 1.5 | 3.1 | 3.4 | |
| 2016-17 | 11.9 | 3.9 | 1.9 | 3.1 | 3.0 | |
| 2017-18 | 12.1 | 4.0 | 1.9 | 3.1 | 3.1 | |
| 2018-19 | 12.3 | 4.1 | 1.9 | 3.2 | 3.0 | |
| 2019-20 | 12.1 | 4.2 | 1.7 | 3.2 | 3.0 | |
| 2020-21 | 12.8 | 4.7 | 2.1 | 3.1 | 3.0 | |
| Projection | 2021-22 | 12.5 | 4.4 | 2.0 | 3.2 | 2.9 |
| 2022-23 | 12.2 | 4.3 | 1.9 | 3.2 | 2.7 | |
| 2023-24 | 12.2 | 4.3 | 1.9 | 3.2 | 2.7 | |
| 2024-25 | 12.2 | 4.3 | 1.9 | 3.2 | 2.7 | |
| 2025-26 | 12.2 | 4.4 | 1.9 | 3.2 | 2.7 | |
| 2026-27 | 12.1 | 4.4 | 1.9 | 3.2 | 2.6 | |
| 2027-28 | 12.1 | 4.4 | 1.9 | 3.2 | 2.6 | |
| 2028-29 | 12.1 | 4.4 | 1.9 | 3.2 | 2.6 | |
| 2029-30 | 12.1 | 4.4 | 1.8 | 3.3 | 2.6 | |
| 2030-31 | 12.1 | 4.4 | 1.8 | 3.3 | 2.6 | |
| 2031-32 | 12.1 | 4.5 | 1.8 | 3.3 | 2.5 | |
| 2032-33 | 12.1 | 4.5 | 1.8 | 3.3 | 2.5 | |
| 2033-34 | 12.1 | 4.5 | 1.8 | 3.3 | 2.5 | |
| 2034-35 | 12.1 | 4.5 | 1.8 | 3.3 | 2.5 | |
| 2035-36 | 12.1 | 4.5 | 1.8 | 3.3 | 2.5 | |
| 2036-37 | 12.1 | 4.5 | 1.8 | 3.3 | 2.5 | |
| 2037-38 | 12.1 | 4.6 | 1.8 | 3.3 | 2.4 | |
| 2038-39 | 12.1 | 4.6 | 1.8 | 3.3 | 2.4 | |
| 2039-40 | 12.1 | 4.6 | 1.8 | 3.3 | 2.4 | |
| 2040-41 | 12.1 | 4.6 | 1.8 | 3.3 | 2.4 | |
| 2041-42 | 12.1 | 4.6 | 1.8 | 3.3 | 2.4 | |
| 2042-43 | 12.1 | 4.6 | 1.8 | 3.3 | 2.4 | |
| 2043-44 | 12.1 | 4.7 | 1.8 | 3.3 | 2.3 | |
| 2044-45 | 12.1 | 4.7 | 1.7 | 3.3 | 2.3 | |
| 2045-46 | 12.1 | 4.7 | 1.7 | 3.3 | 2.3 | |
| 2046-47 | 12.1 | 4.7 | 1.7 | 3.3 | 2.3 | |
| 2047-48 | 12.1 | 4.7 | 1.7 | 3.3 | 2.3 | |
| 2048-49 | 12.1 | 4.8 | 1.7 | 3.3 | 2.3 | |
| 2049-50 | 12.1 | 4.8 | 1.7 | 3.3 | 2.3 | |
| 2050-51 | 12.1 | 4.8 | 1.7 | 3.3 | 2.3 | |
| Growth (Per Cent) | ||
|---|---|---|
| Historical (1992-2021) | Projection (2022-2050) | |
| Real GDP | 2.3 | 2.0 |
| GDP Deflator | 1.8 | 1.9 |
| Nominal GDP | 4.1 | 4.0 |
| Average Annual Growth (Per Cent) | ||
|---|---|---|
| Historical (1992-2021) | Projection (2022-2050) | |
| Real GDP | 2.3 | 2.1 |
| Consumption | 2.3 | 2.1 |
| Investment | 3.0 | 2.4 |
| Exports | 2.7 | 2.1 |
| Imports | 3.2 | 2.1 |
| Year | Annual Total Population Growth (Per Cent) |
|
|---|---|---|
| Long-Run Historical | 1930 | 1.6 |
| 1931 | 1.4 | |
| 1932 | 1.2 | |
| 1933 | 1.1 | |
| 1934 | 0.9 | |
| 1935 | 0.9 | |
| 1936 | 0.9 | |
| 1937 | 0.9 | |
| 1938 | 1.0 | |
| 1939 | 1.0 | |
| 1940 | 1.1 | |
| 1941 | 1.1 | |
| 1942 | 2.5 | |
| 1943 | 0.8 | |
| 1944 | 1.2 | |
| 1945 | 0.9 | |
| 1946 | 2.3 | |
| 1947 | 2.0 | |
| 1948 | 2.4 | |
| 1949 | 2.4 | |
| 1950 | 2.1 | |
| 1951 | 2.8 | |
| 1952 | 4.4 | |
| 1953 | 3.2 | |
| 1954 | 3.5 | |
| 1955 | 2.9 | |
| 1956 | 2.7 | |
| 1957 | 4.5 | |
| 1958 | 2.9 | |
| 1959 | 2.6 | |
| 1960 | 2.4 | |
| 1961 | 2.0 | |
| 1962 | 1.8 | |
| 1963 | 2.1 | |
| 1964 | 2.3 | |
| 1965 | 2.4 | |
| 1966 | 2.6 | |
| 1967 | 2.4 | |
| 1968 | 1.9 | |
| 1969 | 1.7 | |
| 1970 | 2.3 | |
| 1971 | 3.7 | |
| 1972 | 1.5 | |
| 1973 | 1.4 | |
| 1974 | 1.6 | |
| 1975 | 1.4 | |
| 1976 | 1.1 | |
| 1977 | 1.1 | |
| 1978 | 1.0 | |
| 1979 | 0.8 | |
| 1980 | 1.0 | |
| 1981 | 0.8 | |
| 1982 | 1.2 | |
| 1983 | 1.3 | |
| 1984 | 1.4 | |
| 1985 | 1.4 | |
| 1986 | 1.5 | |
| 1987 | 2.1 | |
| 1988 | 2.1 | |
| 1989 | 2.7 | |
| 1990 | 1.9 | |
| 1991 | 1.3 | |
| Historical | 1992 | 1.4 |
| 1993 | 1.1 | |
| 1994 | 1.2 | |
| 1995 | 1.2 | |
| 1996 | 1.2 | |
| 1997 | 1.3 | |
| 1998 | 1.2 | |
| 1999 | 1.2 | |
| 2000 | 1.6 | |
| 2001 | 1.8 | |
| 2002 | 1.7 | |
| 2003 | 1.2 | |
| 2004 | 1.2 | |
| 2005 | 1.1 | |
| 2006 | 1.1 | |
| 2007 | 0.8 | |
| 2008 | 0.9 | |
| 2009 | 0.9 | |
| 2010 | 1.1 | |
| 2011 | 1.0 | |
| 2012 | 1.0 | |
| 2013 | 0.9 | |
| 2014 | 0.8 | |
| 2015 | 0.7 | |
| 2016 | 1.2 | |
| 2017 | 1.4 | |
| 2018 | 1.7 | |
| 2019 | 1.6 | |
| 2020 | 1.4 | |
| 2021 | 0.5 | |
| Projection | 2022 | 2.0 |
| 2023 | 1.6 | |
| 2024 | 1.5 | |
| 2025 | 1.4 | |
| 2026 | 1.3 | |
| 2027 | 1.2 | |
| 2028 | 1.2 | |
| 2029 | 1.1 | |
| 2030 | 1.1 | |
| 2031 | 1.1 | |
| 2032 | 1.1 | |
| 2033 | 1.1 | |
| 2034 | 1.1 | |
| 2035 | 1.1 | |
| 2036 | 1.1 | |
| 2037 | 1.1 | |
| 2038 | 1.1 | |
| 2039 | 1.0 | |
| 2040 | 1.0 | |
| 2041 | 1.0 | |
| 2042 | 1.0 | |
| 2043 | 1.0 | |
| 2044 | 1.0 | |
| 2045 | 1.0 | |
| 2046 | 1.0 | |
| 2047 | 1.0 | |
| 2048 | 1.0 | |
| 2049 | 1.0 | |
| 2050 | 1.0 |
| Year | Population Change (Thousands) | ||
|---|---|---|---|
| Population Change due to Natural Increase | Population Change due to Net Migration | ||
| Historical | 1982 | 61.9 | 57.5 |
| 1983 | 63.9 | 64.1 | |
| 1984 | 65.4 | 61.9 | |
| 1985 | 66.3 | 76.3 | |
| 1986 | 67.5 | 130.9 | |
| 1987 | 65.4 | 133.0 | |
| 1988 | 71.2 | 191.3 | |
| 1989 | 78.8 | 111.5 | |
| 1990 | 79.1 | 55.2 | |
| 1991 | 78.5 | 74.5 | |
| 1992 | 74.1 | 55.8 | |
| 1993 | 69.8 | 71.3 | |
| 1994 | 69.1 | 73.9 | |
| 1995 | 65.4 | 78.2 | |
| 1996 | 55.9 | 91.1 | |
| 1997 | 53.1 | 87.4 | |
| 1998 | 50.5 | 90.6 | |
| 1999 | 49.9 | 130.9 | |
| 2000 | 46.6 | 170.0 | |
| 2001 | 48.0 | 151.9 | |
| 2002 | 45.8 | 108.3 | |
| 2003 | 48.7 | 100.9 | |
| 2004 | 47.5 | 93.0 | |
| 2005 | 50.0 | 88.8 | |
| 2006 | 50.2 | 74.6 | |
| 2007 | 53.0 | 87.6 | |
| 2008 | 52.0 | 84.6 | |
| 2009 | 52.2 | 107.1 | |
| 2010 | 48.3 | 97.8 | |
| 2011 | 52.1 | 89.3 | |
| 2012 | 47.5 | 84.7 | |
| 2013 | 45.8 | 73.1 | |
| 2014 | 42.3 | 59.4 | |
| 2015 | 42.8 | 135.9 | |
| 2016 | 38.9 | 155.9 | |
| 2017 | 34.2 | 204.3 | |
| 2018 | 34.1 | 201.9 | |
| 2019 | 28.2 | 172.8 | |
| 2020 | 20.0 | 60.6 | |
| 2021 | 30.1 | 273.2 | |
| Projection | 2022 | 30.9 | 205.3 |
| 2023 | 30.4 | 194.0 | |
| 2024 | 30.1 | 183.8 | |
| 2025 | 30.0 | 176.7 | |
| 2026 | 29.8 | 166.7 | |
| 2027 | 29.6 | 156.6 | |
| 2028 | 29.3 | 157.7 | |
| 2029 | 28.9 | 158.7 | |
| 2030 | 28.5 | 159.8 | |
| 2031 | 27.9 | 160.9 | |
| 2032 | 27.3 | 162.0 | |
| 2033 | 26.7 | 163.1 | |
| 2034 | 25.9 | 164.3 | |
| 2035 | 25.1 | 165.4 | |
| 2036 | 24.3 | 166.6 | |
| 2037 | 23.4 | 167.8 | |
| 2038 | 22.5 | 169.0 | |
| 2039 | 21.7 | 170.2 | |
| 2040 | 20.9 | 171.4 | |
| 2041 | 20.1 | 172.7 | |
| 2042 | 19.4 | 173.9 | |
| 2043 | 18.9 | 175.2 | |
| 2044 | 18.4 | 176.4 | |
| 2045 | 18.0 | 177.7 | |
| 2046 | 17.6 | 179.0 | |
| 2047 | 17.3 | 180.3 | |
| 2048 | 16.9 | 181.6 | |
| 2049 | 16.4 | 182.9 | |
| 2050 | 16.0 | 184.2 | |
| Year | Share of Population (Per Cent) | |||
|---|---|---|---|---|
| Ages 14 and under | Ages 15 to 64 | Ages 65 and over | ||
| Historical | 1981 | 21.6 | 68.5 | 9.9 |
| 1982 | 21.3 | 68.7 | 10.1 | |
| 1983 | 21.0 | 68.8 | 10.1 | |
| 1984 | 20.8 | 69.0 | 10.3 | |
| 1985 | 20.5 | 69.0 | 10.5 | |
| 1986 | 20.3 | 69.1 | 10.7 | |
| 1987 | 20.2 | 68.9 | 10.9 | |
| 1988 | 20.1 | 68.8 | 11.0 | |
| 1989 | 20.1 | 68.7 | 11.2 | |
| 1990 | 20.1 | 68.5 | 11.3 | |
| 1991 | 20.2 | 68.3 | 11.5 | |
| 1992 | 20.3 | 68.0 | 11.7 | |
| 1993 | 20.4 | 67.7 | 11.9 | |
| 1994 | 20.4 | 67.6 | 12.0 | |
| 1995 | 20.4 | 67.5 | 12.1 | |
| 1996 | 20.3 | 67.4 | 12.2 | |
| 1997 | 20.2 | 67.5 | 12.3 | |
| 1998 | 20.1 | 67.5 | 12.4 | |
| 1999 | 19.9 | 67.7 | 12.5 | |
| 2000 | 19.6 | 67.9 | 12.5 | |
| 2001 | 19.4 | 68.1 | 12.5 | |
| 2002 | 19.1 | 68.4 | 12.6 | |
| 2003 | 18.8 | 68.6 | 12.7 | |
| 2004 | 18.5 | 68.8 | 12.8 | |
| 2005 | 18.1 | 69.0 | 12.9 | |
| 2006 | 17.8 | 69.2 | 13.0 | |
| 2007 | 17.5 | 69.2 | 13.2 | |
| 2008 | 17.3 | 69.2 | 13.5 | |
| 2009 | 17.1 | 69.2 | 13.7 | |
| 2010 | 16.8 | 69.2 | 14.0 | |
| 2011 | 16.6 | 69.1 | 14.2 | |
| 2012 | 16.5 | 68.8 | 14.7 | |
| 2013 | 16.4 | 68.5 | 15.2 | |
| 2014 | 16.3 | 68.1 | 15.6 | |
| 2015 | 16.2 | 67.8 | 16.0 | |
| 2016 | 16.1 | 67.6 | 16.3 | |
| 2017 | 16.0 | 67.4 | 16.6 | |
| 2018 | 15.8 | 67.3 | 16.9 | |
| 2019 | 15.6 | 67.1 | 17.3 | |
| 2020 | 15.5 | 66.9 | 17.6 | |
| 2021 | 15.3 | 66.6 | 18.1 | |
| Projection | 2022 | 15.1 | 66.5 | 18.4 |
| 2023 | 15.0 | 66.3 | 18.7 | |
| 2024 | 14.9 | 66.1 | 19.1 | |
| 2025 | 14.8 | 65.8 | 19.4 | |
| 2026 | 14.8 | 65.4 | 19.8 | |
| 2027 | 14.7 | 65.1 | 20.2 | |
| 2028 | 14.7 | 64.7 | 20.6 | |
| 2029 | 14.7 | 64.3 | 21.0 | |
| 2030 | 14.7 | 64.0 | 21.4 | |
| 2031 | 14.7 | 63.7 | 21.6 | |
| 2032 | 14.7 | 63.5 | 21.8 | |
| 2033 | 14.7 | 63.4 | 21.9 | |
| 2034 | 14.7 | 63.2 | 22.1 | |
| 2035 | 14.7 | 63.1 | 22.2 | |
| 2036 | 14.7 | 63.0 | 22.3 | |
| 2037 | 14.7 | 62.9 | 22.4 | |
| 2038 | 14.7 | 62.9 | 22.4 | |
| 2039 | 14.7 | 62.9 | 22.4 | |
| 2040 | 14.7 | 62.9 | 22.4 | |
| 2041 | 14.7 | 62.9 | 22.4 | |
| 2042 | 14.7 | 62.9 | 22.4 | |
| 2043 | 14.7 | 62.9 | 22.4 | |
| 2044 | 14.7 | 63.0 | 22.3 | |
| 2045 | 14.7 | 63.0 | 22.3 | |
| 2046 | 14.7 | 63.0 | 22.3 | |
| 2047 | 14.7 | 63.0 | 22.3 | |
| 2048 | 14.7 | 63.0 | 22.3 | |
| 2049 | 14.7 | 63.0 | 22.3 | |
| 2050 | 14.7 | 63.0 | 22.3 | |
| Year | Participation Rate (Per Cent) | ||||
|---|---|---|---|---|---|
| Ages 15 to 24 | Ages 25 to 54 | Ages 55 to 64 | All Ages (15 and over) |
||
| Projection | 1981 | 67.7 | 72.1 | 81.8 | 8.6 |
| 1982 | 67.5 | 71.0 | 82.1 | 8.6 | |
| 1983 | 67.6 | 71.2 | 82.9 | 7.8 | |
| 1984 | 67.8 | 71.8 | 83.2 | 7.8 | |
| 1985 | 68.4 | 72.3 | 84.0 | 7.8 | |
| 1986 | 68.8 | 73.1 | 84.8 | 7.1 | |
| 1987 | 69.1 | 74.3 | 85.2 | 7.7 | |
| 1988 | 69.6 | 74.3 | 86.1 | 7.0 | |
| 1989 | 70.0 | 74.6 | 86.7 | 7.3 | |
| 1990 | 69.5 | 73.0 | 86.5 | 7.6 | |
| 1991 | 68.5 | 70.2 | 86.2 | 7.9 | |
| 1992 | 67.3 | 68.3 | 85.0 | 7.1 | |
| 1993 | 66.7 | 66.0 | 85.1 | 6.5 | |
| 1994 | 65.9 | 64.3 | 84.4 | 7.2 | |
| 1995 | 65.5 | 63.4 | 84.2 | 6.9 | |
| 1996 | 65.6 | 63.3 | 84.4 | 6.4 | |
| 1997 | 65.8 | 63.0 | 84.7 | 6.8 | |
| 1998 | 65.9 | 62.7 | 85.3 | 6.7 | |
| 1999 | 66.5 | 64.9 | 85.5 | 6.7 | |
| 2000 | 67.0 | 66.1 | 85.8 | 6.7 | |
| 2001 | 67.3 | 65.6 | 86.1 | 6.9 | |
| 2002 | 67.8 | 66.5 | 86.6 | 7.6 | |
| 2003 | 68.5 | 67.0 | 87.1 | 8.3 | |
| 2004 | 68.4 | 66.5 | 87.1 | 8.4 | |
| 2005 | 68.0 | 64.6 | 86.9 | 8.9 | |
| 2006 | 67.5 | 65.2 | 86.3 | 8.5 | |
| 2007 | 67.5 | 65.8 | 86.3 | 9.1 | |
| 2008 | 67.5 | 65.3 | 86.4 | 10.4 | |
| 2009 | 66.8 | 63.3 | 86.1 | 10.8 | |
| 2010 | 66.6 | 61.8 | 86.0 | 11.8 | |
| 2011 | 66.5 | 62.3 | 86.0 | 12.2 | |
| 2012 | 66.0 | 61.0 | 85.9 | 12.8 | |
| 2013 | 66.1 | 61.8 | 86.4 | 13.3 | |
| 2014 | 65.7 | 62.6 | 85.5 | 14.0 | |
| 2015 | 65.1 | 61.9 | 85.3 | 14.1 | |
| 2016 | 64.9 | 60.9 | 85.3 | 14.0 | |
| 2017 | 64.7 | 61.2 | 85.4 | 14.5 | |
| 2018 | 64.3 | 61.0 | 85.4 | 13.8 | |
| 2019 | 64.9 | 61.5 | 86.1 | 14.8 | |
| 2020 | 63.6 | 58.8 | 84.9 | 14.5 | |
| 2021 | 64.9 | 60.3 | 86.9 | 14.9 | |
| Projection | 2022 | 63.5 | 59.9 | 85.3 | 14.5 |
| 2023 | 63.3 | 60.1 | 85.4 | 14.6 | |
| 2024 | 63.2 | 60.5 | 85.5 | 14.6 | |
| 2025 | 63.0 | 60.9 | 85.4 | 14.5 | |
| 2026 | 62.7 | 61.1 | 85.3 | 14.5 | |
| 2027 | 62.5 | 61.0 | 85.3 | 14.6 | |
| 2028 | 62.2 | 60.8 | 85.2 | 14.6 | |
| 2029 | 61.9 | 60.7 | 85.2 | 14.6 | |
| 2030 | 61.6 | 60.7 | 85.1 | 14.6 | |
| 2031 | 61.5 | 60.6 | 85.1 | 14.6 | |
| 2032 | 61.4 | 60.6 | 85.0 | 14.6 | |
| 2033 | 61.3 | 60.6 | 85.0 | 14.6 | |
| 2034 | 61.2 | 60.6 | 85.0 | 14.6 | |
| 2035 | 61.1 | 60.6 | 85.0 | 14.6 | |
| 2036 | 61.1 | 60.6 | 85.0 | 14.6 | |
| 2037 | 61.0 | 60.6 | 84.9 | 14.6 | |
| 2038 | 61.0 | 60.6 | 84.9 | 14.6 | |
| 2039 | 61.0 | 60.6 | 84.9 | 14.6 | |
| 2040 | 60.9 | 60.6 | 84.9 | 14.5 | |
| 2041 | 60.9 | 60.6 | 84.9 | 14.5 | |
| 2042 | 60.9 | 60.6 | 84.9 | 14.5 | |
| 2043 | 60.9 | 60.6 | 84.9 | 14.5 | |
| 2044 | 60.9 | 60.6 | 84.9 | 14.5 | |
| 2045 | 60.8 | 60.6 | 84.9 | 14.5 | |
| 2046 | 60.8 | 60.6 | 84.9 | 14.5 | |
| 2047 | 60.8 | 60.5 | 84.9 | 14.5 | |
| 2048 | 60.7 | 60.5 | 84.9 | 14.5 | |
| 2049 | 60.7 | 60.5 | 84.8 | 14.5 | |
| 2050 | 60.6 | 60.5 | 84.8 | 14.5 | |
| Year | Labour Force Growth (Per Cent) | |
|---|---|---|
| Historical | 1982-2021 | 1.4 |
| Projection | 2022-50 | 1.0 |
| Year | Unemployment Rate (Per Cent) | |
|---|---|---|
| Historical | 1950s | 3.2 |
| 1960s | 3.8 | |
| 1970s | 5.6 | |
| 1980s | 7.4 | |
| 1990s | 8.7 | |
| 2000s | 6.8 | |
| 2010s | 7.0 | |
| Projection | 2020s | 6.6 |
| 2030s | 5.8 | |
| 2040s | 5.6 |
| Year | Labour Productivity Growth (Per Cent) | |
|---|---|---|
| Historical | 1982-2000 | 1.6 |
| 2001-21 | 0.5 | |
| 1982-2021 | 1.1 | |
| Projection | 2022-50 | 0.9 |
| Year | 10-Year Bond Yield (Per Cent) | ||
| Government of Canada | Ontario | ||
| Historical | 1992 | 8.1 | 8.8 |
| 1993 | 7.2 | 7.9 | |
| 1994 | 8.4 | 8.9 | |
| 1995 | 8.1 | 8.4 | |
| 1996 | 7.2 | 7.4 | |
| 1997 | 6.1 | 6.3 | |
| 1998 | 5.3 | 5.5 | |
| 1999 | 5.6 | 5.9 | |
| 2000 | 5.9 | 6.3 | |
| 2001 | 5.5 | 5.9 | |
| 2002 | 5.3 | 5.6 | |
| 2003 | 4.8 | 5.1 | |
| 2004 | 4.6 | 4.9 | |
| 2005 | 4.1 | 4.3 | |
| 2006 | 4.2 | 4.5 | |
| 2007 | 4.3 | 4.6 | |
| 2008 | 3.6 | 4.4 | |
| 2009 | 3.3 | 4.3 | |
| 2010 | 3.2 | 4.0 | |
| 2011 | 2.8 | 3.6 | |
| 2012 | 1.9 | 2.8 | |
| 2013 | 2.3 | 3.2 | |
| 2014 | 2.2 | 3.0 | |
| 2015 | 1.5 | 2.2 | |
| 2016 | 1.3 | 2.1 | |
| 2017 | 1.8 | 2.5 | |
| 2018 | 2.3 | 2.9 | |
| 2019 | 1.6 | 2.3 | |
| 2020 | 0.7 | 1.5 | |
| 2021 | 1.4 | 1.9 | |
| Projection | 2022 | 1.9 | 2.4 |
| 2023 | 2.3 | 2.8 | |
| 2024 | 2.9 | 3.4 | |
| 2025 | 3.4 | 3.9 | |
| 2026 | 3.4 | 3.9 | |
| 2027 | 3.4 | 3.9 | |
| 2028 | 3.4 | 3.9 | |
| 2029 | 3.4 | 3.9 | |
| 2030 | 3.4 | 3.9 | |
| 2031 | 3.4 | 3.9 | |
| 2032 | 3.4 | 3.9 | |
| 2033 | 3.4 | 3.9 | |
| 2034 | 3.4 | 3.9 | |
| 2035 | 3.4 | 3.9 | |
| 2036 | 3.4 | 3.9 | |
| 2037 | 3.4 | 3.9 | |
| 2038 | 3.4 | 3.9 | |
| 2039 | 3.4 | 3.9 | |
| 2040 | 3.4 | 3.9 | |
| 2041 | 3.4 | 3.9 | |
| 2042 | 3.4 | 3.9 | |
| 2043 | 3.4 | 3.9 | |
| 2044 | 3.4 | 3.9 | |
| 2045 | 3.4 | 3.9 | |
| 2046 | 3.4 | 3.9 | |
| 2047 | 3.4 | 3.9 | |
| 2048 | 3.4 | 3.9 | |
| 2049 | 3.4 | 3.9 | |
| 2050 | 3.4 | 3.9 | |
Footnotes
[1] See the 2021 Ontario Budget for the government’s Debt Burden Reduction Strategy. The government reaffirmed their commitment to fiscal sustainability objectives in the 2021 Economic Outlook and Fiscal Review.
[2] For example, Ukraine defaulted on a debt that was 30 per cent of its GDP while Japan continues to manage its finances with debt levels above 200 per cent of GDP. International Monetary Fund, Sovereign Debt: A Guide for Economists and Practitioners, 2018.
[3] See Appendix A1 Table 5-1 for a list of definitions of fiscal sustainability used by various organizations.
[4] See Net debt-to-GDP ratio section below.
[5] See Fiscal Sustainability, Transparency and Accountability Act, 2019, S.O. 2019, c. 7, Sched. 30.
[6] See Interest on debt as a share of revenue below.
[7] 2021 Ontario Budget, p. 198.
[8] See Interest on debt as a share of revenue section below.
[9] 2021 Ontario Budget, p. 200.
[10] To gauge the sensitivity of Ontario’s long term fiscal position to changes in key variables, the FAO estimated the impact to Ontario’s net debt to GDP and interest on debt as a share of revenues in 2050-51 in tax policy, spending and federal transfers. See Table 5-2 in the Appendix A1. The FAO’s assessment of the government’s revenue forecast in the 2021 Ontario Fall Economic Outlook and Fiscal Review revealed potential unannounced tax cuts of approximately $2.5 billion by 2023-24, which would increase the size of the government’s deficit and lead to higher borrowing, if enacted. See FAO, Budget Outlook Update, 2022.
[11] See FAO, “Provincial Infrastructure,” 2020 and “Costing Climate Change Impacts to Public Infrastructure Project,” 2022.
[12] For a discussion on the potential impact of climate change on fiscal sustainability, see OECD, “Climate Change and Long-term Fiscal Sustainability,” 2021.
[13] See FAO, “Budget Outlook Update,” 2022 for the FAO’s assessment of medium-term spending.
[14] The all ‘other’ programs sector includes all spending not accounted for in the health and education sectors.
[15] Enrichment is the change in spending not accounted for by population growth, aging or price inflation. For example, the demand for health services can increase due to the introduction of new technologies, rising incomes, and the underlying health of the population, among other factors. For example, if a new drug becomes available, then health care enrichment would capture increased spending to cover the increase in per capita prescription costs. See page 34 of the FAO’s “Long-Term Budget Outlook: Fiscal Implications of the Government’s Program Reforms: 2020-2050,” 2020 for a detailed discussion of program spending enrichment.
[16] The FAO’s spending outlook reflects the estimated impact of government announcements up until January 20, 2022.
[17] See Appendix A2 for more details on the FAO’s spending projection.
[18] While 2020-21 is in the past, the FAO uses 2019-20 as the base year to delineate program spending growth rates. This is done to minimize the impact of temporary spending related to the COVID-19 pandemic in 2020-21 which creates significant bias in the underlying growth rates. For example, the FAO estimates total COVID-19-related program spending of $22.3 billion in 2020-21 and $0.4 billion in 2019-20. For information on COVID-19-related spending prior to the Omicron wave, see the FAO’s Federal and Provincial COVID-19 Response Measures: 2021 Update.
[19] The FAO is projecting a modestly younger age structure over the outlook compared to previous projections.
[20] The echo boom generation is defined as those born between 1981 and 2000. For the most part, these are the children of the baby boomers, and are also known as “millennials” or “Generation Y”.
[21] See FAO, “Ontario's Energy and Electricity Subsidy Programs,” 2022.
[22] See FAO, “Provincial Infrastructure,” 2020.
[23] Historical capital spending data are unavailable prior to 2010-11. Capital expenses for this period were generated based on growth rates in provincial public investments from Statistics Canada’s Table: 36-10-0096-01.
[24] The reduction from 18 per cent to 17 per cent also includes previously announced tax cuts, including reductions in the Employer Health Tax and Education Property Tax, which come fully into effect in 2021-22. See Table A.3 on page 234 of 2020 Ontario Budget. Unannounced tax cuts that may be in the government’s fall 2021 fiscal plan are not incorporated into this projection – see the FAO’s Budget Outlook Update, 2022 for more details.
[25] For the FAO’s assumptions on revenue growth see page 21 of the FAO’s Long-Term Budget Outlook: Fiscal Implications of the Government’s Program Reforms, 2020-2050, 2020.
[26] The strong growth in taxation revenue over the next several years pushes the average annual growth rate over the outlook above historical growth. In the absence of the pandemic period, taxation revenue growth over the outlook would be slower than historical growth.
[27] Excluding the temporary increase in COVID-19 related transfers, the average annual growth rate over the projection is 4.0 per cent.
[28] Canada Social Transfer and Canada Health Transfer, Department of Finance Canada.
[29] These transfers include federal-provincial infrastructure and labour-support programs. Since most of these transfers are based on time-limited agreements, the FAO assumes that the federal and provincial governments will agree to extend these transfers over the outlook.
[30] 2021 Ontario Economic Outlook and Fiscal Review, Government of Ontario, 2021.
[31] Other revenue grew at a stronger pace than GDP over history largely due to one-time asset sales over the past several years.
[32] The baby boomers are defined as the generation born between 1946 and 1965.
[33] Generation X is defined as those born between 1966 and 1980.
[34] See FAO report Ontario’s Labour Market in 2021: Labour market experiences strong but uneven recovery.
[35] Labour productivity is defined as real economic output per hour worked. For a discussion of factors that contribute to growth in labour productivity, see the FAO’s Long-Term Budget Outlook: Fiscal Implications of the Government’s Program Reforms, 2020-2050, 2020.
[36] Ontario’s Productivity Performance, 2000-2012: A Detailed Analysis, Centre for the Study of Living Standards, 2015.
[37] The Bank of Canada’s policy of an inflation-control target which aims at keeping overall annual CPI inflation at 2.0 per cent was recently renewed.
[38] See FAO report Ontario’s Labour Market in 2021: Labour Market Experiences Strong But Uneven Recovery, 2022.
[39] Examples of lasting damage from previous recessions include low labour force participation rates, bankruptcies, and disruptions of production networks. For more information, see World Economic Outlook, April 2021, International Monetary Fund, March 2021.
[40] World Economic Outlook Update, January 2022, International Monetary Fund, January 2022.
[41] Costing Climate Change Impacts to Public Infrastructure: Project Backgrounder and Methodology, FAO, 2021.
[42] IPCC Special Report: Global Warming of 1.5°C: Summary for Policymakers, Intergovernmental Panel on Climate Change, 2018.
[43] Income in Ontario: Growth, Distribution and Mobility, FAO, January 2019.
[44] Household economic well-being during the COVID-19 pandemic, experimental estimates, first quarter to third quarter of 2020, Statistics Canada, March 2021. Distributions of household economic accounts for income, consumption and saving of Canadian households, third quarter 2021, Statistics Canada, January 2022.
[45] Redistribution, Inequality, and Growth, International Monetary Fund, 2014.
[46] The digital transformation and Canada’s economic resilience and Going digital has helped the economy through COVID-19, Bank of Canada, June 2021.
[47] PBO (2021), Fiscal Sustainability Report 2021.
[48] OECD (2013), "Fiscal sustainability", in Government at a Glance 2013.
[49] IMF (2002), Assessing Sustainability.
[50] European Commission, Sustainability of Public Finances.
[52] Enrichment is the change in spending not accounted for by population growth, aging or price inflation. For example, the demand for health services can increase due to the introduction of new technologies, rising incomes, and the underlying health of the population, among other factors. Program enrichment is assumed to begin in 2024-25. See page 34 of the FAO’s “Long-Term Budget Outlook: Fiscal Implications of the Government’s Program Reforms: 2020-2050,” 2020 for a detailed discussion of program spending enrichment.
[53] The FAO’s spending outlook reflects the estimated impact of government announcements up until January 20, 2022.
[54] See FAO, “Ministry of Health: Spending Plan Review,” 2021 and FAO, “Ministry of Long-Term Care: Spending Plan Review,” 2021.
[55] See FAO, “Ministry of Education: Spending Plan Review,” 2021.
[56] The all ‘other’ programs sector includes all spending not accounted for in the health and education sectors. It includes the following ministries: Agriculture, Food and Rural Affairs; Attorney General; Children, Community and Social Services; Colleges and Universities; Economic Development, Job Creation and Trade; Energy, Northern Development and Mines; Environment, Conservation and Parks; Finance; Francophone Affairs; Government and Consumer Services; Heritage, Sport, Tourism and Culture Industries; Indigenous Affairs; Infrastructure; Labour, Training and Skills Development; Municipal Affairs and Housing; Natural Resources and Forestry; Seniors and Accessibility; Solicitor General; Transportation; and Treasury Board Secretariat. The ‘other programs’ sector also includes the Executive Offices (Cabinet Office, Office of the Lieutenant Governor, and Office of the Premier) and the Legislative Offices.
[57] See FAO, “Ontario's Energy and Electricity Subsidy Programs,” 2022.
[58] The FAO assumes that current government policies will expire by the 2030s and result in relatively higher program enrichment spending. Overall, the FAO assumes program enrichment in the 2030s and 2040s for all ‘other’ programs that is largely consistent with historical averages, with the exception of electricity price mitigation programs, which the FAO estimates will cost $4.2 billion by 2039-40 versus $6.3 billion in 2030-31.